New Honeycomb Integrations for PostgreSQL
By Eben Freeman | Last modified on January 11, 2019We’re excited to announce that you can now use honeytail and rdslogs to send your Postgres query logs to Honeycomb. Honeycomb helps you answer the following questions (and more) about your database workload:
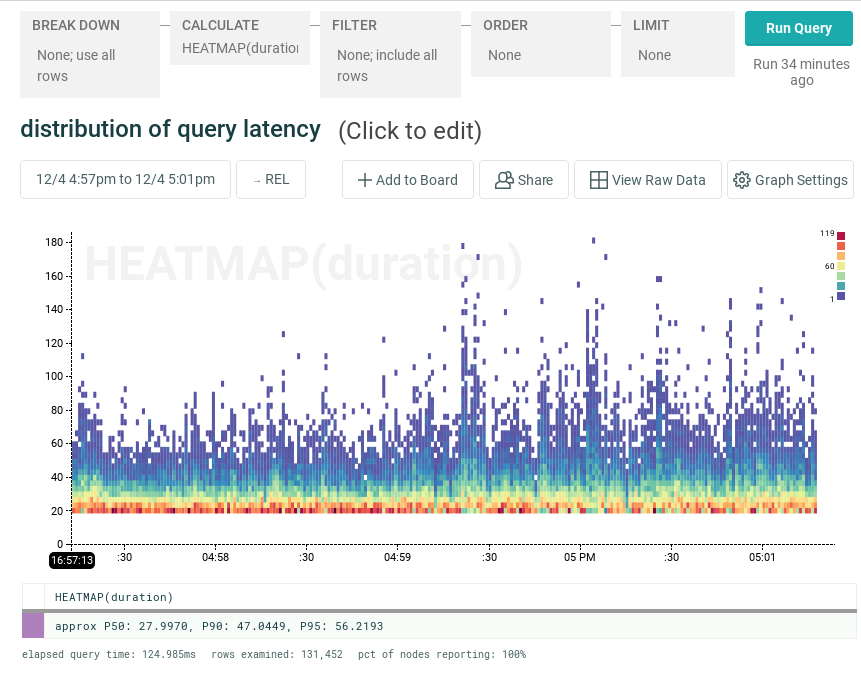
“What does the overall distribution of query latency look like?”
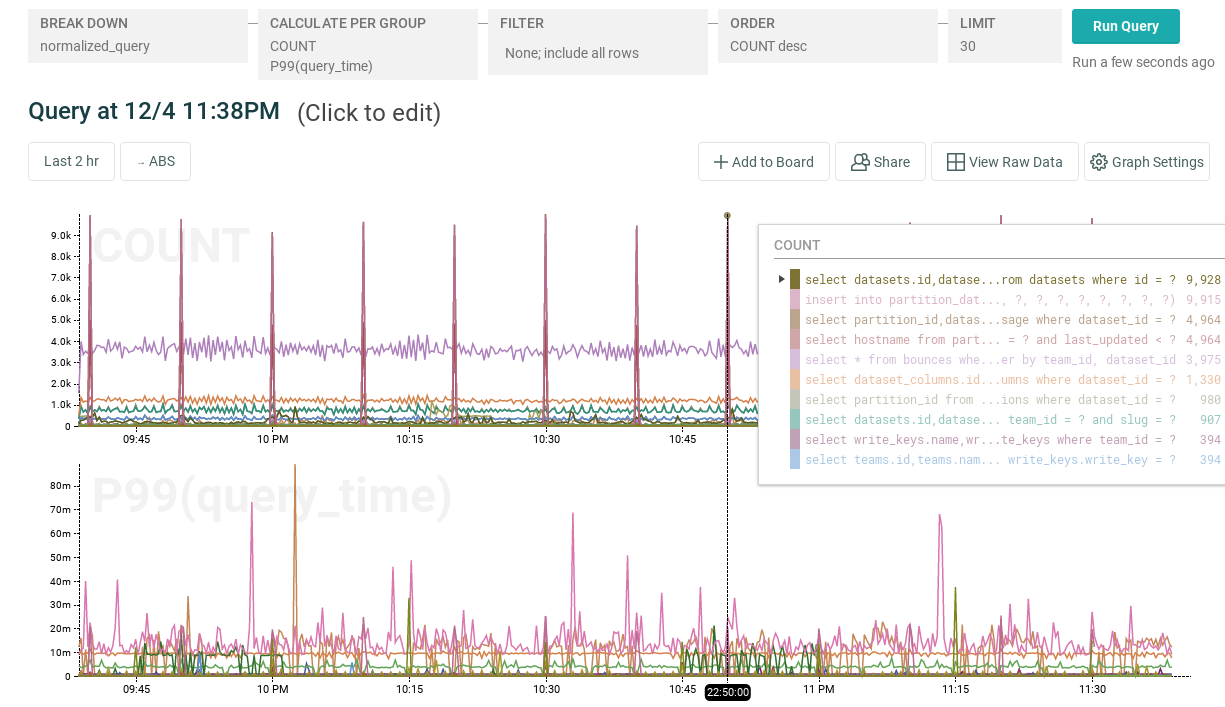
“Which queries are responsible for the spikes in query volume that we’re seeing?”
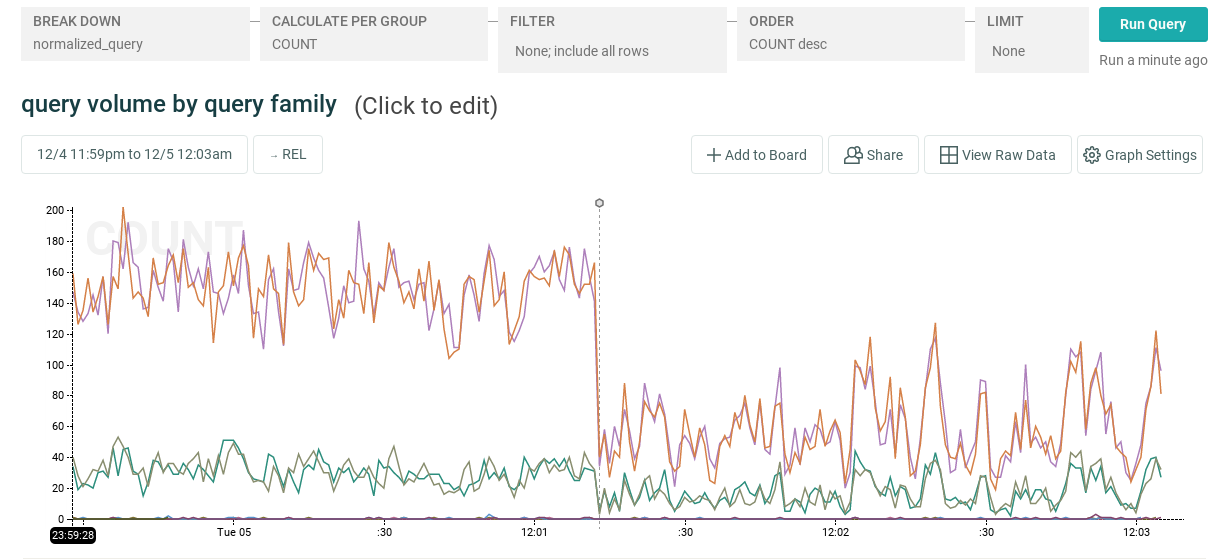
“How did our query workload change after the latest deploy?”
What real observability gets you
Overall database statistics such as blks_read and blks_hit are useful for general tuning, but don’t tell you much about the actual queries your application is running, or how those queries are performing. Query summaries from pg_stat_statements give you an overview of your database’s query workload, but won’t tell you how that workload is changing over time. Importantly, they also don’t tell you anything about individual queries. If instead of a single bad query, you have a single bad user who’s causing excess query volume, how will you tell?
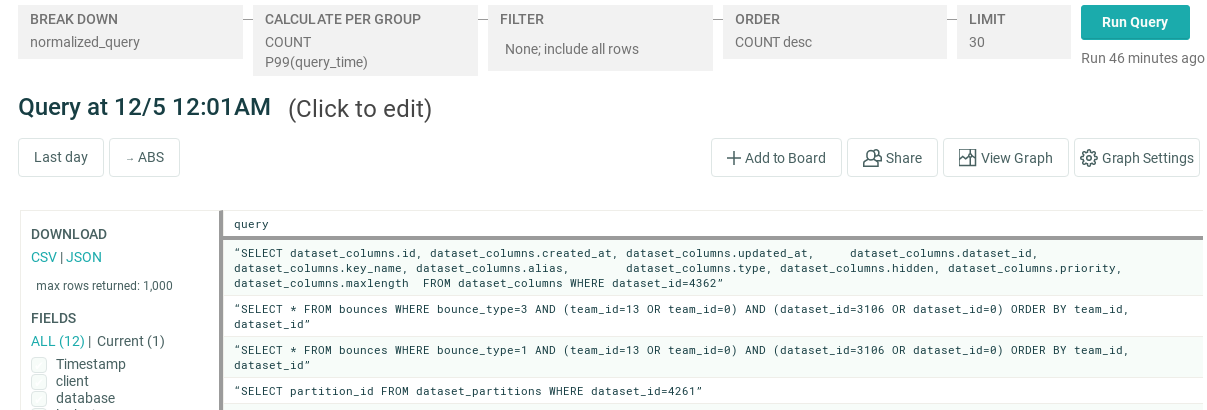
In order to account for database resources not just by query type, but by individual user, you need to retain information about individual raw queries. But amassing a giant query log file isn’t enough if you can’t easily break it down to find what you’re looking for:
- Which query families are most common?
- Are queries uniformly slow, or are there latency outliers?
- Is one client sending too much traffic?
- How is our workload changing over time?
The Honeycomb integrations collect raw queries as well as normalized versions of queries, making it easy to identify both overall patterns and individual outliers.
Give it a try
If you’re running Postgres yourself, honeytail will consume your query logs and ship them off to Honeycomb. If you’re using Amazon RDS, rdslogs automates the process of downloading your log files from AWS, parsing their contents, and sending extracted events to Honeycomb. You can get started right away:
wget -q -O rdslogs https://www.honeycomb.io/download/rdslogs/1.53
echo 'eb877392fa12fc1e2ae6735a3f6d726e140502a3228fdce66f45472adb7a9227  rdslogs' | sha256sum -c &&
chmod 755 ./rdslogs
rdslogs -i YOUR_RDS_INSTANCE_IDENTIFIER --writekey=YOUR_HONEYCOMB_WRITE_KEY
  --output=honeycomb --dataset='RDS PostgreSQL' --dbtype=postgresql
Check out the docs to get started, and don’t hesitate to get in touch if you have questions!
Related Posts
Introducing Relational Fields
Expanded fields allow you to more easily find interesting traces and learn about the spans within them, saving time for debugging and enabling more curiosity...
Safer Client-Side Instrumentation with Honeycomb's Ingest-Only API Keys
We're delighted to introduce our new Ingest API Keys, a significant step toward enabling all Honeycomb customers to manage their observability complexity simply, efficiently, and...
Now Available: Honeycomb Launches Data Residency in Europe
At Honeycomb, we are very concerned about privacy and data sovereignty—it’s something we take very seriously, and in an effort to serve our customers better,...