How Honeycomb Uses Honeycomb, Part 4: Check Before You Change
By Ben Hartshorne | Last modified on January 11, 2019This post continues our dogfooding series from How Honeycomb Uses Honeycomb, Part 3: End-to-end Failures.
As Honeycomb matures, we try to roll out changes as smoothly as possible to minimize surprise on the part of our customers. Part of that relies upon understanding, intimately, the effect of a change and its potential user impact.
We made a couple small changes to our API recently, and were able to use our dogfood cluster to make informed decisions about the planned changes.
Episode 1: This change is obviously good, right?
Our API accepts flat JSON objects: a single map with keys and values. We map these keys to columns in our data layer and store the values for later consumption by the UI. Customer Alice came along one day and said, “I have this existing object but all the timings are stored in a sub-object. Can you unpack it for me?”
{
  "request": "/1/api/bigthing",
  "status": 200,
  "timings": {
    "decode_start_ms": 0.22,
    "decode_dur_ms": 4.12,
    "db_start_ms": 4.34,
    "db_dur_ms": 92.08,
    "encode_start_ms": 96.42,
    "encode_dur_ms": 5.77,
    "finish_ms": 102.19
  }
}
That’s a lovely JSON object with wonderful information about a service’s performance; we’d love to unpack it automagically — but we have existing users, with existing datasets streaming to our API, and we try to minimize unpleasant surprises.
We don’t want to simply deploy the straightforward solution (blindly creating new columns based on concatenating the top and sub level keys) so we tweaked the logic: instead of directly unpacking the JSON, we first report to our dogfood cluster whether the payload contained nested JSON, how deep it went, and how many columns it would have created. How much traffic (total volume) is coming in with nested JSON and how many datasets (unique customers) do those events represent?
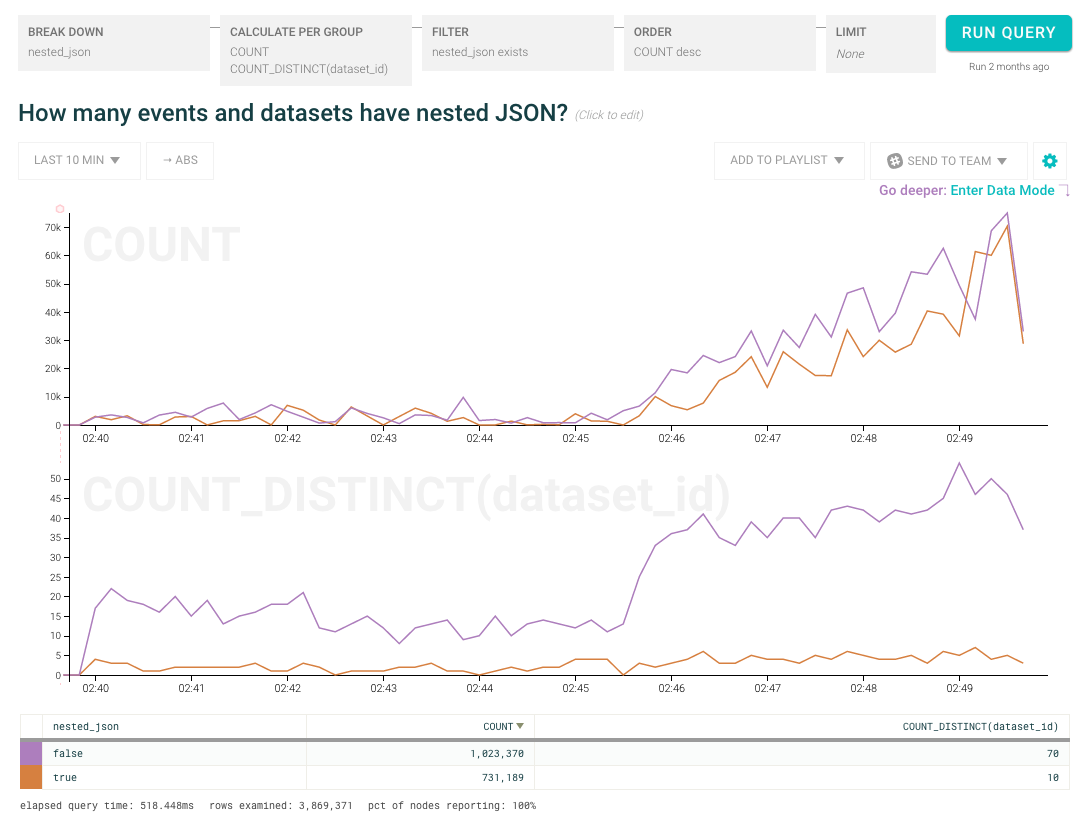
Hey!! Surprise!! We found that there were few datasets sending us nested JSON but those few were sending us a lot of traffic. Looking a little more closely at the raw data, we found that Customer Bob was sending us traffic that would add an enormous number of columns to his dataset (and cause unspeakable mayhem if we simply flipped the switch to turn on automatic JSON unpacking). Plus, there were several other customers sending various levels of nested JSON for whom this would be a surprising change.
As a result of checking its effects before enacting the change in behavior, we made unpacking JSON an opt-in-per-dataset feature rather than turning it on by default.
Episode 2: Swapping out the engines - do they work the same way?
The first version of rate limiting on our API was implemented using an in-process cache, with each server in our cluster calculating the rate limit individually. While this succeeded at one desired effect (protecting our infrastructure from accidentally getting flooded by new traffic), it had a few undesirable traits:
- changing the size of our cluster affected the rate limits imposed on a per-customer basis
- the pattern of traffic from the load balancer influenced the rate limit imposed
As we grew, we needed to make sure that our rate limits were being evenly enforced. It was time to spin up a shared cache so all servers could collaborate on their rate limits and collectively apply the rules appropriately.
Having learned our lesson from Episode 1, the initial implementation of the shared memory cache ran in parallel with the existing in-memory rate limit. Every event that hit our API had its rate limit chosen by the existing rate limiting algorithm, but our dogfooding cluster also tracked whether it would have been rate limited by the new algorithm.
Suddenly, we have a query easily managed by Honeycomb: show me all requests that got through that would have been rate limited by the new algorithm:
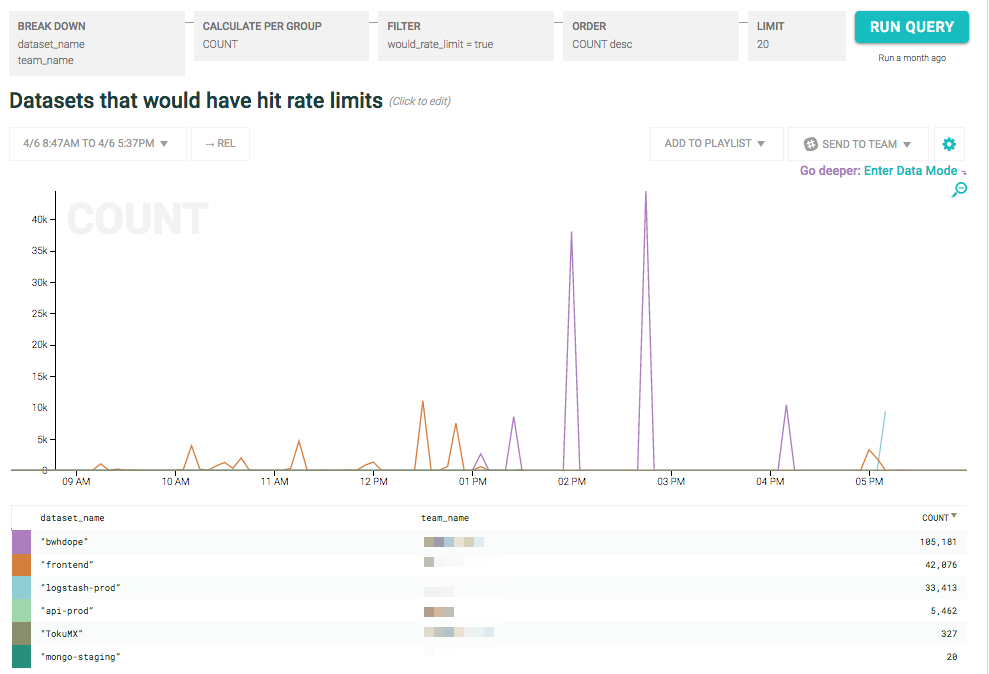
As expected, the new rate limiting algorithm was more strict in a number of places, especially around large spikes. We had enough information here to let us examine each case individually and assess whether the change was what we intended! Additionally, by knowing which datasets and which customers were affected by the changed implementation, we could work with them individually to help them understand the change in behavior.
This is another installation in a series of dogfooding posts showing how and why we think Honeycomb is the future of systems observability. Stay tuned for more!
Curious? Give us a try!
Honeycomb can give your engineering team the power to predict the future, too — sign up today and starting slicing KPIs by customers to understand the impact of each significant change you make to your platform.
Related Posts
Introducing Relational Fields
Expanded fields allow you to more easily find interesting traces and learn about the spans within them, saving time for debugging and enabling more curiosity...
Real User Monitoring With a Splash of OpenTelemetry
You're probably familiar with the concept of real user monitoring (RUM) and how it's used to monitor websites or mobile applications. If not, here's the...
Transforming to an Engineering Culture of Curiosity With a Modern Observability 2.0 Solution
Relying on their traditional observability 1.0 tool, Pax8 faced hurdles in fostering a culture of ownership and curiosity due to user-based pricing limitations and an...