
Watch our chaos engineering webinar.
As part of our recent failure testing project, we ran into an interesting failure mode involving the OpenTelemetry SDK for Go. In this post, we’ll show you why our apps stopped sending telemetry for over 15 minutes and how we enabled keepalives to prevent this kind of failure from happening in the future.
Beagle goes silent 🐶
Normally, our apps happily send their telemetry with no interruption, and we get rich observability data to help us understand how our code behaves in production. We use Honeycomb to monitor Honeycomb, with services in our production environment sending observability data to a separate instance of Honeycomb that we call Dogfood. Dogfood services in turn send their telemetry to Kibble. Only our production instance of Honeycomb serves customer traffic (ui.honeycomb.io).
In the availability zone (AZ) failure testing project, we wanted to learn how our systems would behave during an unexpected failure in AWS, our cloud provider. We simulated failures in Kibble, and that’s when we learned something interesting: some of our apps in Dogfood stopped sending their telemetry to Kibble for over fifteen minutes! This happened even though Kibble handled the failure test smoothly and continued operating normally. What was happening?
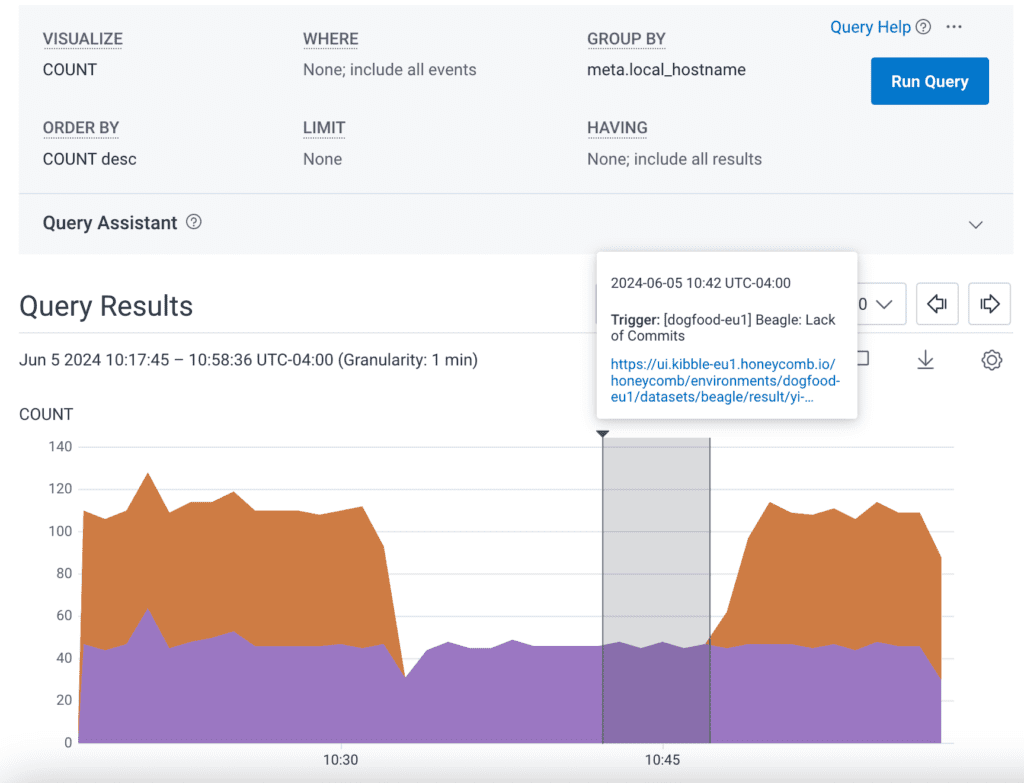
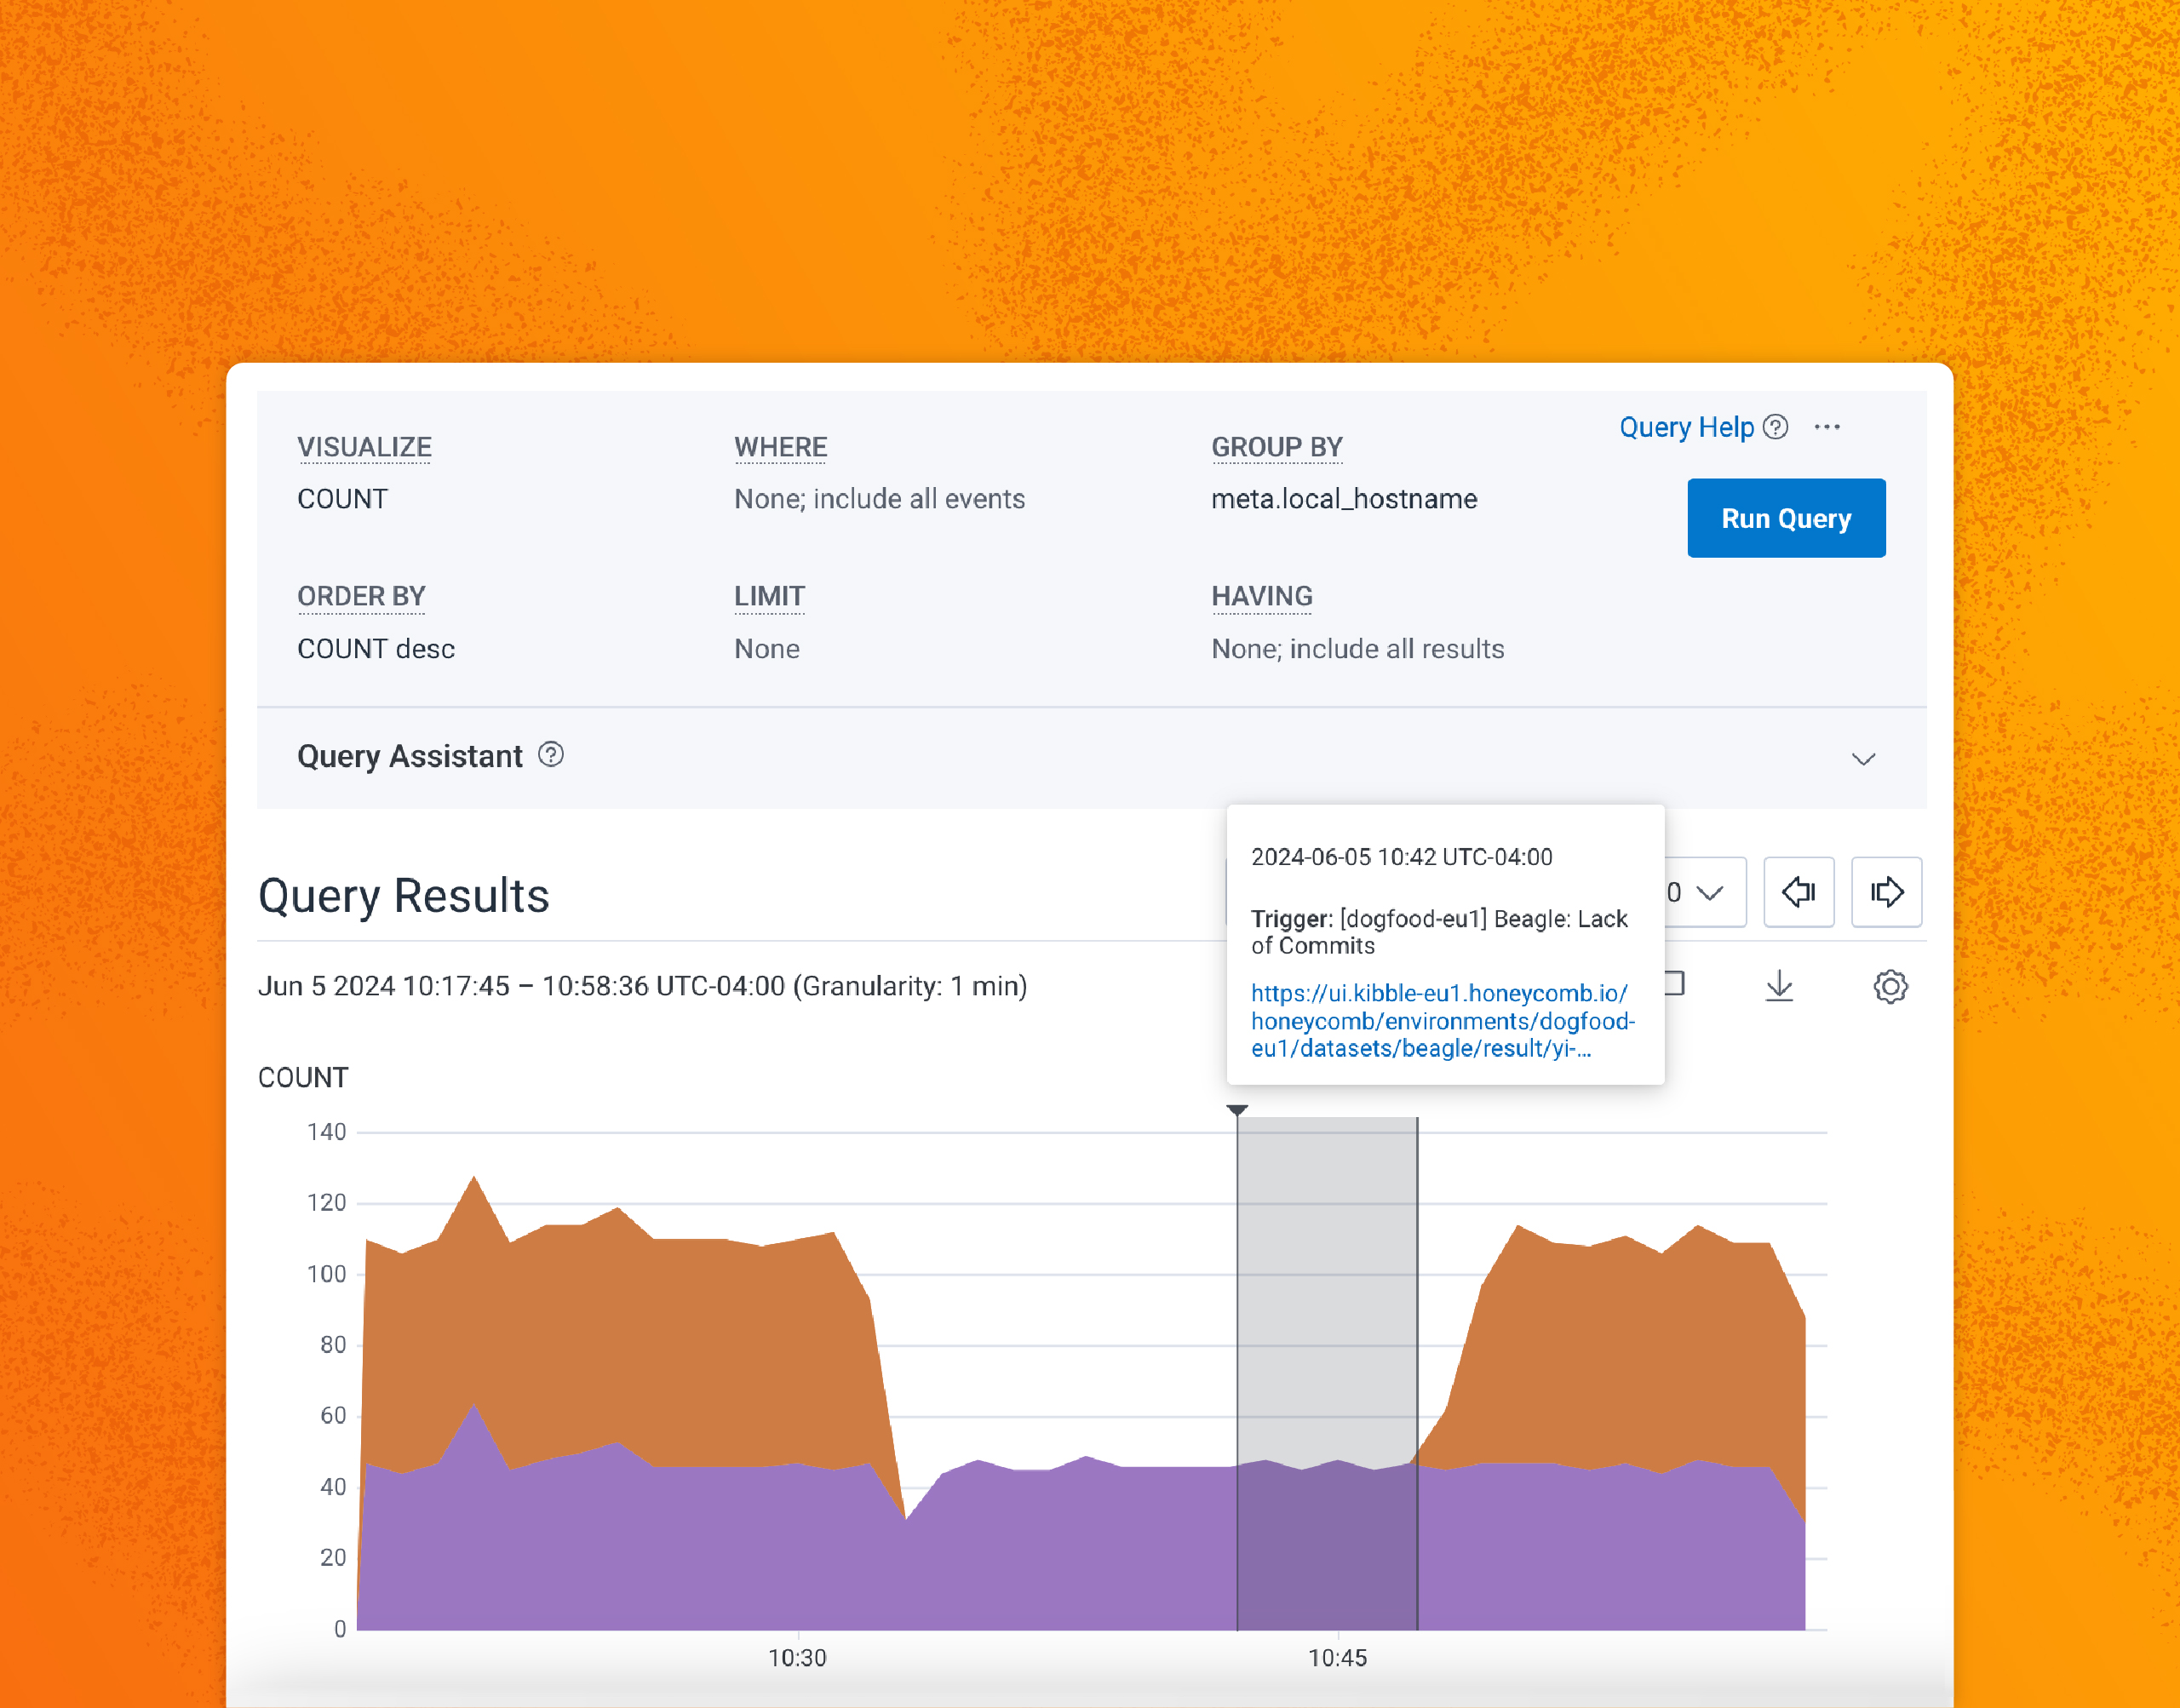
This graph shows the number of events sent by Dogfood for our service Beagle, which does stream processing for SLOs. In Dogfood, two Beagle instances split the load, with each processing half. The graph shows that one of the two Beagles stopped sending telemetry for roughly 15 minutes. After 10 minutes, we got an alert that one of the Beagles was not processing SLO data. In fact, it was still working perfectly, but the lack of telemetry caused a false alert from our Trigger running in Kibble.
Lacking the usual telemetry from the Beagle worker in question, our next debugging strategy was to look at its logs:
$ kubectl logs beagle-78f9756c69-9c5l6
2024/06/05 14:33:27 traces export: context deadline exceeded: rpc error: code = DeadlineExceeded desc = context deadline exceeded
2024/06/05 14:33:42 traces export: context deadline exceeded: rpc error: code = DeadlineExceeded desc = context deadline exceeded
2024/06/05 14:33:57 traces export: context deadline exceeded: rpc error: code = DeadlineExceeded desc = context deadline exceeded
2024/06/05 14:34:27 traces export: context deadline exceeded: rpc error: code = DeadlineExceeded desc = context deadline exceeded
2024/06/05 14:34:37 traces export: context deadline exceeded: rpc error: code = DeadlineExceeded desc = context deadline exceeded
2024/06/05 14:34:47 traces export: context deadline exceeded: rpc error: code = DeadlineExceeded desc = context deadline exceeded
Around every ten seconds, Beagle was trying to send its traces and timing out. Then it would back off and try again. Meanwhile, Kibble was still up and running and accepting telemetry from other apps, including the other Beagle worker. What was going on here? I had a hunch.
Timeouts and latency
In a normal TCP connection, both ends are aware of the connection and regularly exchange packets. A program on host A asks its operating system to send a chunk of data. The OS obliges by sending a packet and waiting for the response (I’m glossing over a lot here, but bear with me). The OS on host B receives the packet, delivers the data to the waiting program, and sends an ACK (acknowledgement) packet back to host A to indicate to its OS that the data has reached its recipient.
What happens if the receiving side just… disappears? This can occur in the case of a network outage—for example, if an AZ fails abruptly, or if a backhoe ruins someone’s day by severing a fiber optic link.
In our example, host B never receives the packet and never sends the ACK back. Host A keeps waiting for the ACK. The rules of TCP say that host A can continue trying to send a few more packets, but eventually, it’s going to have to wait to get some ACKs back.
What happens if the network connection is just slow? Following our example, things look exactly the same, with the exception that eventually, host A does receive an ACK from Host B. The only difference is time. By default, Linux will wait seemingly indefinitely for that ACK to arrive—more on that later.
Testing the theory
To investigate what was going on with Beagle, I collaborated with our Pipeline team. They are responsible for the libraries apps use to get observability data into Honeycomb. We suspected that Beagle was holding a connection open to a portion of Kibble’s infrastructure that our AZ failure test was abruptly shutting off. How could we find out for sure?
Our plan was to simulate an AZ failure in Kibble and check whether Beagle (or any of our other apps) stopped sending telemetry. We’d pick a specific Kubernetes pod, open a shell inside it, and examine its network stack. We got some very interesting results:
honeycomb@beagle-58fd8c9958-2wm4z:~$ netstat -tpn
Active Internet connections (w/o servers)
Proto Recv-Q Send-Q Local Address           Foreign Address         State       PID/Program name
tcp        0  10645 10.14.211.55:40204      54.228.177.31:443       ESTABLISHED 1/beagle
tcp        0      0 10.14.211.55:34358      10.12.197.224:3306      ESTABLISHED 1/beagle
tcp        0      0 10.14.211.55:43450      10.12.143.251:9092      ESTABLISHED 1/beagle
tcp        0      0 10.14.211.55:35224      10.12.211.198:9092      ESTABLISHED 1/beagle
tcp        0      0 10.14.211.55:45770      52.209.147.212:443      ESTABLISHED 1/beagle
tcp        0      0 10.14.211.55:36602      10.12.150.249:3306      ESTABLISHED 1/beagle
tcp        0      0 10.14.211.55:36350      54.86.246.63:443        ESTABLISHED 1/beagle
tcp        0      0 10.14.211.55:55880      10.12.152.71:9092       ESTABLISHED 1/beagle
tcp        0 136217 10.14.211.55:40202      54.228.177.31:443       ESTABLISHED 1/beagle
tcp        0      0 10.14.211.55:53430      10.12.182.98:9092       ESTABLISHED 1/beagle
tcp        0      0 10.14.211.55:56192      10.12.197.224:3306      ESTABLISHED 1/beagle
tcp        0      0 10.14.211.55:56190      10.12.197.224:3306      ESTABLISHED 1/beagle
tcp6       0      0 10.14.211.55:6060       10.14.141.141:32866     ESTABLISHED 1/beagle
tcp6       0      0 10.14.211.55:6060       10.14.141.141:60658     ESTABLISHED 1/beagle
This netstat command asks for the following:
- -t: show all active TCP connections
- -p: list the process ID making the connection
- -n: don’t resolve IP addresses
The connections to 54.228.177.31:443 immediately caught our eye, especially the Send-Q values. This is the number of bytes of data outstanding, waiting for the kernel to send them over the TCP connection. By repeating our netstat command, we saw that this number kept slowly rising—around every ten seconds! Typically, Send-Q should be zero—or close to zero and not increasing.
The fix
The Pipeline team explained that Beagle and many of our other apps use opentelemetry-go to send their metrics and traces to Honeycomb over a gRPC connection. The code to create the gRPC connection looks like this:
traceExporter, err = otlptracegRPC.New(
    	ctx,
    	secureOptionTrace,
    	otlptracegRPC.WithEndpoint(url),
    	otlptracegRPC.WithHeaders(map[string]string{
            	"x-honeycomb-team":	writeKey,
            	"x-honeycomb-dataset": traceDataset,
            	"ContentType":     	"application/gRPC",
    	}),
)
The opentelemetry-go library offers multiple ways to create the gRPC connection:
- passing a URL (opentelemetry-go creates the connection using grpc-go with default dial options)
- passing a URL with dial options (opentelemetry-go creates the connection using your dial options)
- passing a gRPC connection that you’ve opened yourself
The grpc-go library has the ability to detect when a gRPC connection has stopped working through the use of keepalives. On a configurable interval, it sends a “ping” packet and listens for a “pong.” If the “pong” doesn’t arrive by a configurable timeout, grpc-go terminates the connection and opens a new one. That’s what we wanted!
The code above uses option one though, and the default dial options have keepalives disabled. We needed to use one of the other two options to enable keepalives. Here’s how we did that:
var kacp = keepalive.ClientParameters{
    Time:                10 * time.Second, // send pings every 10 seconds if there is no activity
    Timeout:             2 * time.Second,  // wait 2 seconds for ping ack before considering the connection dead
    PermitWithoutStream: false,            // match the shepherd side setting, otherwise we'll get GoAway
}

traceExporter, err = otlptracegrpc.New(
    ctx,
    secureOptionTrace,
    otlptracegrpc.WithEndpoint(url),
    otlptracegrpc.WithDialOption(grpc.WithKeepaliveParams(kacp)),
    otlptracegrpc.WithHeaders(map[string]string{
        "x-honeycomb-team":    writeKey,
        "x-honeycomb-dataset": traceDataset,
        "ContentType":         "application/gRPC",
    }),
)
Testing the fix
This looked promising, but how could we be sure that our fix worked? We needed to induce a failed TCP connection and watch grpc-go detect the failure, close the connection, and open a new one.
One idea we had was to create a simple testbed with two pods and a gRPC connection between them, then kill one of the pods. This doesn’t work though. On Linux, when you kill a process, the kernel cleans up all of its TCP connections, sending a FIN or RST packet to the other end to signify that the connection is closed. This happens even in the case of a SIGKILL (kill -9), which abruptly terminates a process.
This is why it’s so difficult to catch this kind of problem in development and why this bug has only surfaced now, after lurking in our codebase for years. Abrupt connection failures are extremely rare, and normal unit and integration tests don’t simulate them. In fact, connections over the loopback interface in Linux (127.0.0.1) bypass parts of the TCP stack entirely, so you need to use multiple machines.
The easiest way we could test our fix was to perform another AZ failure test in Kibble. This time, we paid attention to the IP addresses served for DNS requests for Kibble’s gRPC API endpoint (the equivalent of api.honeycomb.io). Normally, three IP addresses were returned—one per AZ—but during an AZ failure test, AWS’s Application Load Balancer automatically removes one IP from the DNS because it’s in the AZ that has failed.
We used netstat to look at the IPs that each Beagle pod was connected to, then started the AZ failure test. We noted which IP disappeared from DNS and used that to determine which Beagle pod was connected to the AZ that failed. Then, we checked netstat again, and sure enough, that Beagle had connected to a new IP! A quick query in Kibble showed us that Beagle’s telemetry had continued uninterrupted, and we knew our fix had done its job.

Always enable keepalives!
I’ve run into the problem of failed TCP connections many times in my career. It’s especially pervasive because, by default, Linux doesn’t close connections until over two hours after ACKs go missing. You can tune this in /proc/sys/net/ipv4/tcp_keepalive_time, but it’s often better to enable keepalives at the application level instead to be sure the application handles failures robustly.
Now’s a great time to enable keepalives in all of your apps, especially those that send telemetry to Honeycomb over a gRPC connection. Better yet, you can ferret out apps that need keepalives by simulating network failures through chaos engineering.