Discover the hidden reality of your systems with our observability platform
Discover the hidden reality of your systems with our observability platform
Discover the hidden reality of your systems with our observability platform
Our datastore and query engine are purpose-built to detect patterns across billions of requests in under 3 seconds, even with highly granular data, where problems lurk behind any arbitrary combination of attributes.
A better way to understand user experience
Honeycomb’s unique datastore makes it possible for you to investigate user experience and quickly hone in on problems.
Unlike legacy APM tools you no longer have to jump from tool to tool to connect the dots. Instead, Honeycomb organizes your telemetry data for fast, accurate exploration from the same UI, regardless of data type, allowing you debug issues for a single user or complex patterns across multiple users and services.
The Old Way
Check multiple tracing, log analysis, metrics and other monitoring tools. Constant context-switching. Still guessing and no answers.

The Honeycomb Way
Check one place. Quickly isolate the correct source of issues. Find surprising and often unpredictable answers.

Fast software development feedback loops
Get real-time reality checks on how your code behaves and performs, during all lifecycle stages, so you can ship performant features reliably and solve problems faster.

Fast feedback on real-world performance
When you deploy your code, use Honeycomb to instantly watch how your new feature behaves in the chaotic real world. Then use our fast feedback loop to iterate and improve your code. Honeycomb’s fast feedback loop connects developers to customers so they can see real user experiences which are based on as many dimensions and rich context you’d like to be able to analyze.
Fast feedback on service reliability
Service Level Objectives (SLOs) alert you to the most important user experience issues and are immediately debuggable using Honeycomb analysis workflow so you can quickly and correctly isolate the problem. When you deploy a fix, Honeycomb’s real-time telemetry querying capabilities let you immediately verify if your fix had the intended effect. All from one consistent place.

Faster
release cycles
Happier
customers
Happier, higher-performing
engineering teams
More time
for innovation
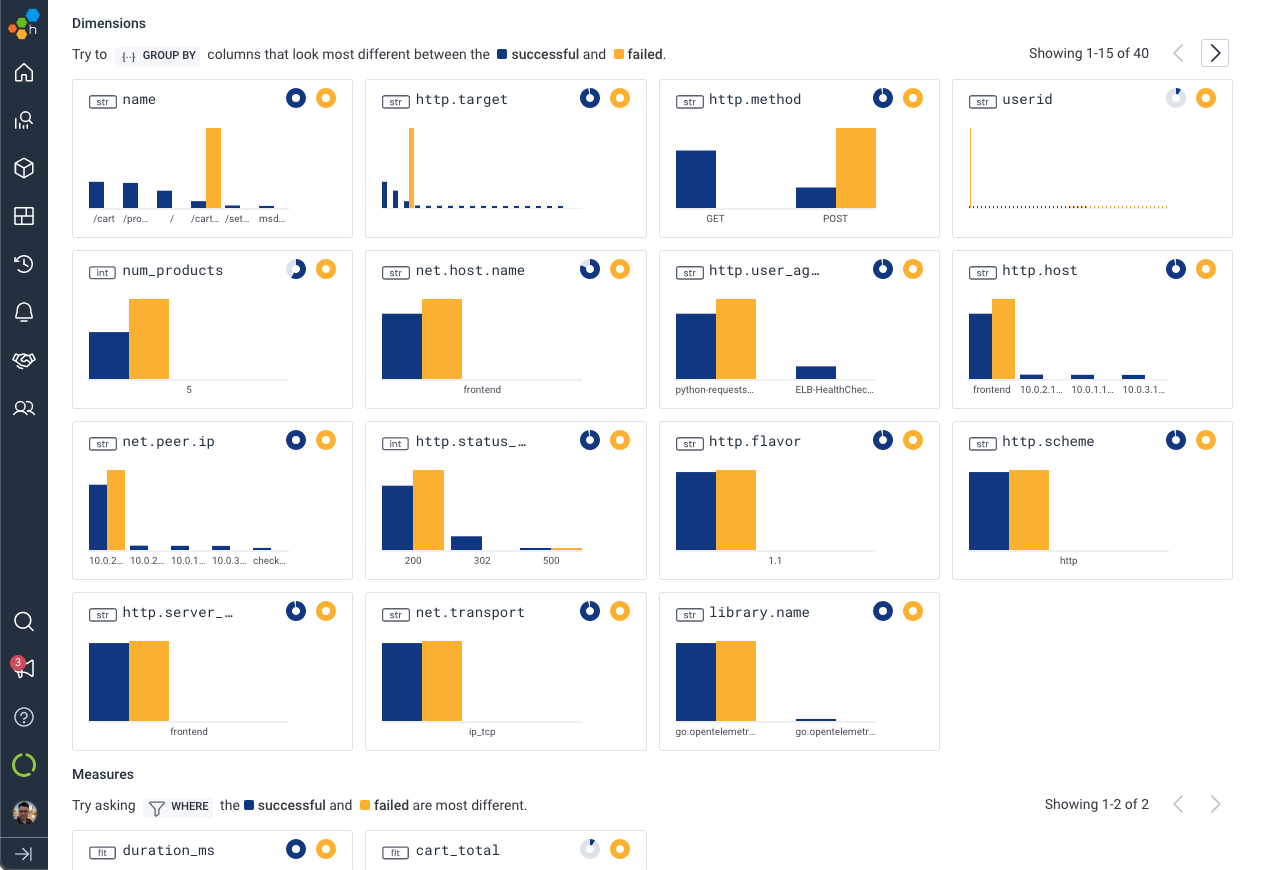
Easily find outliers with BubbleUp
Better then the usual traditional debugging tools, BubbleUp dramatically speeds up debugging by automatically detecting commonalities in outlier conditions. Highlight anomalies in your visualizations and query results so that BubbleUp can quickly show how they’re different by comparing thousands of high-cardinality and high-dimensionality events against a baseline to surface where to dig in next.
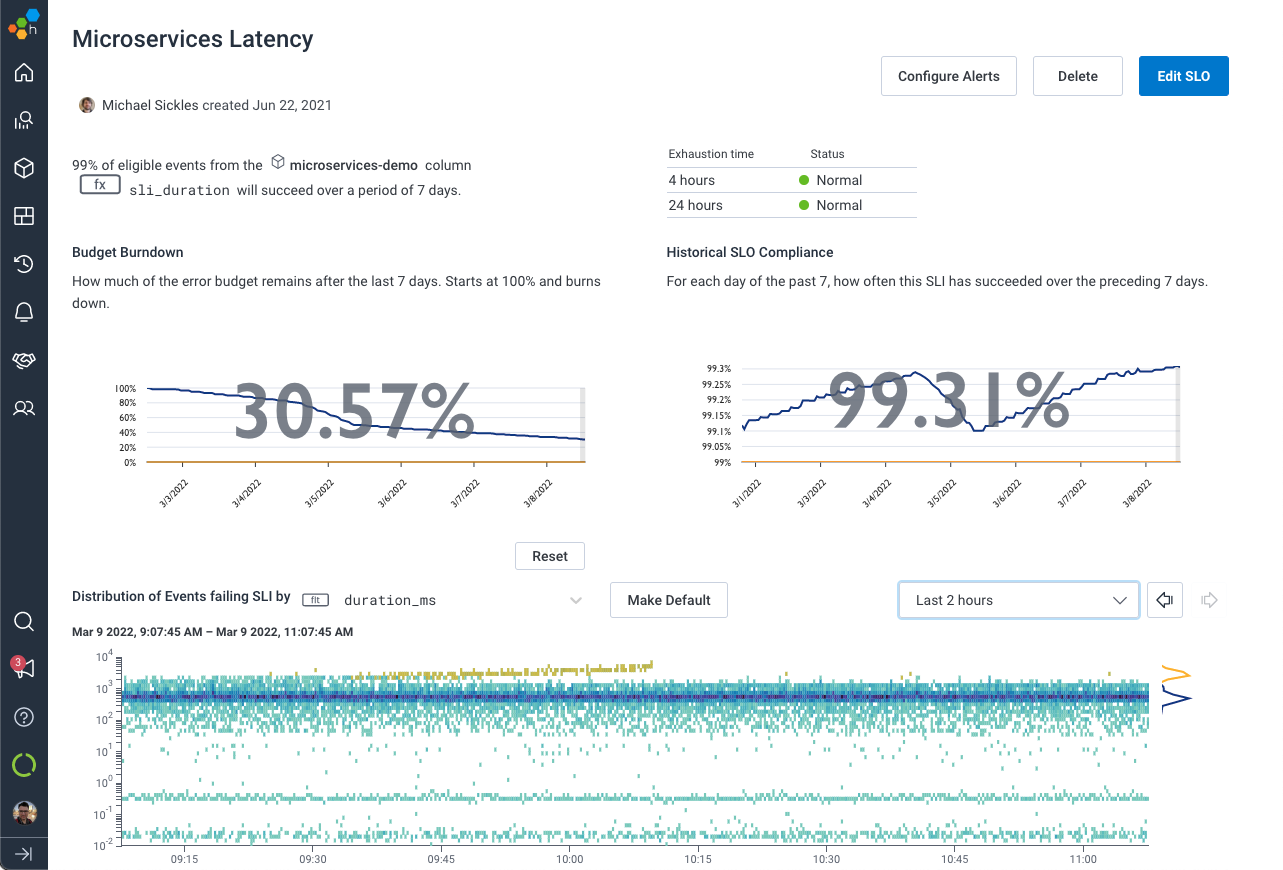
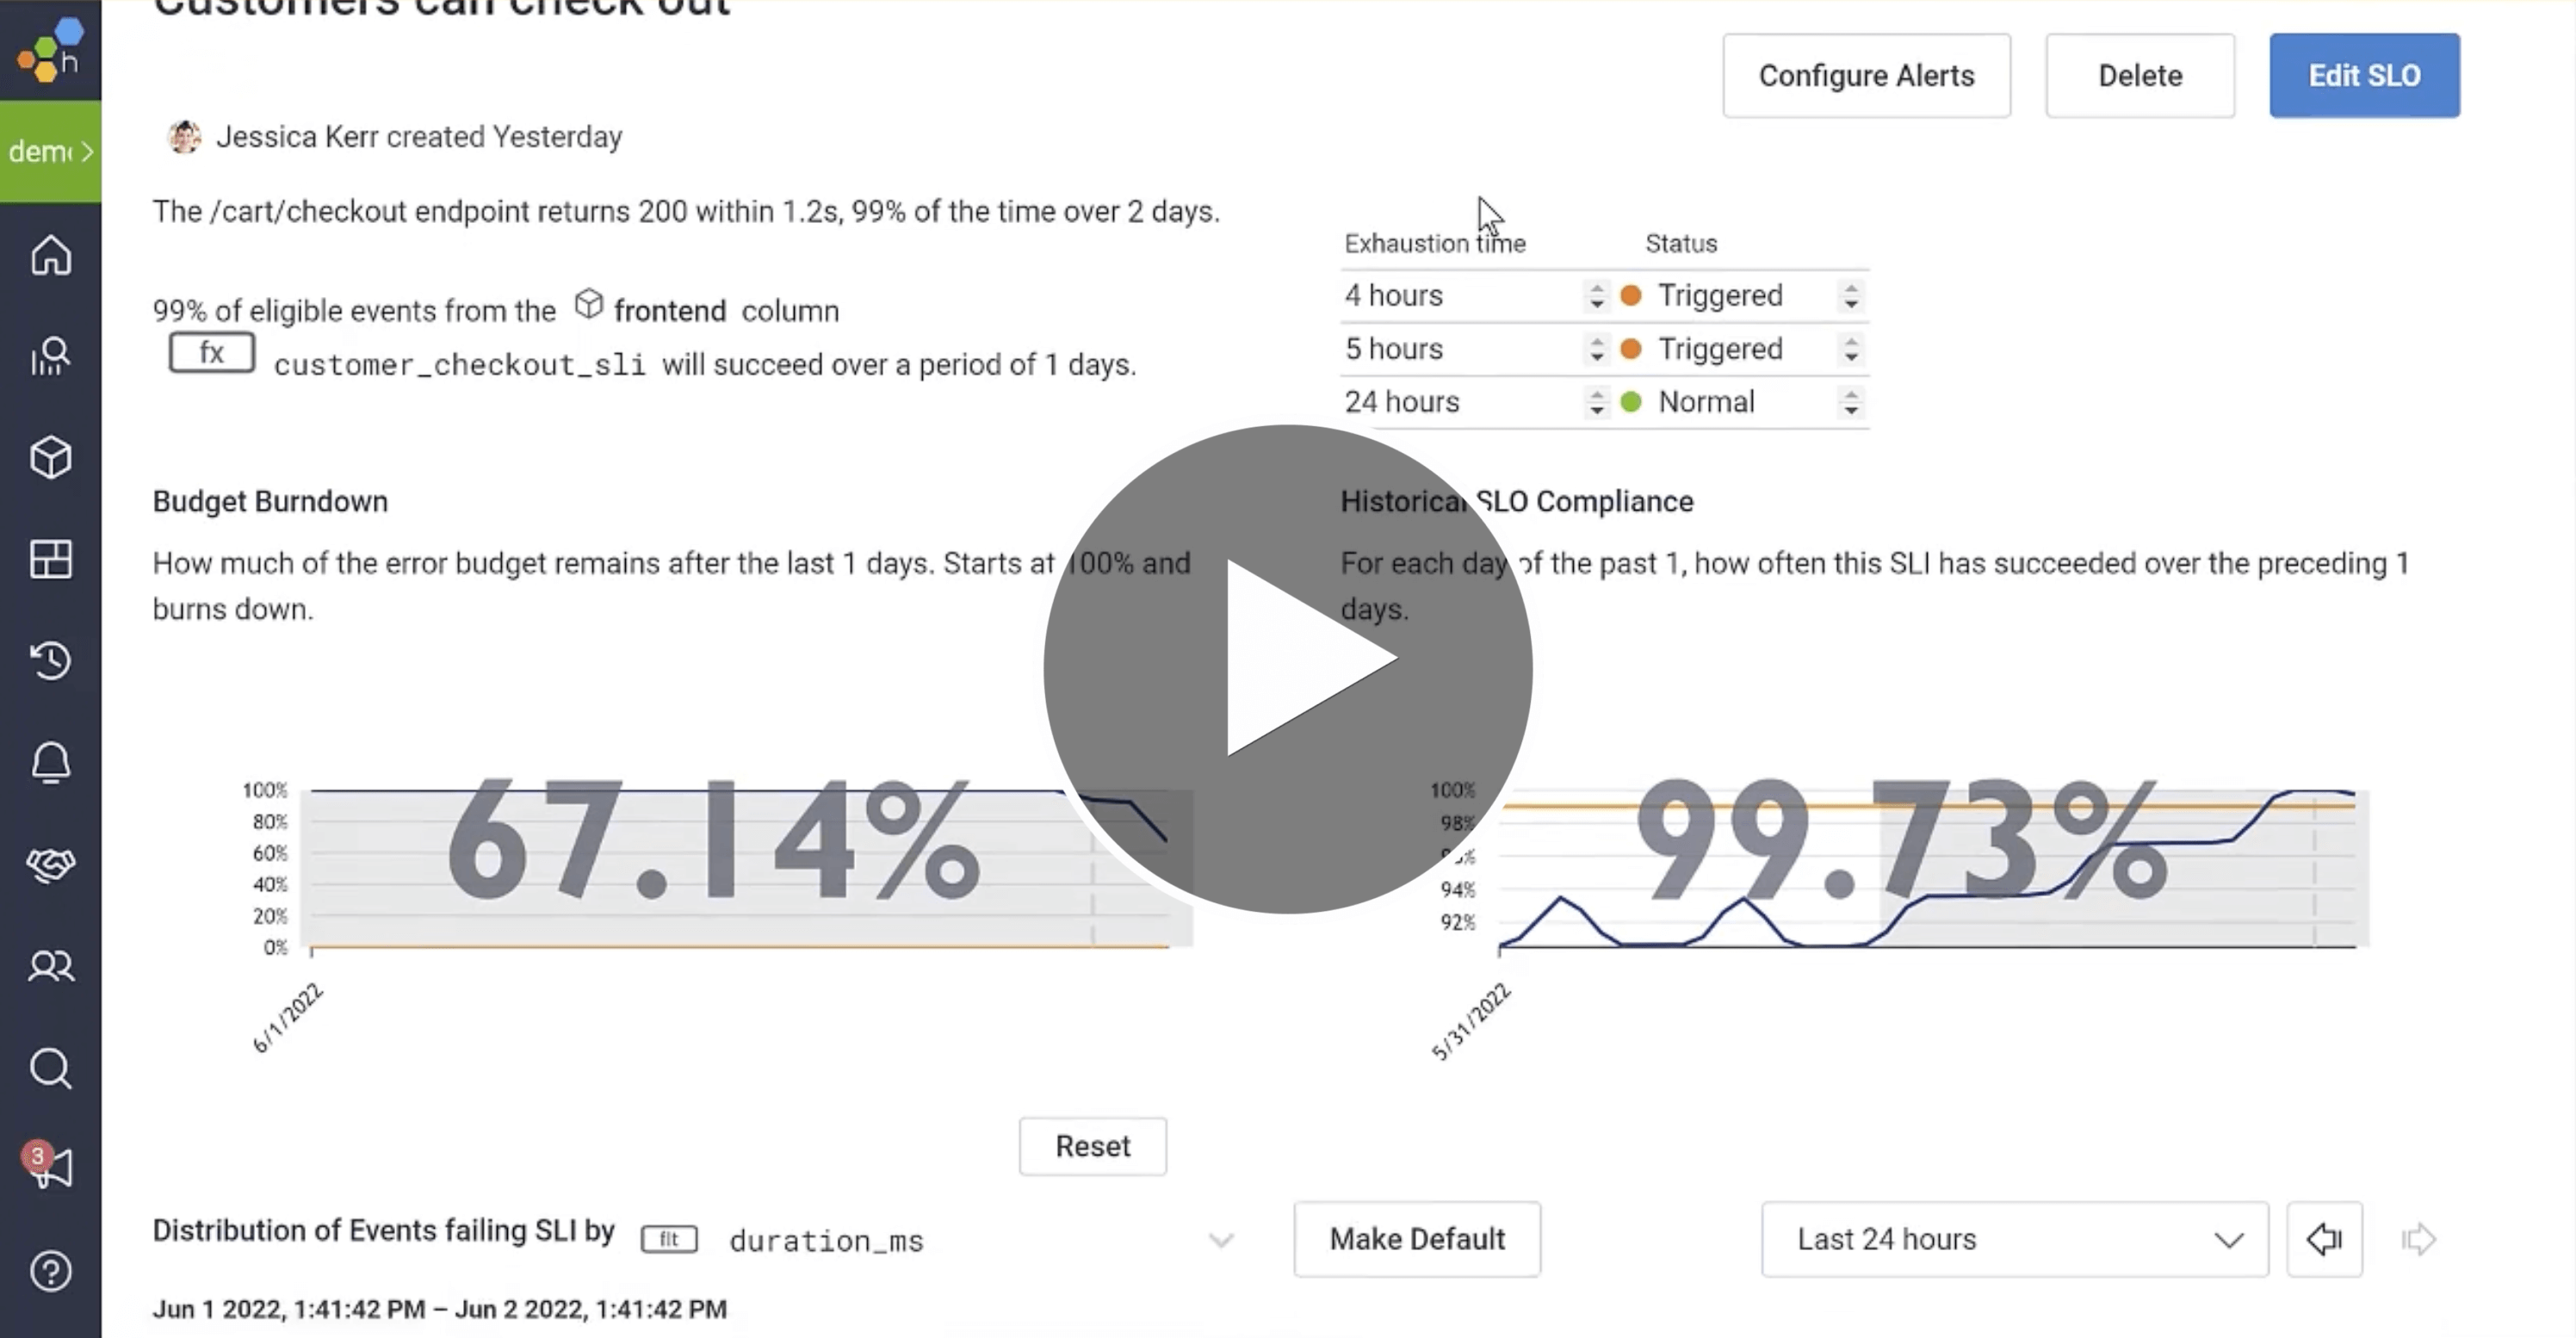
Prioritize engineering time with Service Level Objectives (SLOs)
Honeycomb SLOs make it possible to trigger alerts on issues that matters most to the business and quickly debug them. They also help you answer important questions like, “How much monthly downtime is tolerable? What performance impact is acceptable before users are negatively impacted? Should we focus on new features or tech debt?” Define, measure, validate, and adjust engineering priorities collaboratively across your org with SLOs.
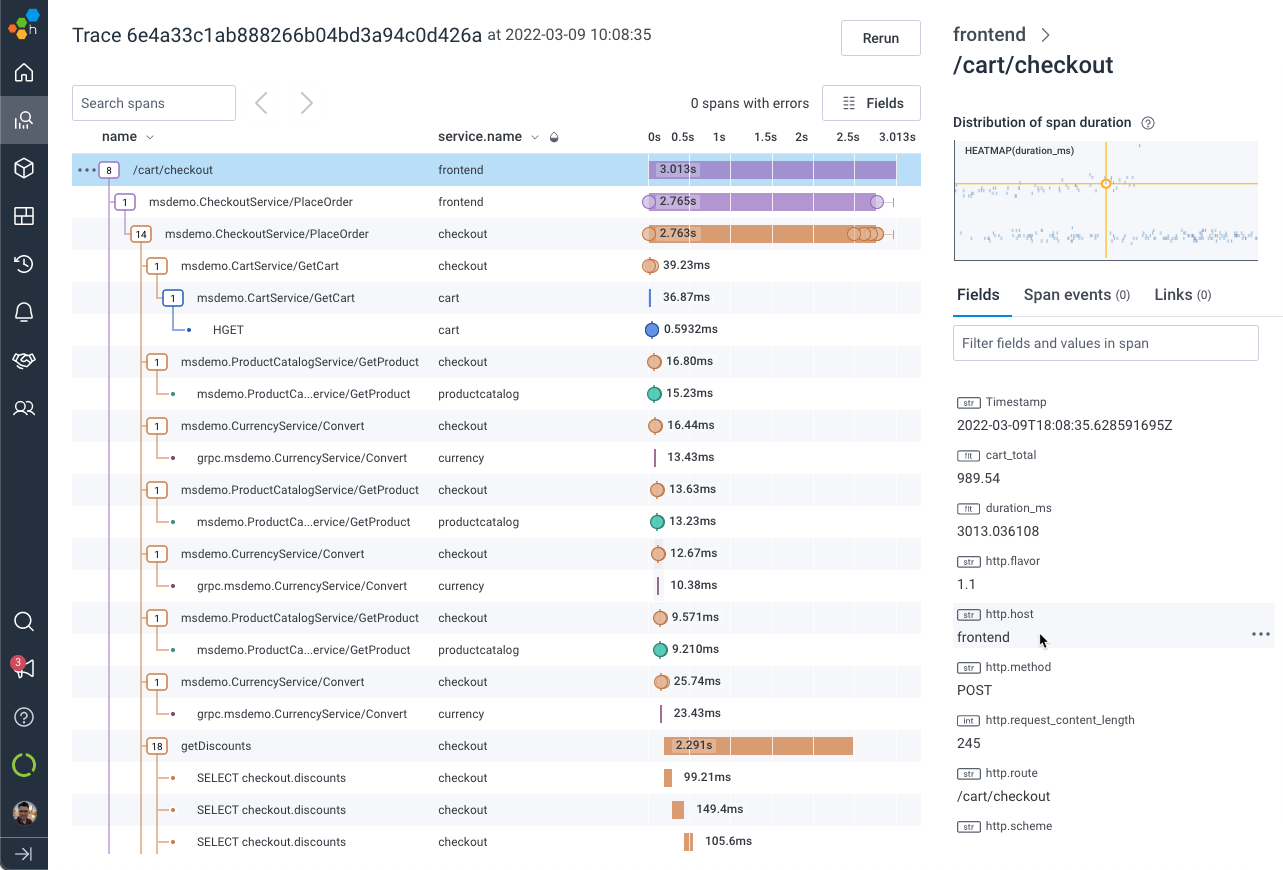
Go deeper with Distributed Tracing without getting lost
Honeycomb’s integrated distributed tracing lets you do a deep dive into end-to-end individual user experiences, and compare your findings across multiple requests, users, and systems to identify system-wide patterns. Zoom into and out of any traces, queries, or visualizations your investigation needs without getting lost by switching tools and losing context.
One data set with multiple views to quickly analyze debug
Metrics
Metrics are the best way to understand the aggregate performance of system-level components that constrain how your application code performs. Honeycomb lets you surface system-level performance when it becomes relevant to your investigation.
learn moreBoards
Configure dashboards to pin and save useful queries and graphs as entry points for investigation. See aspects of system performance at a glance and quickly enter the Honeycomb investigative workflow whenever you see anything interesting.
learn moreStructured Logs
System logs are useful in a variety of situations. Any structured data can be sent to Honeycomb as an individual event and you’ll be able to find it and correlate that data whenever it becomes relevant to your investigation.
learn moreOpen and
enterprise ready
Honeycomb fully supports the vendor-neutral and open-source OpenTelemetry standard for your data instrumentation needs.
User-friendly interface, collaboration features, onboarding packages, and free unlimited user pricing are designed to speed up your organization-wide observability adoption initiatives. Enterprise ready features ensure Honeycomb works for the needs of any organization of any size no matter how complex your code is.
OpenTelemetry
Honeycomb fully supports the vendor-neutral and open-source OpenTelemetry standard for your instrumentation needs. Use Honeycomb OpenTelemetry distros to get started quickly. Send data directly to Honeycomb via OTLP.
Integrations
Honeycomb works with various application languages, frameworks, databases, middleware, SaaS applications, cloud providers, and more. Instrumentation integrations exist for many popular tooling options, or use SDKs to build your own.
Team Collaboration
Honeycomb’s Team History, Query Annotations, and persistent query features help you save useful investigative tools and share them with your team. We don’t charge per user, so everyone can learn from each other’s past investigations and uplevel their knowledge.
Manage Event Volume With Refinery
Refinery is Honeycomb’s solution for intelligent sampling, You don’t need to sample data with Honeycomb, but some organizations may benefit from choosing which debugging data they want to keep or discard. Refinery puts you in control of resource consumption and makes your Honeycomb spend more predictable.
Dig Deeper From Anywhere
Configure dashboards to pin and save useful queries and graphs as entry points for investigation. See aspects of system performance at a glance and quickly enter the Honeycomb investigative workflow whenever you see anything interesting.
Security and Compliance
Honeycomb is SOC 2 Type II certified and regularly undergoes independent penetration testing. We are GDPR compliant and will sign a BAA for enterprise customers with HIPAA compliance requirements. We will gladly explore custom DPAs with enterprise customers as needed.