How Honeycomb Uses Honeycomb, Part 5: Feature Flags
This post continues our dogfooding series from How Honeycomb Uses Honeycomb, Part 4: Check Before You Change. Maybe you’ve heard the saying that correlation does not imply causation: just because two things changed in…

By: Sam Stokes

This post continues our dogfooding series from How Honeycomb Uses Honeycomb, Part 4: Check Before You Change.
Maybe you’ve heard the saying that correlation does not imply causation: just because two things changed in the same way at the same time doesn’t prove one of the changes caused the other one.
And just like pretty much everything worthwhile, there’s a relevant xkcd strip:
It’s important to separate correlation and causation because there’s a natural human tendency to look for causation everywhere. Causation is a powerful part of the way we understand the world. Causation tells stories, and we’re good at remembering – and interpreting – stories.
Looking for causation comes up all the time in operations. Once we discover our app got slower, we want to know why it got slower, so we can fix it. If the site went down right after a deployment, we’ll probably roll back the deployment, betting that it caused the outage.
I’d like to tell a story from Honeycomb engineering where feature flags helped us realize that correlation didn’t imply the obvious causation, and in fact, was actively misleading.

Using Feature Flags in Honeycomb
At Honeycomb, we store customer events in a custom-built storage engine that uses an optimized format on disk to enable fast queries over large amounts of data. An event represents a unit of work done by a customer system; our events consist of fields of various types, including numbers and strings.
Our storage format used to impose a limit of 500 characters on the length of string fields in events. We wanted to remove that limitation, and so we needed to change the storage code. That’s business-critical code involved in storing every single event our customers send us, so we wanted to roll out that change gradually, and watch carefully for any sign of error or performance degradation.
For us, rolling out a change gradually means using feature flags (we’re happy LaunchDarkly customers!), and feeding those feature flag values into Honeycomb. This lets us get immediate feedback on progressive delivery of touchy changes, right alongside our other high-cardinality fields.
When we rolled out the varstring change, we started slowly and only flagged in 20% of datasets, then watched for a while. Everything seemed to be going smoothly, so then we increased the feature-flagged-in population to 90% of datasets—and then something weird happened to the graph:
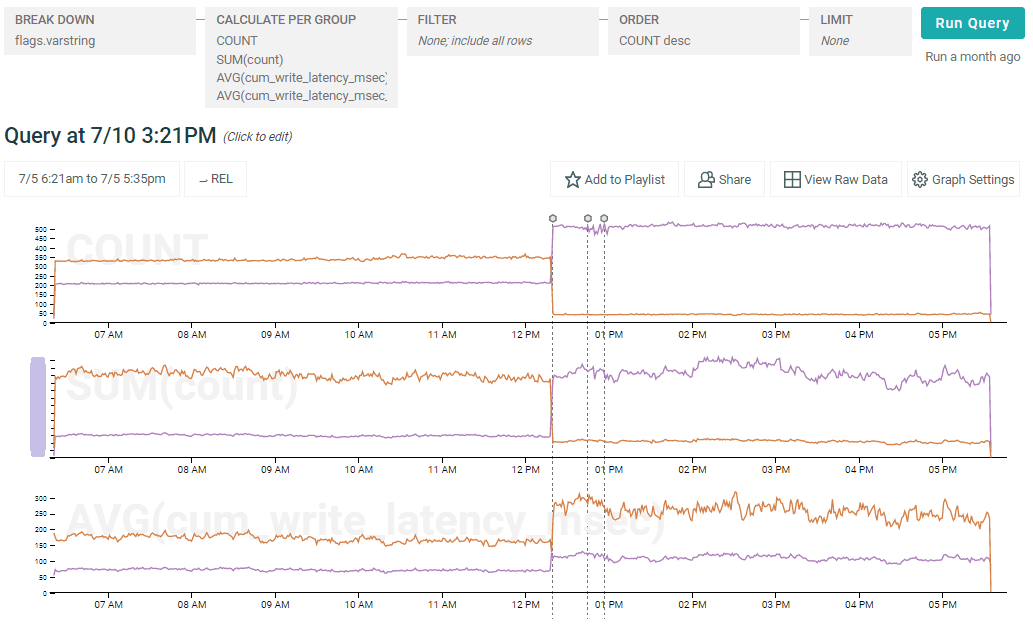
(LEGEND: The purple line shows the datasets with varstring enabled, as indicated by the flags.varstring field; the brown shows datasets without it. Also, the three vertical lines are markers showing when the feature was turned on, and a pair of unrelated deploys–we have automated placement of deployment markers.)
Increasing deployment of varstring makes writes to both varstring and non-varstring datasets appear slower.

Ok, we thought. That seems off. What could be going on? Let’s remove the breakdown by whether varstring is on or not and make sure we’re not on fire or something:
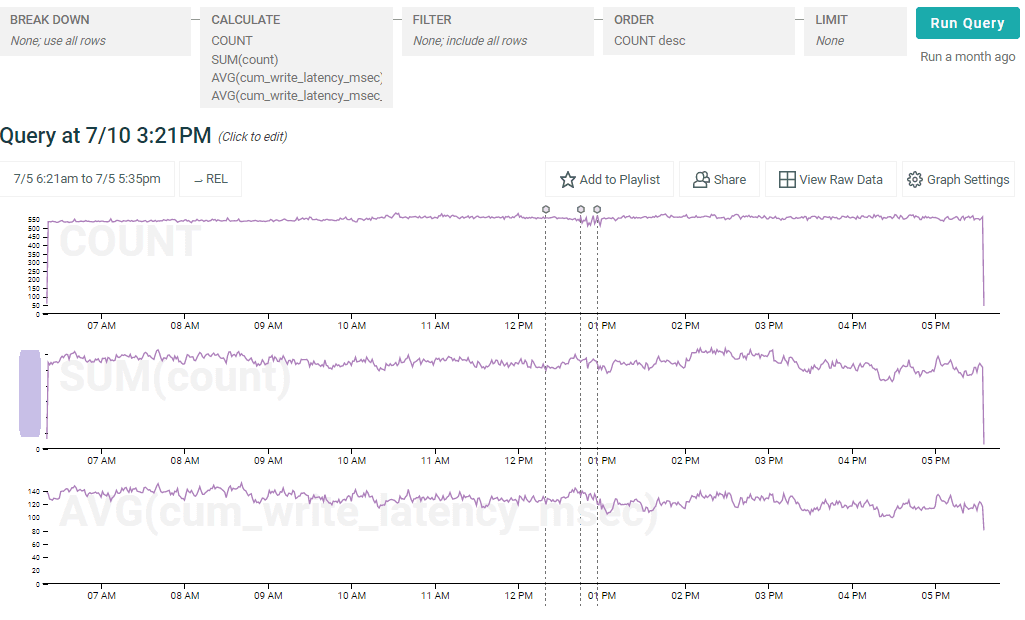
Nope–everything is normal according to our feature flag data. So what is happening? Obviously there is another factor at play here. What about volume of data being sent to the dataset–the size of writes?
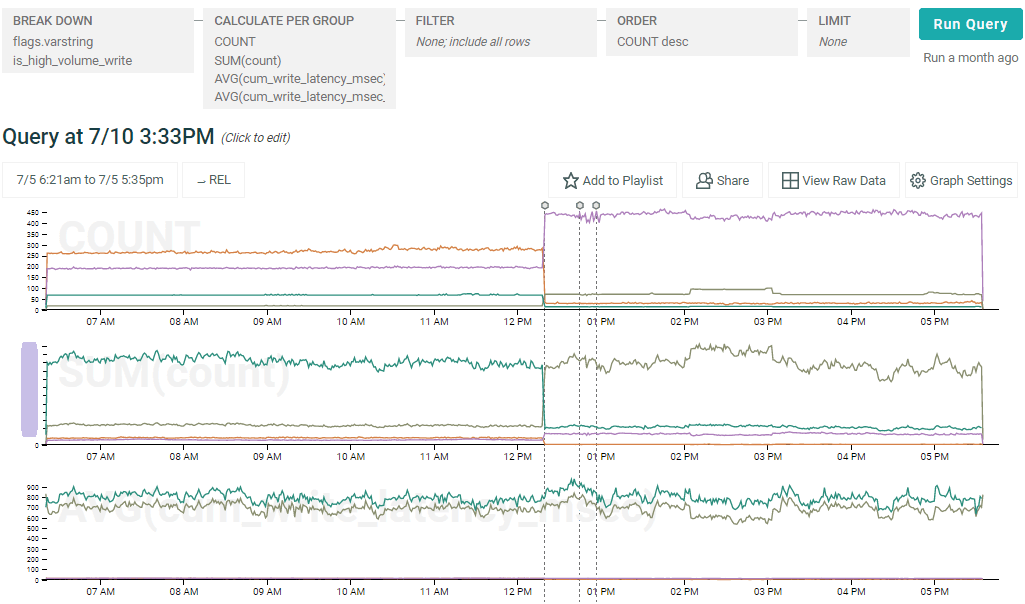
Aha!
The data being written as legacy strings tended to be higher-volume (see the SUM(count) graph) before the ramp up, because most datasets (including the big ones) were on legacy strings. So those writes tended to be slower overall, whereas those using varstring were artificially advantaged (on that metric) by having mostly smaller writes. But after the ramp up to 90% on varstring, most datasets (including the big ones) were using the new feature, which reversed the disadvantage.
When you look at the third graph, total write latency, doesn’t move at all. (Albeit you can’t see the total write latency for small writes on that graph because it’s smushed down to the x axis.)
The breakdown we were using was correlated with something–but it was another, hidden factor.
This is a statistical “phenomenon” called Simpson’s Paradox. The factor we were breaking down by (varstring or not) was actually correlated with another factor (write size) that the original graph didn’t show, and that hidden factor had a more significant effect on the metric in question than the actual breakdown factor. When we ramped from 20% to 90%, we changed the correlation [with the hidden factor].
We could have seen the spike in the graph, panicked, and ramped back down to 20% – without actually fixing anything, because there wasn’t a real problem that needed fixing. Fortunately, we were able to look a bit deeper and discover what was really going on, and remain confident that our observability tooling precisely reflected how progressive delivery was impacting our system’s performance, and in turn, our user experience.
So remember, kids—statistics can really screw with you. When something looks fishy, it probably is. Make sure your tools directly reflect the variables that have changed, and investigate differences critically by using feature flag values to help guide your conclusions.
To learn more about feature flags and how Honeycomb uses them, watch our webinar about progressive delivery, or try Honeycomb yourself today.
PS: Want to learn more? Watch our resource on controlling features in production with observability and feature flags.
Want to know more?
Talk to our team to arrange a custom demo or for help finding the right plan.