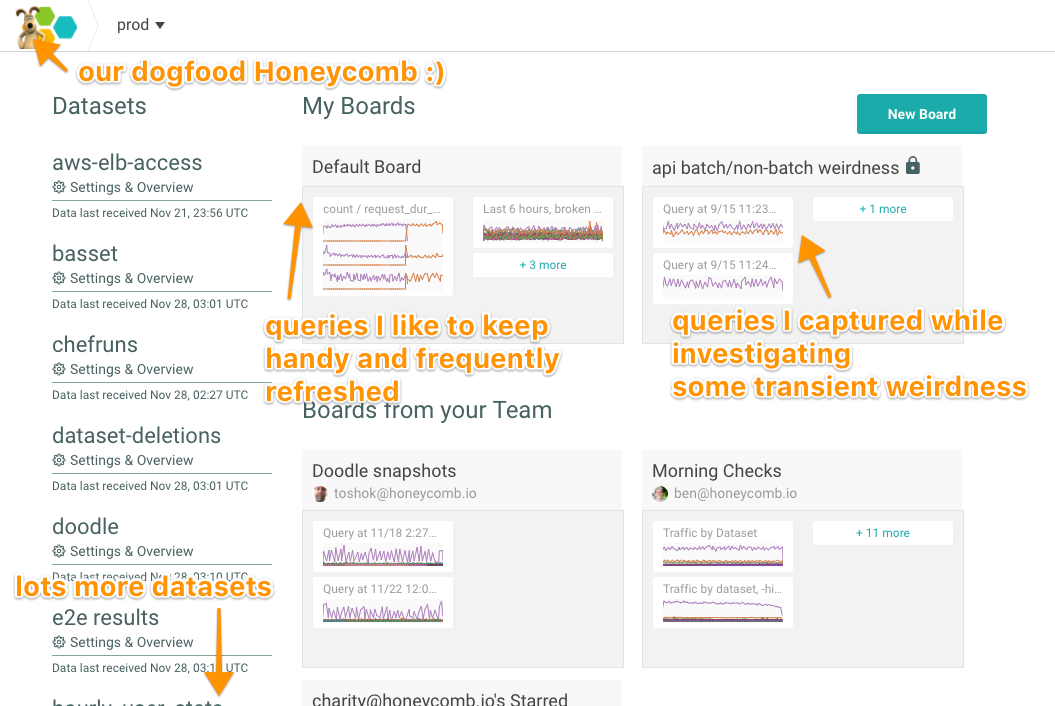
This post continues our dogfooding series from How Honeycomb Uses Honeycomb, Part 7: Measure twice, cut once: How we made our queries 50% faster…with data.
To understand how Honeycomb uses Honeycomb at a high level, check out our dogfooding blog posts first — they do a better job of telling the story of problems we’ve solved with Honeycomb. This blog post peeks under the hood to go into greater detail around the mechanics of what we track, how we track it all, and how we think about the sorts of questions we want to answer.

We’ve built up a culture of investigating and verifying with data, so that we ask questions before investing engineering time into a change, before deploying something with questionable and/or widespread customer impact, and after deploying but before considering a bugfix “complete.”
In the following sections, you’ll find a (partial) sketch of the fields we capture for each of our major services / use cases, the sorts of questions that we try to answer about our systems, and a sampling of the triggers we’ve defined. Enjoy the ride 🙂
How do we even start?
To varying degrees, we typically start with a set of attributes that may be very broadly useful (common partition keys for us are: customer team ID, dataset ID, build ID, Kafka partition), then iteratively enrich the dataset to include things like extra timers, flags, or new indicators of interesting-ness like: “Does this hit that some edge case we just started optimizing for?”
We often add timers and just leave them there (number columns are super cheap to store!) in case they’re useful in the future, while some fields (e.g. “We’re rolling out support for longer strings soon; which customers are sending payloads that would’ve been affected by the old limit?”) do get pruned after they’re no longer relevant, or are replaced by more useful evergreen data.
And since we released derived columns, it’s been particularly nice to send just a single number or value (e.g. user agent) and break down by some interpretation of that value (e.g. SDK type, logstash vs. fluentd, honeytail version, etc).
Events captured from our API Server
Our API server captures the widest events of the bunch, and data captured at this layer serves as our birds’-eye view into what customers are sending into Honeycomb. In total, we have hundreds of columns on this dataset — but not all fields are populated on all events. (And that’s okay! Honeycomb’s query engine handles it just fine, and omitted fields don’t take up any additional storage.)
- Schema, roughly:
- Table stakes for common traffic segments / host info:
- team ID / dataset ID
- build ID
- hostname
- availability zone
- EC2 instance type
- process uptime
- Basic HTTP/request stats
- status code
- error / error detail
- API endpoint
- Kafka partition written to, as well as all configured partitions for this dataset
- was it gzipped?
- remote IP
- request ID
- user agent
- which headers are populated
- Traffic characteristics (e.g. what API features are in use)
- batch size (if applicable)
- content length
- size of payload
- number of unique fields in payload
event_time_delta_sec(if the event carries a timestamp, how long ago was it, relative to the time of ingest?)- whether it contained nested json (and depth, if applicable)
- And a whoooole bunch of timers to let us zoom in on the latency from:
- authentication
- getting the schema
- getting a list of partitions from Kafka
- decoding json
- writing to kafka
- everything (aka, the total roundtrip time)
- Table stakes for common traffic segments / host info:
- Questions we typically answer with this sort of dataset:
- Which dataset sent us the most traffic recently? Are they being rate limited?
- How’s our Kafka load look? Are the brokers each getting within an order of magnitude of traffic as their peers? Are there any datasets contributing overly much to a specific Kafka partition?
- Customer X was complaining about increased latency for their app, but I don’t know anything about what their traffic is like. Do they batch? Which SDK(s) are they using?
- Who’s sending us traffic that’s erroring out, and why is it erroring? (eg typoed write key, malformed JSON, etc.)
- What are the most popular integrations and SDKs, by traffic and by teams using them?
- I have a theory about the performance impact of gzipped vs non-gzipped payloads on a specific part of our code, but want to verify it before I act on my hypothesis.
- Latency distributions are particularly nice to inspect with heatmaps
- Oops, I tried to kick off a manual deploy and got disconnected partway through. Are all nodes serving traffic from the new build?
- Is incoming traffic well balanced across partitions or do we need to adjust load distribution?
- Example triggers we have/could have set on this data:
- Availability: Complain if the # of API servers serving traffic dips below a certain threshold (e.g.
COUNT_DISTINCT(server_hostname) < 4) - Consistency: Complain if the API servers are serving traffic from multiple (>2) builds (e.g.
COUNT_DISTINCT(build_id) > 2) - Speed: Complain if any individual non-batch request exceeds a certain threshold (e.g.
P95(roundtrip_ms) > 3 WHERE batch != true) - Consistency: Complain if a high-value customer drops below a certain threshold of traffic (e.g.
COUNT WHERE team_id IN (1, 2, 3) GROUP BY team_id) - Anticipatory: Complain if someone sends us a payload with too many unique columns (and keep a close eye on them)
- Anticipatory: Complain if someone tries to use the old, undocumented endpoint we just deprecated
- Availability: Complain if the # of API servers serving traffic dips below a certain threshold (e.g.
To see some code snippets illustrating how we use our Go SDK to instrument our API server, check out our post about Instrumenting a Production Service.
Events captured from our web app
Events from our web app were fairly barebones to start, but have grown richer over time. We’ve found that they serve as a surprisingly acceptable fallback source for business intelligence/product analytics for our engineers, since HTTP requests can capture a fairly comprehensive picture of a user’s actions within the app.
- Schema, roughly:
- We started with basic metadata we pulled straight from HTTP requests:
- app route pattern (e.g. normalized path, or
/books/:book_id)- and variables used by the app route (e.g.
book_id: 41)
- and variables used by the app route (e.g.
- URI
- method
- status code
- response time
- request ID
- was XHR?
- app route pattern (e.g. normalized path, or
- Added our “table stakes” metadata:
- team ID / dataset ID (if applicable)
- build ID
- hostname
- And appended some Honeycomb-specific bits to the metadata:
- user ID
- user creation date
- We started with basic metadata we pulled straight from HTTP requests:
- Questions we typically answer with this sort of dataset:
- We forgot to instrument our Playlists functionality entirely, but know the endpoints involved in the webapp. Who’s been using it lately?
- From the user’s perspective, what does the distribution of our query latencies look like?
- Which team/dataset is experiencing the highest query latencies? How are their queries shaped?
- What other actions has this user taken in the webapp? How did they get in this state?
- We haven’t optimized anything in our webapp – are there any requests that are starting to take too long?
- How many unique users have been active over the last month? Which teams?
- Example triggers we have/could have set on this data:
- Anticipatory: Let us know if folks have run through our Quick Start tutorial
Web client activity: we capture web client activity as user actions in a user-events dataset. The events get sent both to Intercom to annotate our users there, as well as to a dogfood dataset for easier aggregation/perusal on our end. It’s useful for doing more business-intelligence/product-y analytics on our webapp activity.
We also recently started capturing page_load and page_unload events which contain a number of timers from window.performance.timing, and details (and code!) for those events can be found in our Instrumenting browser page loads blog post.
Events captured from our datastore
Our datastore sends events to a few different datasets, depending on the codepath. We’re very interested in understanding Honeycomb query performance characteristics (aka, the read path), so we capture lots of timers and information about the shape of the query.
On the other hand, we’re interested in the write path as a reflection of general ingest health, but it’s a high-throughput codepath that has been really highly optimized, so this is one of the few where cases we’re both a) sensitive to the performance and b) less interested in granular observability. (Remember, we do most of our payload-level inspection at the API layer). As a result, we aggregate and flush events to Honeycomb in batches per dataset.
For our datastore’s read path:
- Schema, roughly (for reads):
- The usual suspects: dataset ID, build ID, hostname, Kafka partition, process uptime, etc
- attributes of the query (how many calculations, breakdowns, filters were specified? how large was the time range?)
- is_samples
- “samples” queries are quick, optimized “show me the last 10 events in this dataset” queries that aren’t representative of normal user-driven queries
- number of rows examined
- number of segments (chunks on disk of up to 1M rows) filtered out by timestamp
- number of rows filtered out by timestamp
- number of results returned
- number of subqueries to issue to children
- number of failed children, if any
- msec to execute query locally
- msec to merge results from any subqueries
- msec to serialize protobufs
- msec to completely return results (to the client or its parent
- Schema, roughly (for writes):
- The usual suspects: dataset ID, build ID, hostname, Kafka partition, process uptime, etc
- segment ID being written to (implementation detail of the storage layer)
- number of events written to disk
- cumulative msec spent writing events out to disk
- msec since the last event’s associated ServerTime
- number of (boolean, int, string, float) values written
- a useful derived column: dividing the cumulative latency of a batch by the number of writes
- Questions we typically answer with this pair of datasets:
- What’s our P50 local execution time for a query? P95? P99? P999? What does the distribution look like?
- What are characteristics of queries that have high P99s? What does the distribution of local execution times look like for queries that pull back raw rows?
- I know that queries returning over 100k groups can be slow. How slow have those worst-case queries been lately, and which customers have they been impacting?
- Where is this slow query spending most of its time? (Local execution, merging, protobuf deserialization, etc?)
- Which nodes and partitions are being written to the most?
- If we turn on some special storage feature for a specific node or dataset via feature flags, how does that affect the per-event write latency?
- Example triggers we have/could have set on this data:
- Availability: Complain if we saw queries with any failed child nodes so that we can dig into them.
- Performance: Complain if any single node spent more than X time merging results from its children.
System metrics masquerading as events
We dogfood everything. So this means that, while the Honeycomb experience hasn’t yet been optimized for gauges and aggregated metrics like system stats, we dump ‘em into Honeycomb anyway.
It’s done by a little bash script that pings a Ganglia monitoring daemon on the node, appends some useful node-wide attributes, and shoves it into a JSON blob for consumption by Honeycomb.
The bash script is, literally, just this, called via cron every 60 seconds:
#!/bin/bash

vars=($(nc localhost 8649 | grep METRIC NAME= |
  grep -o 'NAME="[^ ]*" VAL="[^ ]*"' | sed -e s/^NAME/--name/ -e s/VAL/--value/))
/srv/infra/bin/honeyvent -k $DOGFOOD_WRITEKEY -d system_stats --api_host $DOGFOOD_HOST
  -n hostname -v $(hostname)
  -n host_group -v $(hostname | cut -f 1 -d-)
  -n environment `-v $(cat /srv/hny/environment) ${vars[*]}`
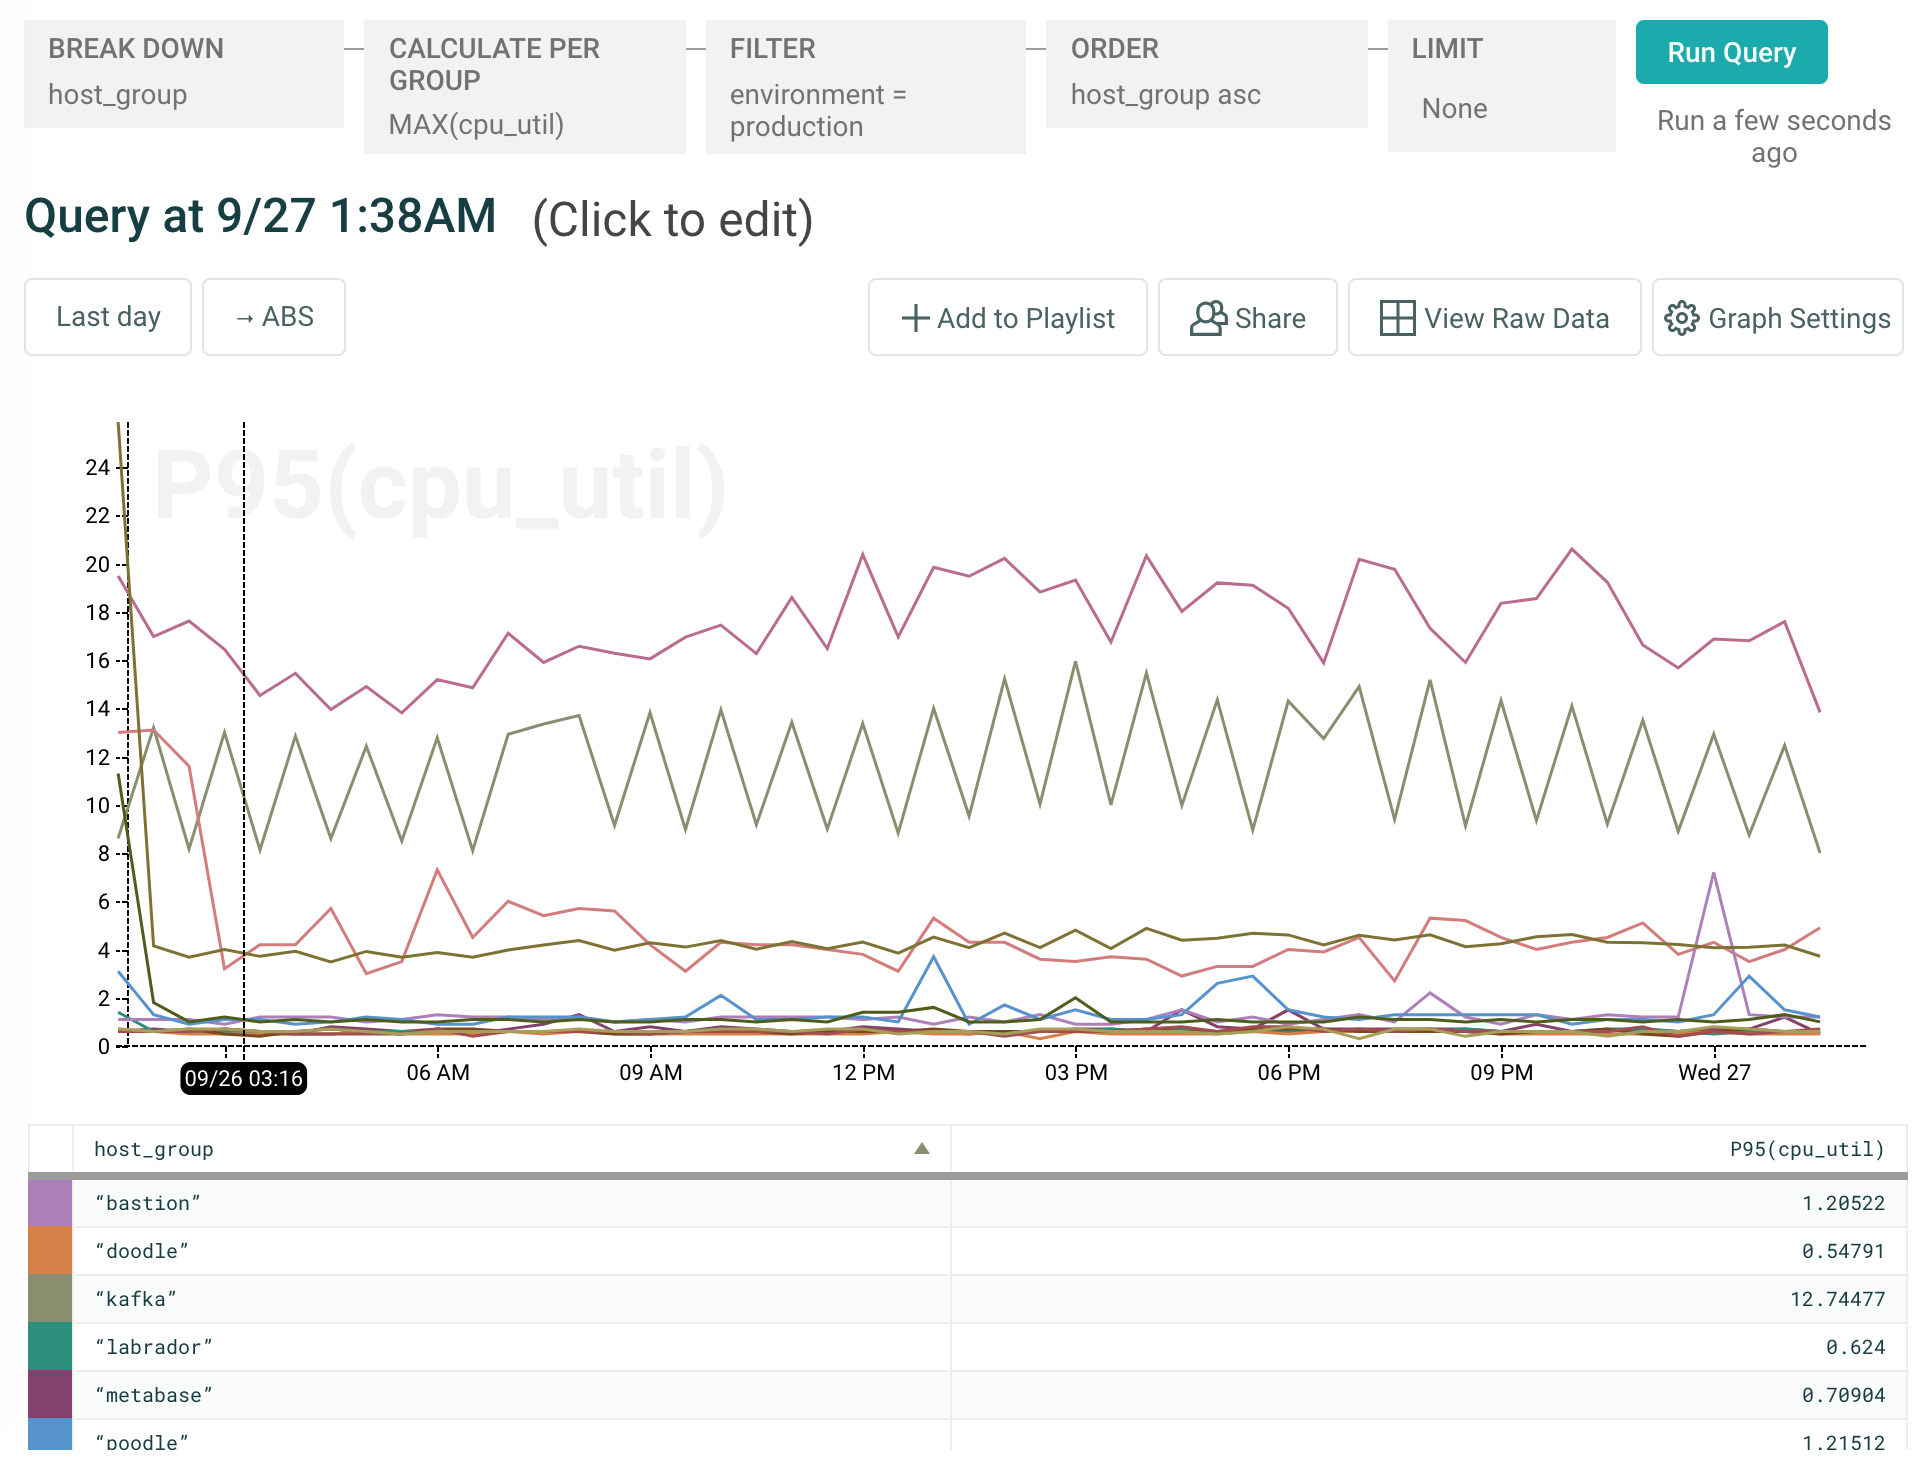
It’s gross and very brute-force, but… it works. And it ultimately gets us the ability to construct any type of system stats graph we’re interested in. We can filter by a particular environment, hostname, or host group (frankly, anything for which we might consider using an AWS tag) to get a reasonable picture of how Honeycomb’s instances are doing:

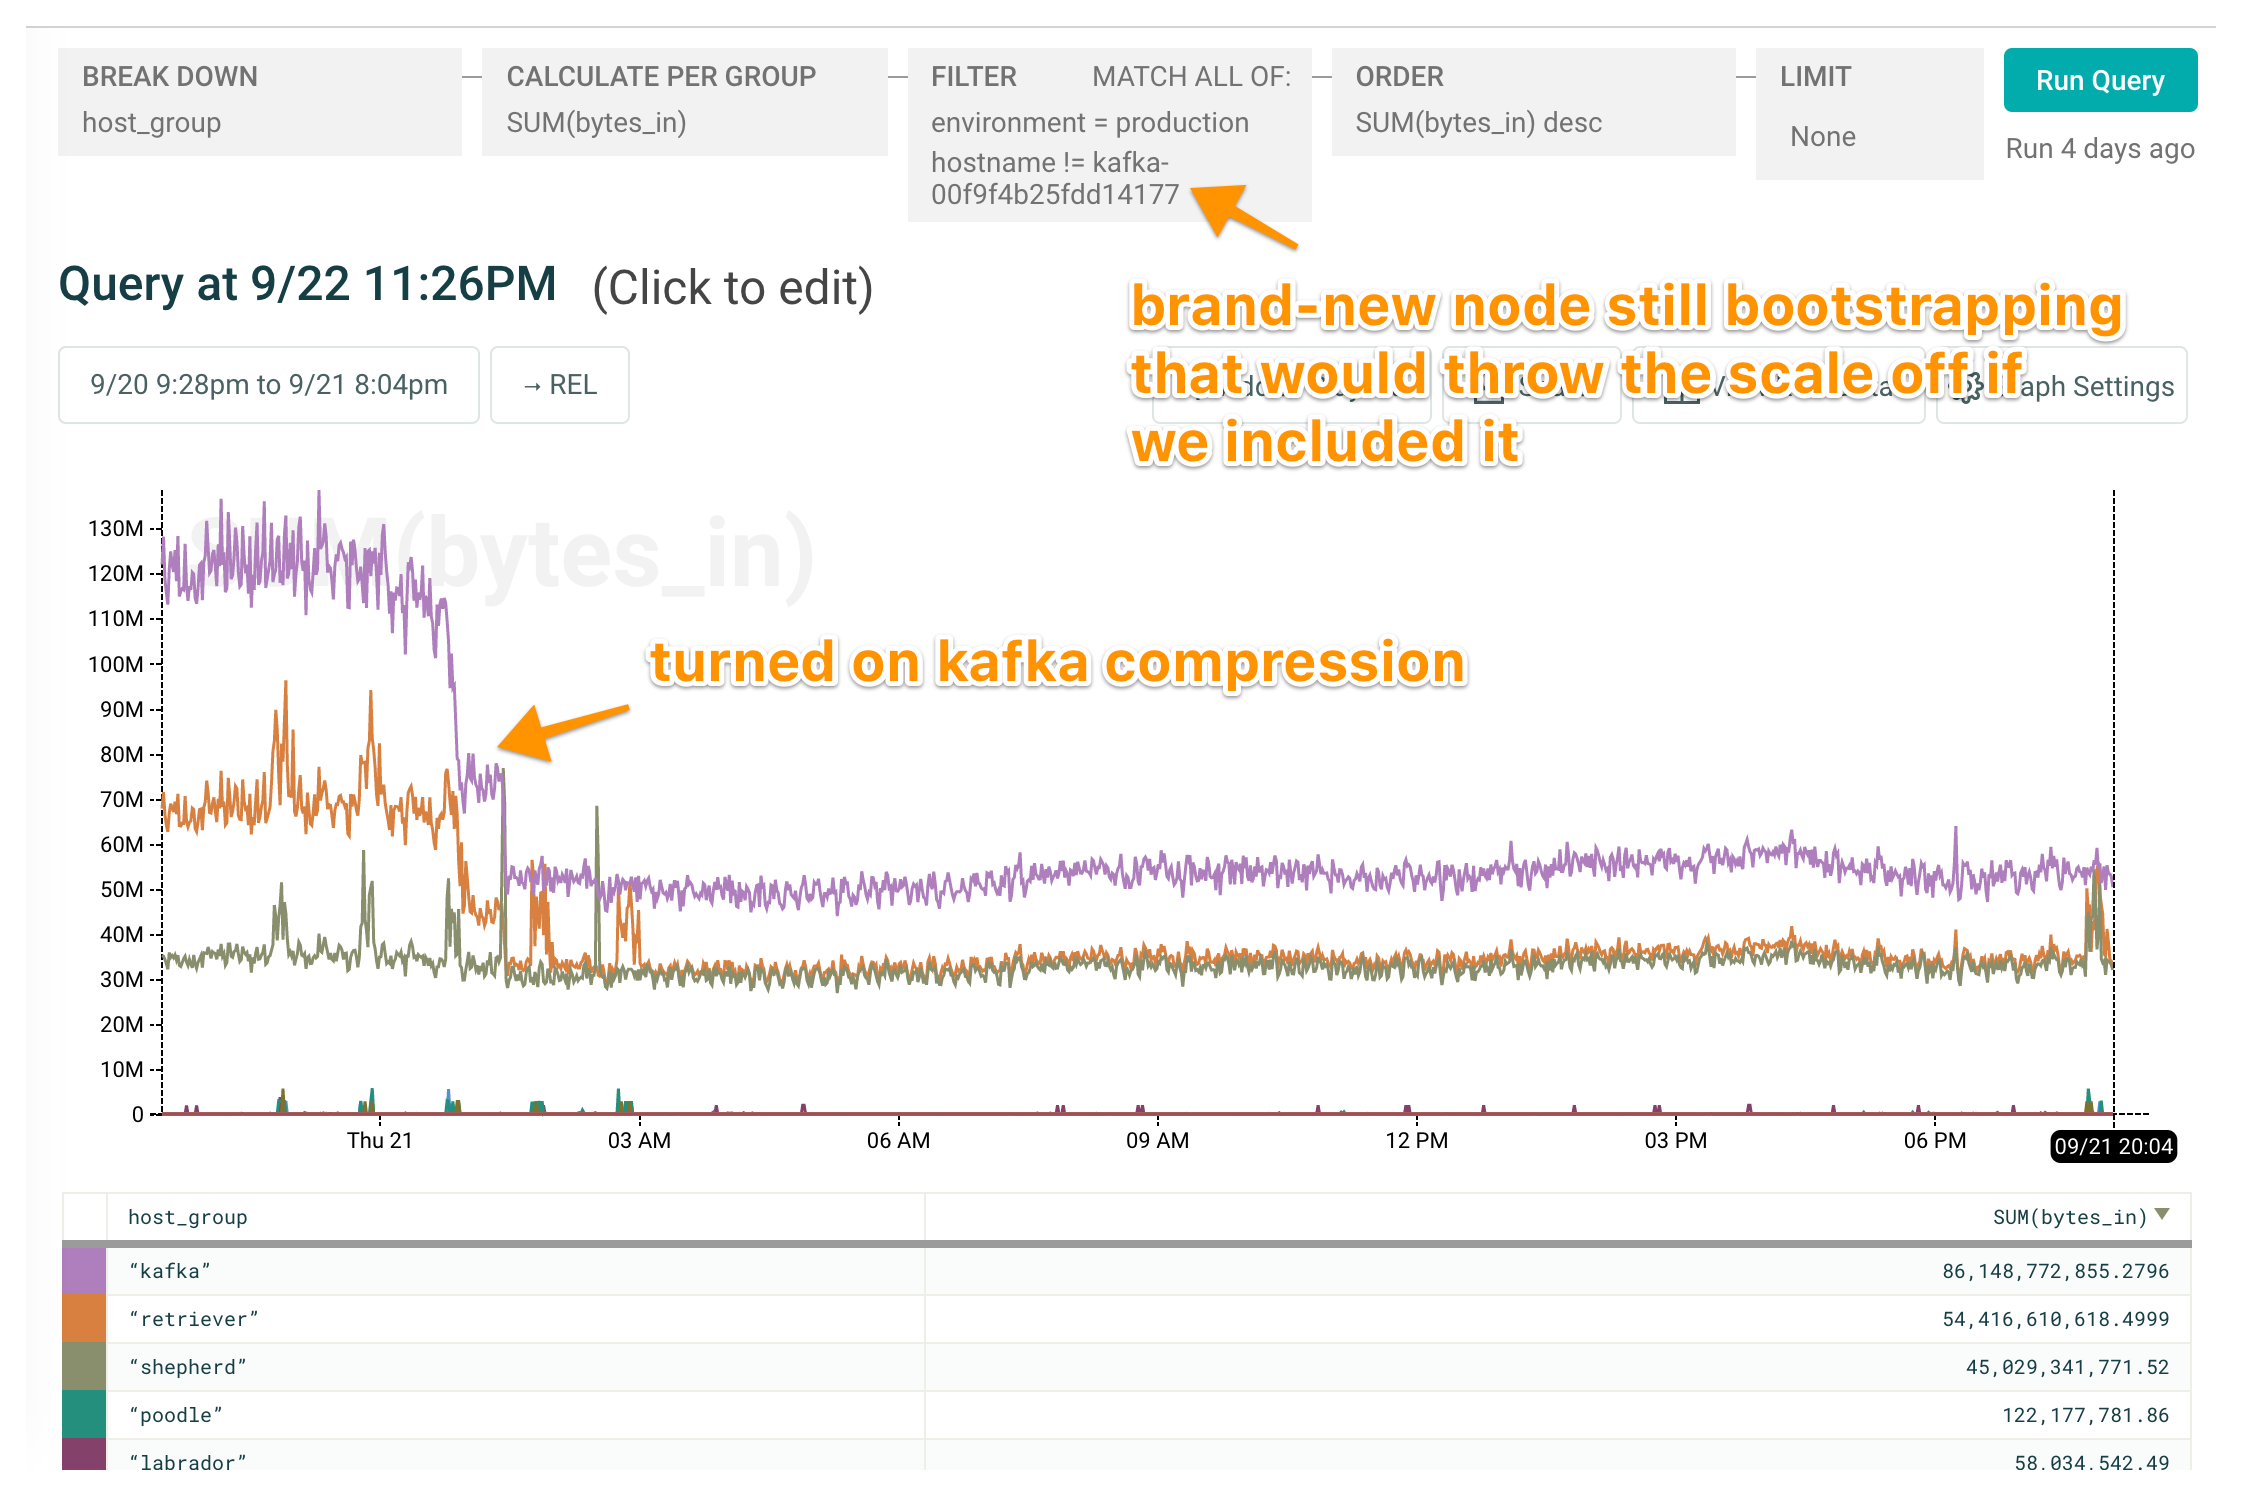
And another example: keeping an eye on our Kafka nodes as we turned on compression:

Looks like a system stats graph, smells like a system stats graph, requires a bit more thought (note that SUM(bytes_in) when breaking down by group, which contains multiple hosts) — but worth the convenience of having everything in a single tool, in nicely shareable and curate-able bites.
There’s iterating to do on the get-more-stats side, and iterating to do on the product side to surface these “dumped a snapshot every 60 seconds” datasets a little differently, but… it’s really been working for us surprisingly well.
For what it’s worth, our conventional wisdom is that anything you’re capturing as a gauge (e.g. system stats like these!) make a lot of sense to store in a time series storage system, because they can only be thought of in an events system as a snapshot values. Anything you’re capturing as a counter (e.g. discrete events that you’re collapsing into a single number over time), though, we typically recommend trying to unwind into discrete events, for vastly improved context while debugging.
Blending it all together
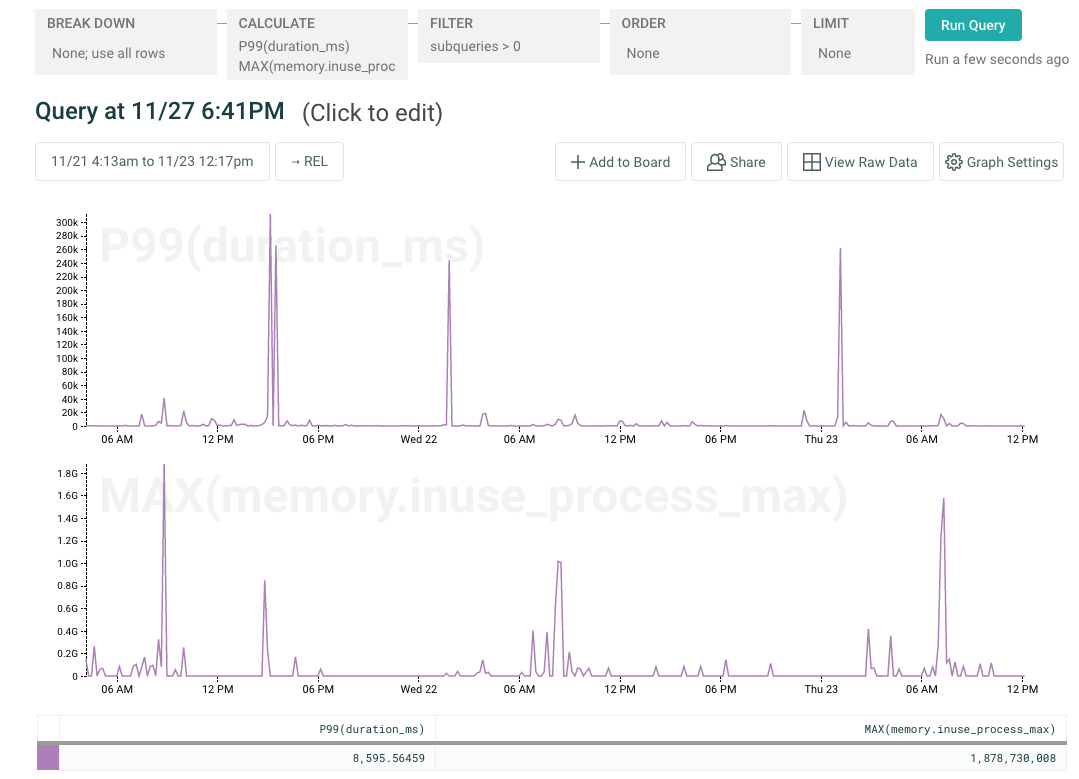
There are a few gauges we capture alongside Honeycomb events, like memory.inuse_process_max and num_goroutines, on each Honeycomb event in our go services. They let us graph service-specific concepts like “hey, how complex was that query we just executed?” alongside system metrics (active memory used) that we know are likely to be useful to have inline when debugging.

In fact, this “blended” approach is the one we currently recommend for folks using MongoDB — by mixing events containing per-query information (via individual Mongo query logs) with other events containing snapshotted statistics, we can seamlessly show cluster-wide metrics like queue length changing alongside per-query metrics like query duration.
Completing our observability picture
In decreasing order of reliance, we also use Sentry, Zipkin, and SignalFx. Sentry’s resolve/ignore workflow built around deduped exceptions is awesome and makes it easy to pop exceptional cases up on our radar, though we’ve found that the most alarming problems don’t tend to manifest first as exceptions. Zipkin is sporadically very useful for deep-diving into the individual execution paths, though it’s primarily useful when we start by using Honeycomb to figure out which trace is likely to be worthwhile.
And SignalFx was introduced as a way to sanity check ourselves when we first started using Honeycomb, though the only data left there are our Kafka metrics (because, sadly, JMX metrics are designed for consumption by time series systems). Relatedly, see System Metrics Masquerading As Events.
For more about how we put all of this instrumentation to use, check out our first or second outage postmortems, or any of our dogfooding blog posts. Or, take a peek at how Nylas and Intercom use Honeycomb to understand their systems in production, too!
This is another installation in a series of dogfooding posts showing how and why we think Honeycomb is the future of systems
observability. Stay tuned for more!
And — of course — if you’re intrigued, sign up for a free trial today and take us for a whirl yourself!


