Metrics—the gateway to your systems
Get all the graphs you need, at no extra cost. Then explore the data behind the graphs to fix issues with all the necessary context and information.
Watch demo Talk to us
Why you’ll love Honeycomb
See the whole picture
Honeycomb derives your application metrics from detailed logs and trace spans, on demand and super fast. See high-level graphs or dive into granular details.
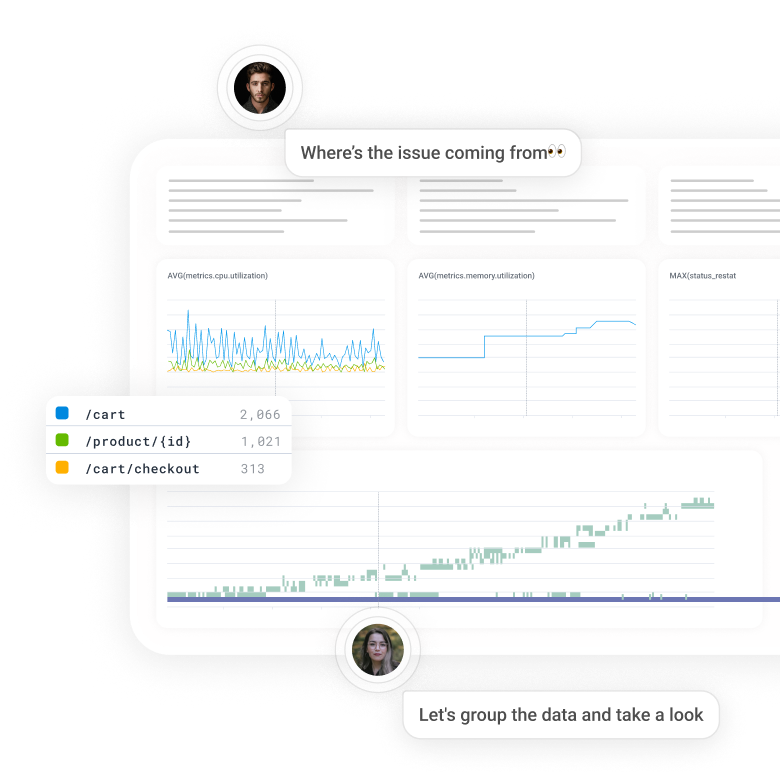
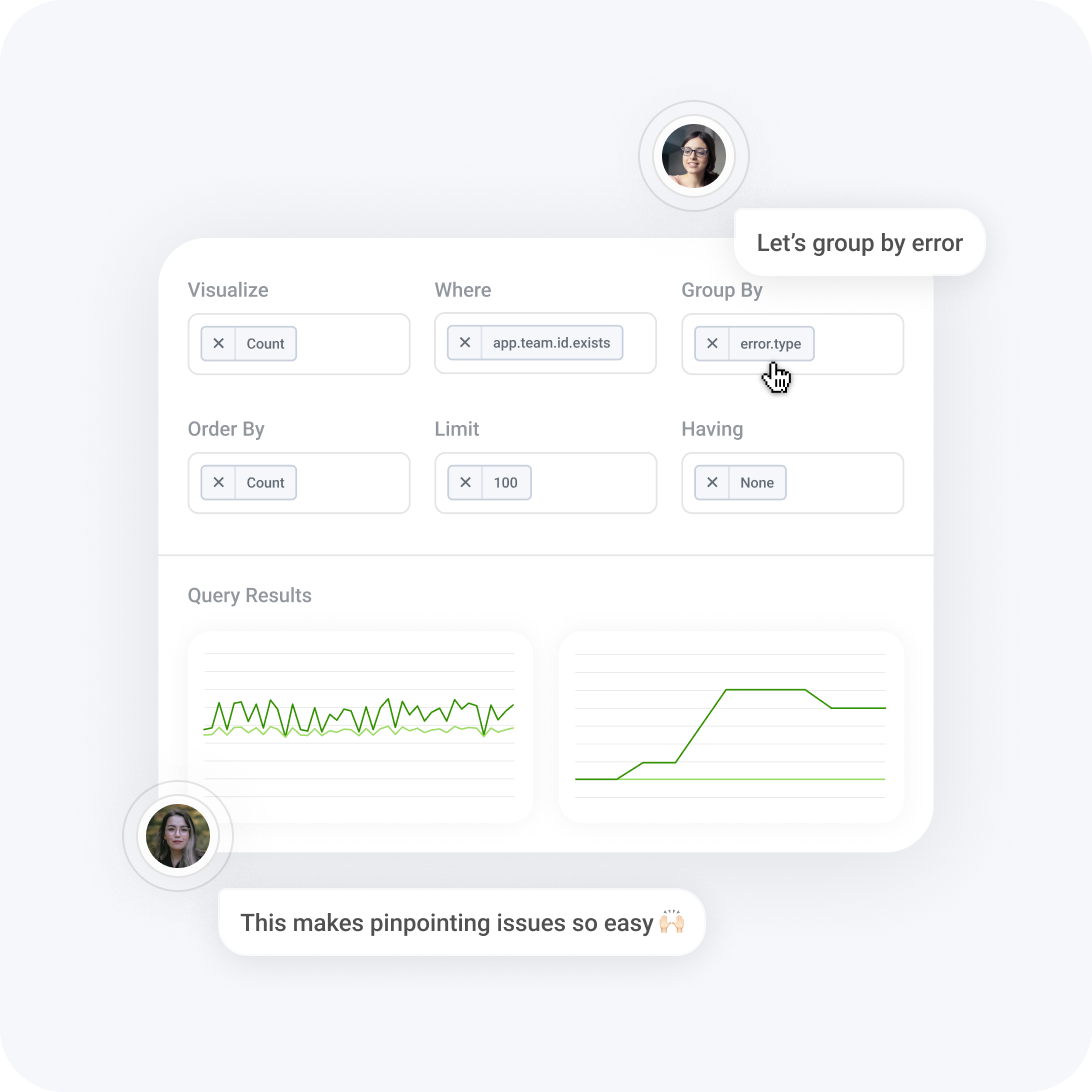
Find issues faster
Don’t just detect problems—solve them! Go from an error count to the full logs that report them. Then detect anomalies to identify what’s different about the requests that failed.
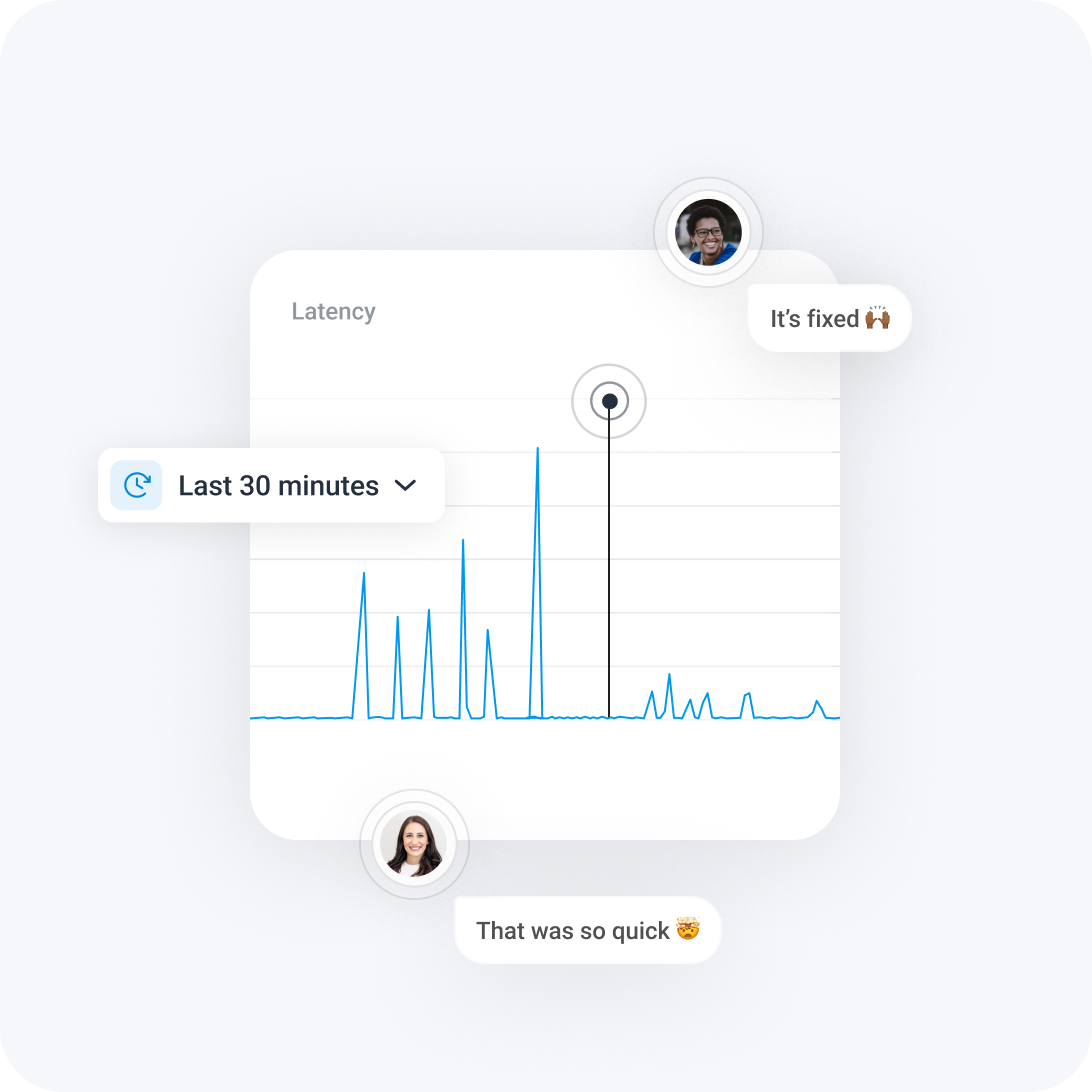
Monitor and debug together
A problem shared is a problem solved. Every query result you view is shareable in Slack, and available forever for your incident histories.
Why use Honeycomb for Metrics?
Why use Honeycomb for Metrics?
Unified observability
Application metrics, logs, and traces are really just different views of the same data—we help you move seamlessly between them. Got infra metrics? Honeycomb can take those, too, and correlate them with signals from your application. See the whole picture at once.
Free custom metrics
Every field that you log is automatically available as a custom metric. Which specific store is seeing the worst latency right now? Which customers cost you the most in database compute? Don’t compromise on what to tag or index. Get more insights for more clarity.

Modern approach designed for high cardinality
The cloud-native world is one full of high-cardinality data. Want graphs broken down by service, pod, instance, app, git commit, browser version, UUID—or some combination of the above? Get super fast answers, and move on to the next problem.
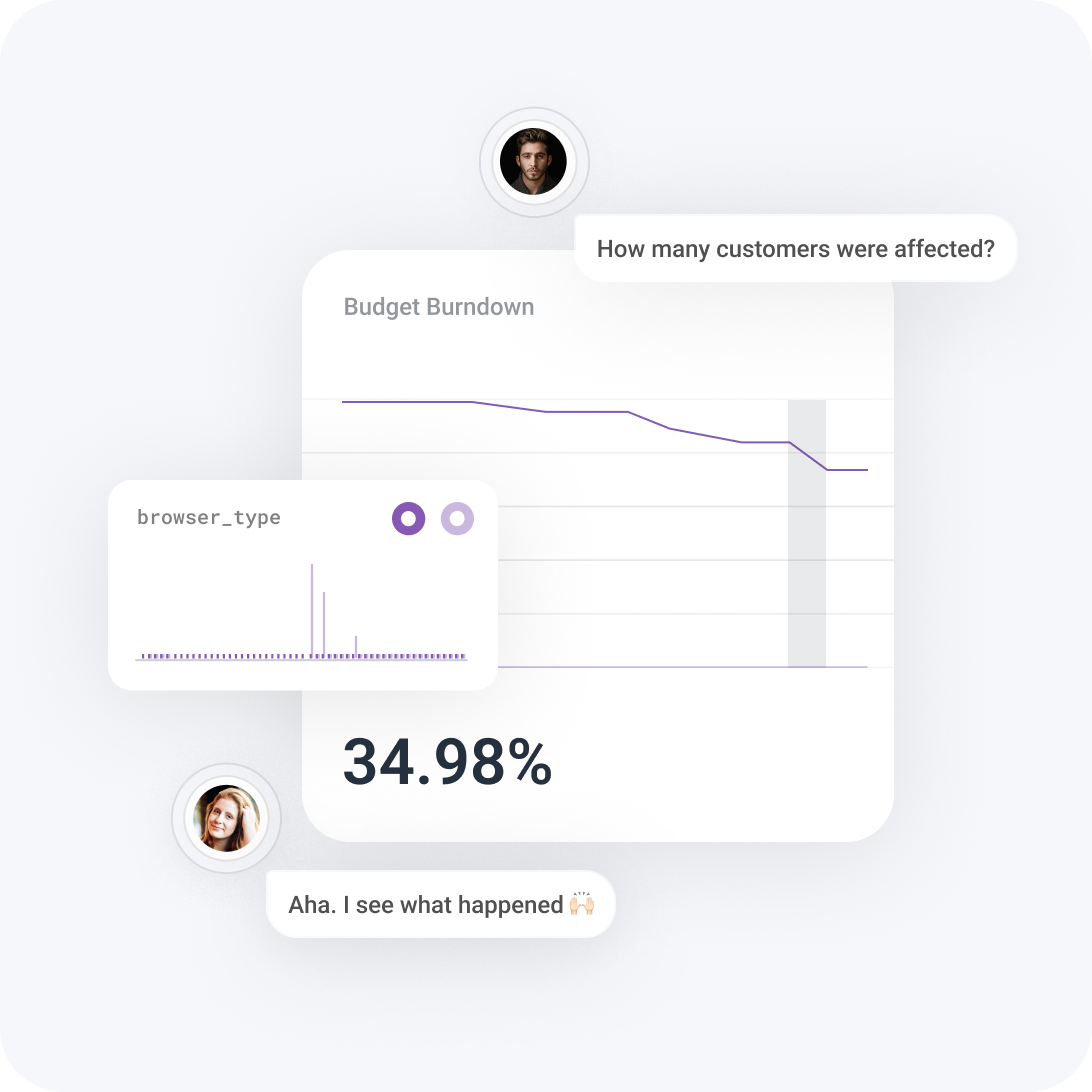
Best-in-class Service Level Objectives (SLOs)
Set error budgets aligned with business goals so that you know when to prioritize problem solving, or focus on building. When an alert fires, action immediately—Honeycomb’s SLOs are calculated directly from the telemetry engineers use to debug.

With Honeycomb Metrics, we’re able to very easily switch between searching, visualizing, and viewing raw metrics data all in one place. The Honeycomb query interface is awesome for metrics, just as it is for events. With just a few clicks, getting insights and clarity from our metrics has never been easier.
Sarah Sherbondy
Principal Engineer, Platform Observability, Heroku
Related features
Discover our full suite of features, giving you everything you need to easily solve problems.
Service Level Objectives (SLOs)
Catch critical business-impacting issues sooner and reduce alert burnout with actionable SLOs.
Service Map
See the dependencies of your software components at a glance. Filter down by any field, and dig into relevant traces.
Log Analytics
Comb through billions of log lines in seconds, spot anomalies quickly, and resolve issues with precision.
Dive deeper
Learn more about the power and possibilities of Honeycomb.

Ask Miss O11y: To Metric or to Trace?
Dear Miss O11y, I remember reading quite interesting opinions from you about usage of metrics and traces in an application. Did you elaborate on those points in a blog post somewhere, so I can read your arguments to forge some advice for myself? I must admit that I was quite puzzled by your stance regarding the (un)usefulness of metrics compared to traces in apps in some contexts (debugging).

How to Get Infinite Custom Metrics For Free
Oh no, I’m getting out-of-memory errors! How much memory is my app using? To find out, we go look for a metric that tells us how much memory is available, and we graph it around the time that our errors occurred.


Want to know more?
Talk to our team to arrange a custom demo or for help finding the right plan.