This post continues our long-running dogfooding series from How Honeycomb Uses Honeycomb Part 8: A Bee’s Life. To understand how Honeycomb uses Honeycomb at a high level, check out our dogfooding blog posts first — they do a great job of telling the story of problems we’ve solved with Honeycomb.
Last week we announced the general availability of tracing in Honeycomb. We’ve been dogfooding this feature extensively as part of an ongoing effort to keep Honeycomb fast and reliable. In this post, we’ll discuss how we use tracing internally, some of the ways it’s helped us improve our service, and some of the lessons learned along the way.
Background
Honeycomb stores data in a bespoke distributed columnar store. This data store has two major components:
- The write path receives event data and commits it to disk.
- The read path is responsible for serving user queries.
The write path is high-volume, handling many tens of thousands of events per second, but also relatively simple. Problems with the write path are often readily apparent in time-series graphs, like the one below that shows elevated write latency for a few hot partitions:

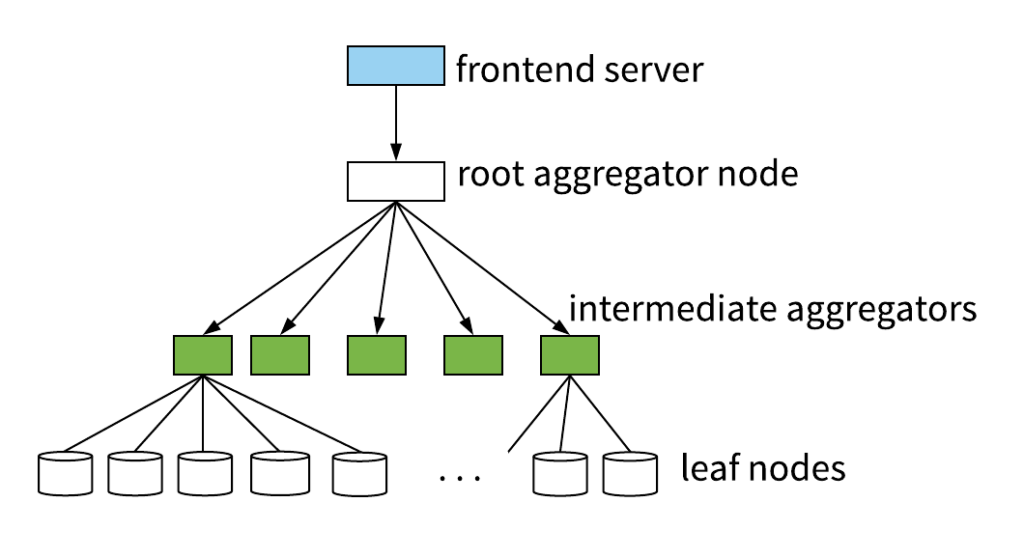
In contrast, the read path is relatively low-volume. But it’s also considerably more complex. A single query can scan billions of rows across many hosts, using multiple levels of aggregation.
 The read path needs to be fast and robust across a wide spectrum of query types, dataset sizes, event shapes, time windows, and so on.
As a result, understanding how the read path works in production is challenging. Time-series aggregates can’t express control flow in a distributed system. And understanding query execution by scrutinizing raw logs, while possible, is tedious, painful, and error-prone.
The Goal
Tracing at Honeycomb initially began as an experiment to make this problem more approachable. Even though the query path isn’t simple, it shouldn’t be “experts-only” terrain. Tracing is an understanding tool as much as a debugging tool; a way for code authors to communicate the structure of their code.
For example, in the waterfall diagrams below, you don’t have to be an expert to tell that fetching results was the bottleneck in the first trace, and persisting results was the bottleneck in the second. You also don’t have to go pore over code to understand the high-level control flow.

 Previously, understanding the query path relied extensively on folklore and hand-written comments like the one below.
// Rough guide to query codepath in this package:
// Fetch [front-end API]
//  |-(aggregate)-partialResultsFetcher.fetchOverall
//                 |-localPartialFetcher.getOverall
//                    |-ReadRows
//                 |-remotePartialFetcher.getOverall
//                    |-FetchPartial [remote]
//                       |-fetchPartial [remote]
//                          |- [recursive, as above]
// ...
Traces augment this shared understanding by showing what’s actually going on in production.
Traces also help quickly assess the structural effect of code changes. The trace below shows a canary host (in blue) running a patch that parallelizes a particular code path — in this case, it’s clear that this patch makes things go faster.

Lessons
Instrumentation is a living thing
The initial instrumentation of the read path for tracing was just a few lines of code. It used the OpenTracing API directly, and relied on gRPC middleware to automatically create spans for service-to-service RPCs. This was a simple and effective way to bootstrap tracing.
However, we quickly found that it was useful to wrap the OpenTracing API: for example, to ensure that spans are consistently tagged with a user ID, query ID, and so on.
// Wraps opentracing.StartSpanFromContext, but adds hostname plus any baggage
// items as span tags. Use this function to create a new span.
func StartSpanFromContext(ctx context.Context, name string) (opentracing.Span, context.Context) {
    span, ctx := opentracing.StartSpanFromContext(ctx, name)

    // Set any baggage items as tags as well.
    // This ensures that spans are tagged with user ID, query ID, etc.
    span.Context().ForeachBaggageItem(func(k, v string) bool {
        span.SetTag(k, v)
        return true
    })

    span.SetTag("hostname", hostname)
    return span, ctx
}
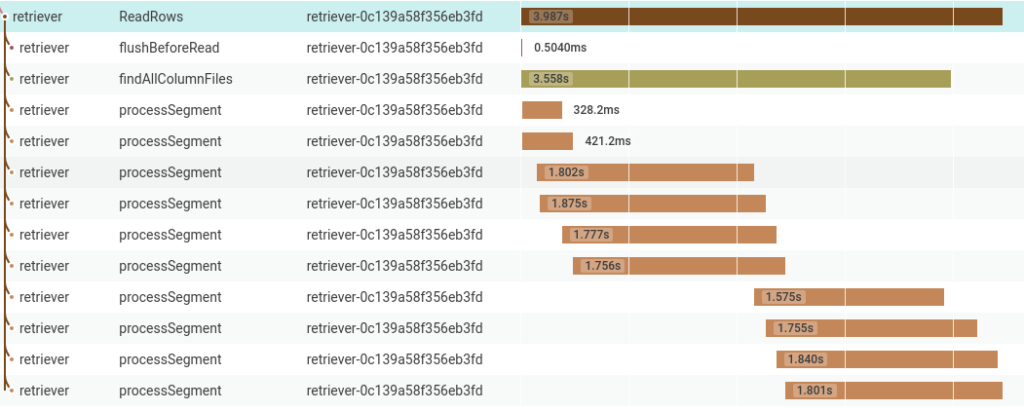
Additionally, tracing particular methods within a process was at least as important as tracing inter-process communication. For example, the trace excerpt below shows a single host processing several segments (time-bucketed slices of data) in parallel.

In this scenario, it’s important to be able to understand why processing some segments takes longer than others, how effective parallelism is, etc. Automatic middleware instrumentation isn’t a substitute for thoughtfully instrumenting code.
Trace discovery and aggregation are important too
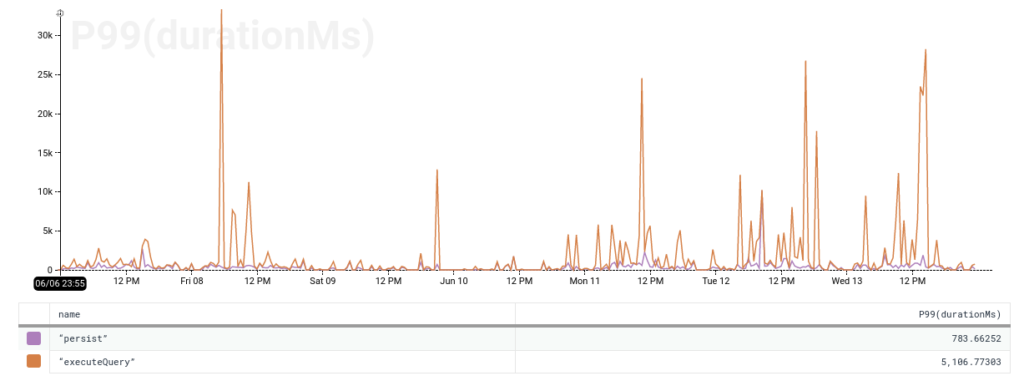
We also found that understanding how specific traces fit into the bigger picture is essential. If we find a trace where 90% of time is spent persisting results, how can we tell if it’s an outlier or not? The trace helps formulate a hypothesis, but switching back to an aggregate view confirms or disproves it.
In this case, we can see that the overall tail latency is much higher than the persist tail latency. So the persist operation is a bottleneck for some queries, but not for the slowest ones — so it’s not necessarily the first priority.

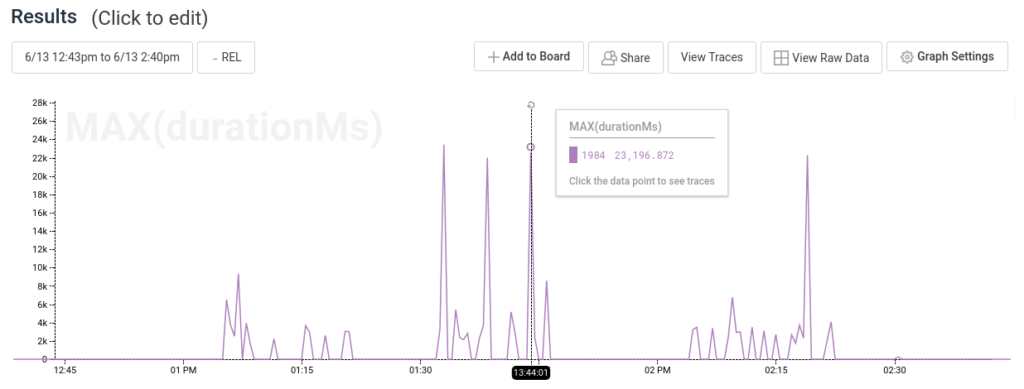
Similarly, being able to find relevant traces is important. The graph below shows query latencies for a single user. Even though most queries take less than a second, this user is seeing numerous queries take two to 25 seconds, so it’s worth digging into traces to figure out what’s going on.

Get your questions answered
If you have deeper technical questions, check out this ~20m in-depth discussion of Honeycomb Tracing that Honeycomb cofounder Christine and I recorded recently.
What’s next
If you have code that would benefit from tracing, you can get started right away. We’re continuing to work on making tracing more ergonomic and effective — if you have thoughts or questions, don’t hesitate to get in touch at support@honeycomb.io or @honeycombio on Twitter.
This is another installation in a series of dogfooding posts showing how and why we think Honeycomb is the future of systems observability. Stay tuned for more!


