Unlock the Real Value of Logs With Honeycomb Telemetry Pipeline and Honeycomb for Log Analytics
At Honeycomb, we know how important it is for organizations to have a unified observability platform. This is why we’re launching Honeycomb Telemetry Pipeline and Honeycomb for Log Analytics: to enable engineering teams to send and analyze data—including logs—into a single, unified platform.


Rocking the Logs: Fender’s Journey to Modern Observability
Learn MoreAt Honeycomb, we know how important it is for organizations to have a unified observability platform. This is why we’re launching Honeycomb Telemetry Pipeline and Honeycomb for Log Analytics: to enable engineering teams to send and analyze data—including logs—into a single, unified platform.
For too long, teams have had to wrangle large volumes of logs, their context scattered across multiple teams and tools, leading to knowledge silos. As a result, teams struggled to debug problems efficiently, and engineering stakeholders wrangled with rising—and often unpredictable—software and operational costs from managing all this data.
Ultimately, engineers need a fresh approach to observability—one that centralizes all telemetry data on a single platform for a unified, fast, and collaborative experience at a reasonable cost.
We’re proud to announce that with Honeycomb Telemetry Pipeline and Honeycomb for Log Analytics,you can extract value from your logs once again.
What is the Honeycomb Telemetry Pipeline?
Organizations generate mountains of logs across many sources. Managing these volumes at scale is no easy task. Honeycomb Telemetry Pipeline enables teams to centrally manage multiple streams of data (not just logs!) with lower operational overhead.
With the Telemetry Pipeline, you can remotely deploy and manage a fleet of OpenTelemetry Collectors (agents) and standardize on common OpenTelemetry terminology/configuration, which makes managing your telemetry pipeline significantly easier.
What is Honeycomb for Log Analytics?
Honeycomb for Log Analytics is a brand new experience we have built for logs within the Honeycomb observability platform. It integrates new support for log analysis into existing workflows so you can analyze all of your data in a single tool.
Honeycomb for Log Analytics helps teams regain control of their logs by enabling faster and more precise debugging without prior indexing. You no longer have to toil for hours (or even days!) to debug issues. Instead, spend your time solving core business challenges, innovating on new features, and delivering customer value.
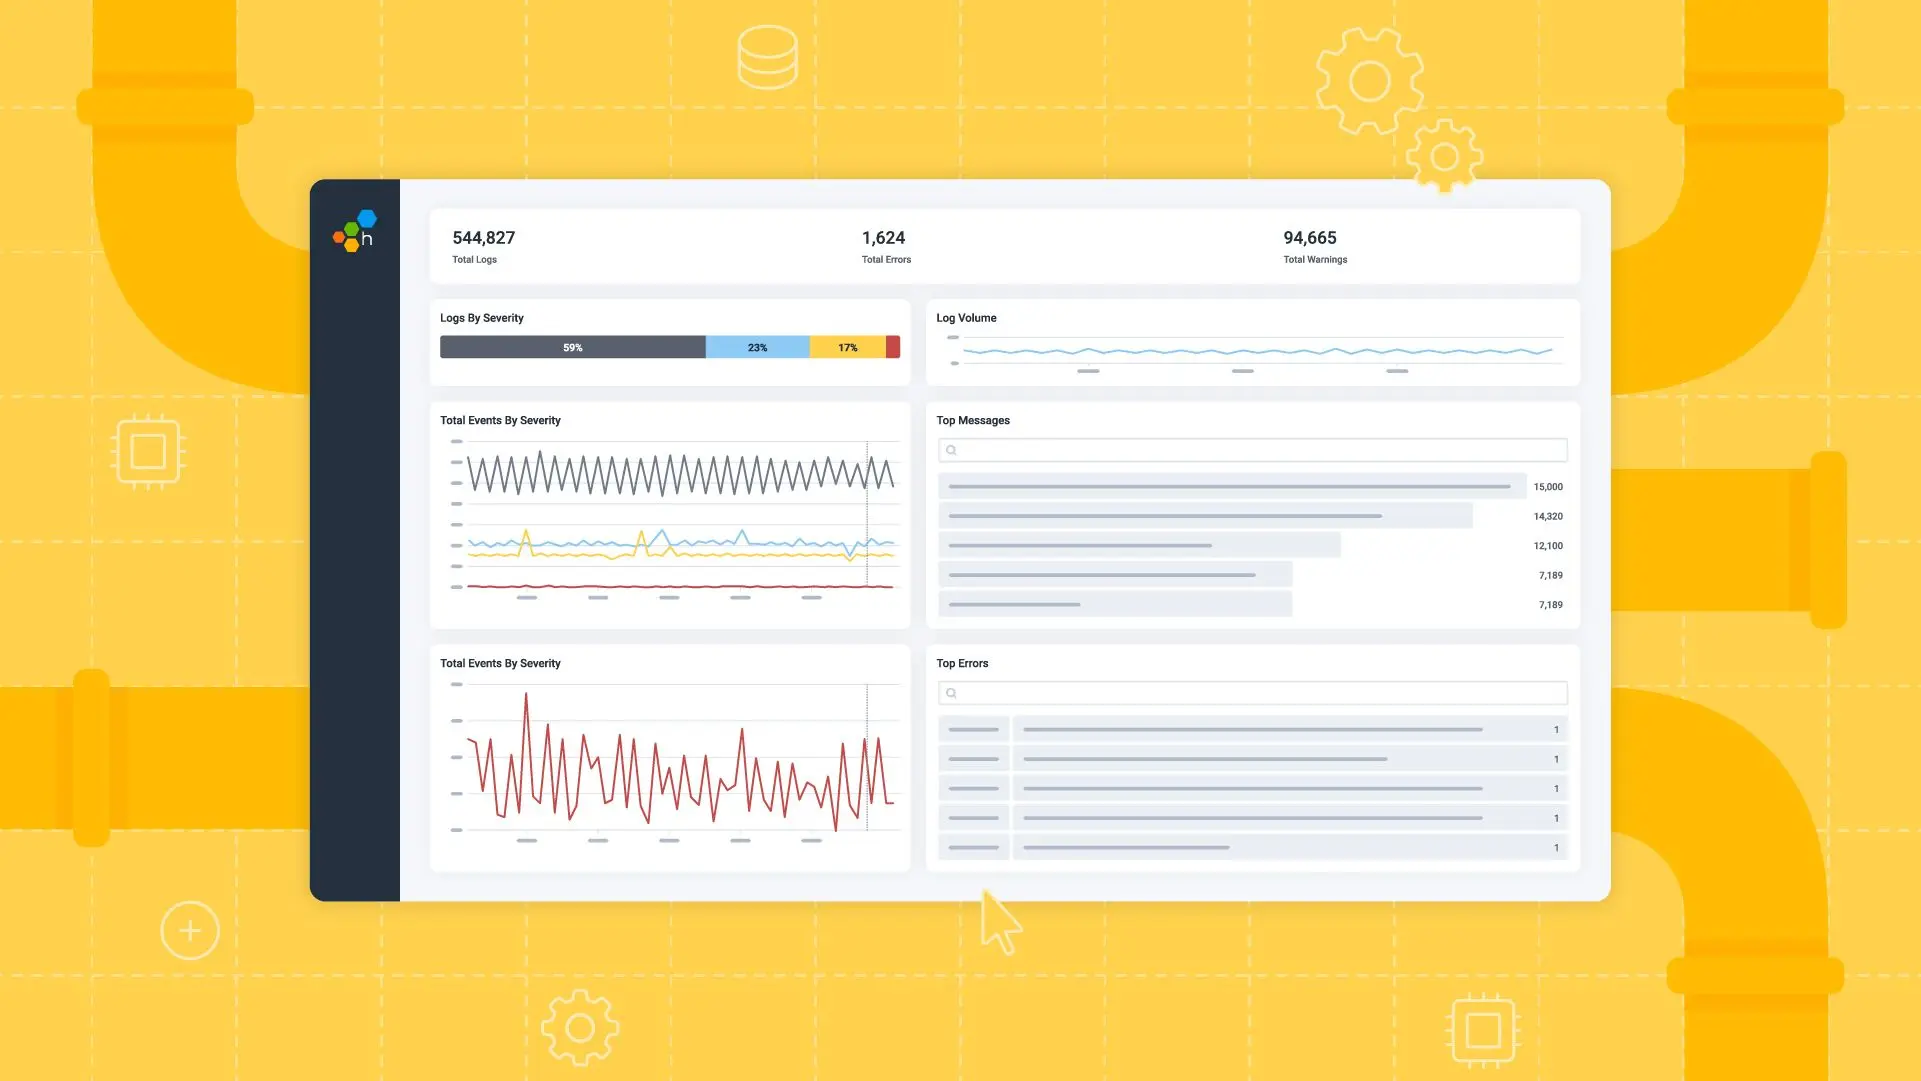
New Logs homepage
It’s difficult to find the important signals you should care about among noisy logs. The new Logs homepage surfaces insights instantly while enabling teams to further investigate and segment their data.
This view is built for high-cardinality data, which means you can freely group or filter by any fields and values instantly to better understand the state of your systems.
We’ve also made it easier for teams to take action on any observed insights. Each visualization is equipped with tools to help teams quickly get to the bottom of issues. With a single click, teams can leverage BubbleUp to identify anomalies, jump directly to the log events for a selected group or timestamp, and filter all visualizations on a field:value for more comparisons.
Explore Data
Looking to do open-ended exploration? The Explore Data tab lets you hop right into your data to start discovery:
- Scan and parse through your log lines sequentially in a single view.
- Add and remove relevant fields as you are exploring.
- Easily select by fields and values in this table.
- Run follow-up queries to investigate further with a single click!
Explore Data is available in two modes: table and log line view. Table view is optimized for structured data, allowing you to focus on specific fields and values in your events. Log Line view is optimized for semi-structured or unstructured data, allowing you to visualize your logs in a familiar format while still retaining the ability to customize the information presented in each log.
Explore Data is also available when running queries, allowing you to scan and parse through the underlying log data whenever you need to.
Proactively alert on your log data with Triggers and SLOs
Continue using existing features like Triggers and SLOs to proactively alert on your log data so you can focus on things that truly matter for the business. For example:
- Get notified when specific strategic customers are experiencing elevated log errors with triggers
- Define a business goal around customers’ performance expectations in your product with SLOs.
Predictable and transparent pricing
With Honeycomb, you can focus on extracting meaningful insights while controlling costs. Prioritize the logs that matter for real-time insights, send a copy to affordable storage, and enrich your data with unlimited metadata—at no extra cost. Our pricing gives you the flexibility to explore and optimize your logs. Send data for $0.10 per GB.
Additionally, our burst protection capabilities ensure you are not penalized for unexpected spikes in traffic so you can focus on solving customer problems instead of software billing problems.
Get Honeycomb Telemetry Pipeline and Honeycomb for Log Analytics today
Honeycomb Telemetry Pipeline and Honeycomb for Log Analytics is available today! All existing customers will have access to Log Analytics capabilities like the Logs homepage and Explore Data. Only Enterprise customers will have access to SLOs.
Ready to talk to us about how you can better manage and analyze your logs?
Book a personalized demo today!
Want to know more?
Talk to our team to arrange a custom demo or for help finding the right plan.