Event Foo: Building Better Events
This post from new Honeycomber Rachel Perkins is the seventh in our series on the how, why, and what of events. An event is a record of something that your system did. A line…

By: Rachel Perkins

This post from new Honeycomber Rachel Perkins is the seventh in our series on the how, why, and what of events.
An event is a record of something that your system did. A line in a log file is typically thought of as an event, but events in Honeycomb can be a lot more than that—they can include data from different sources, fields calculated from values from within, or external to the event itself, and more.
An event represents a unit of work. It can tell a story about a complete thing that happened–for example, how long a given request took, or what exact path it took through your systems. What is a unit of work in your service? Can you make your events better?
In this blog post, we’ll walk through a simple story in which the protagonist (hey, that’s YOU!) improves the contents of their events to get more information about why their site is slowing down.
Where should I start?
When looking to get more visibility into the behavior of systems, we often begin by thinking about how long key tasks take. A common starting approach is to focus on the things that tend to be the most expensive. For example you might:
- Instrument MySQL calls with a timer (how long are these calls taking?)
- Instrument callouts to, say, Kafka with a timer as well.
To achieve this in Honeycomb (How to make and send events), you:
- Build an event with a timer field called request_roundtrip_dur with the MySQL and Kafka timers in it.
- Send that data to Honeycomb.
Pro-tip: Name your event fields in a consistent way to make it easier to pick different types of things out from the column list. For example, use _dur in anything that’s a duration. We recommend you put the unit (_ms, _sec, _ns, _µs, etc.) in there too—you may be using units consistently now, but you know how that can go sideways fast.
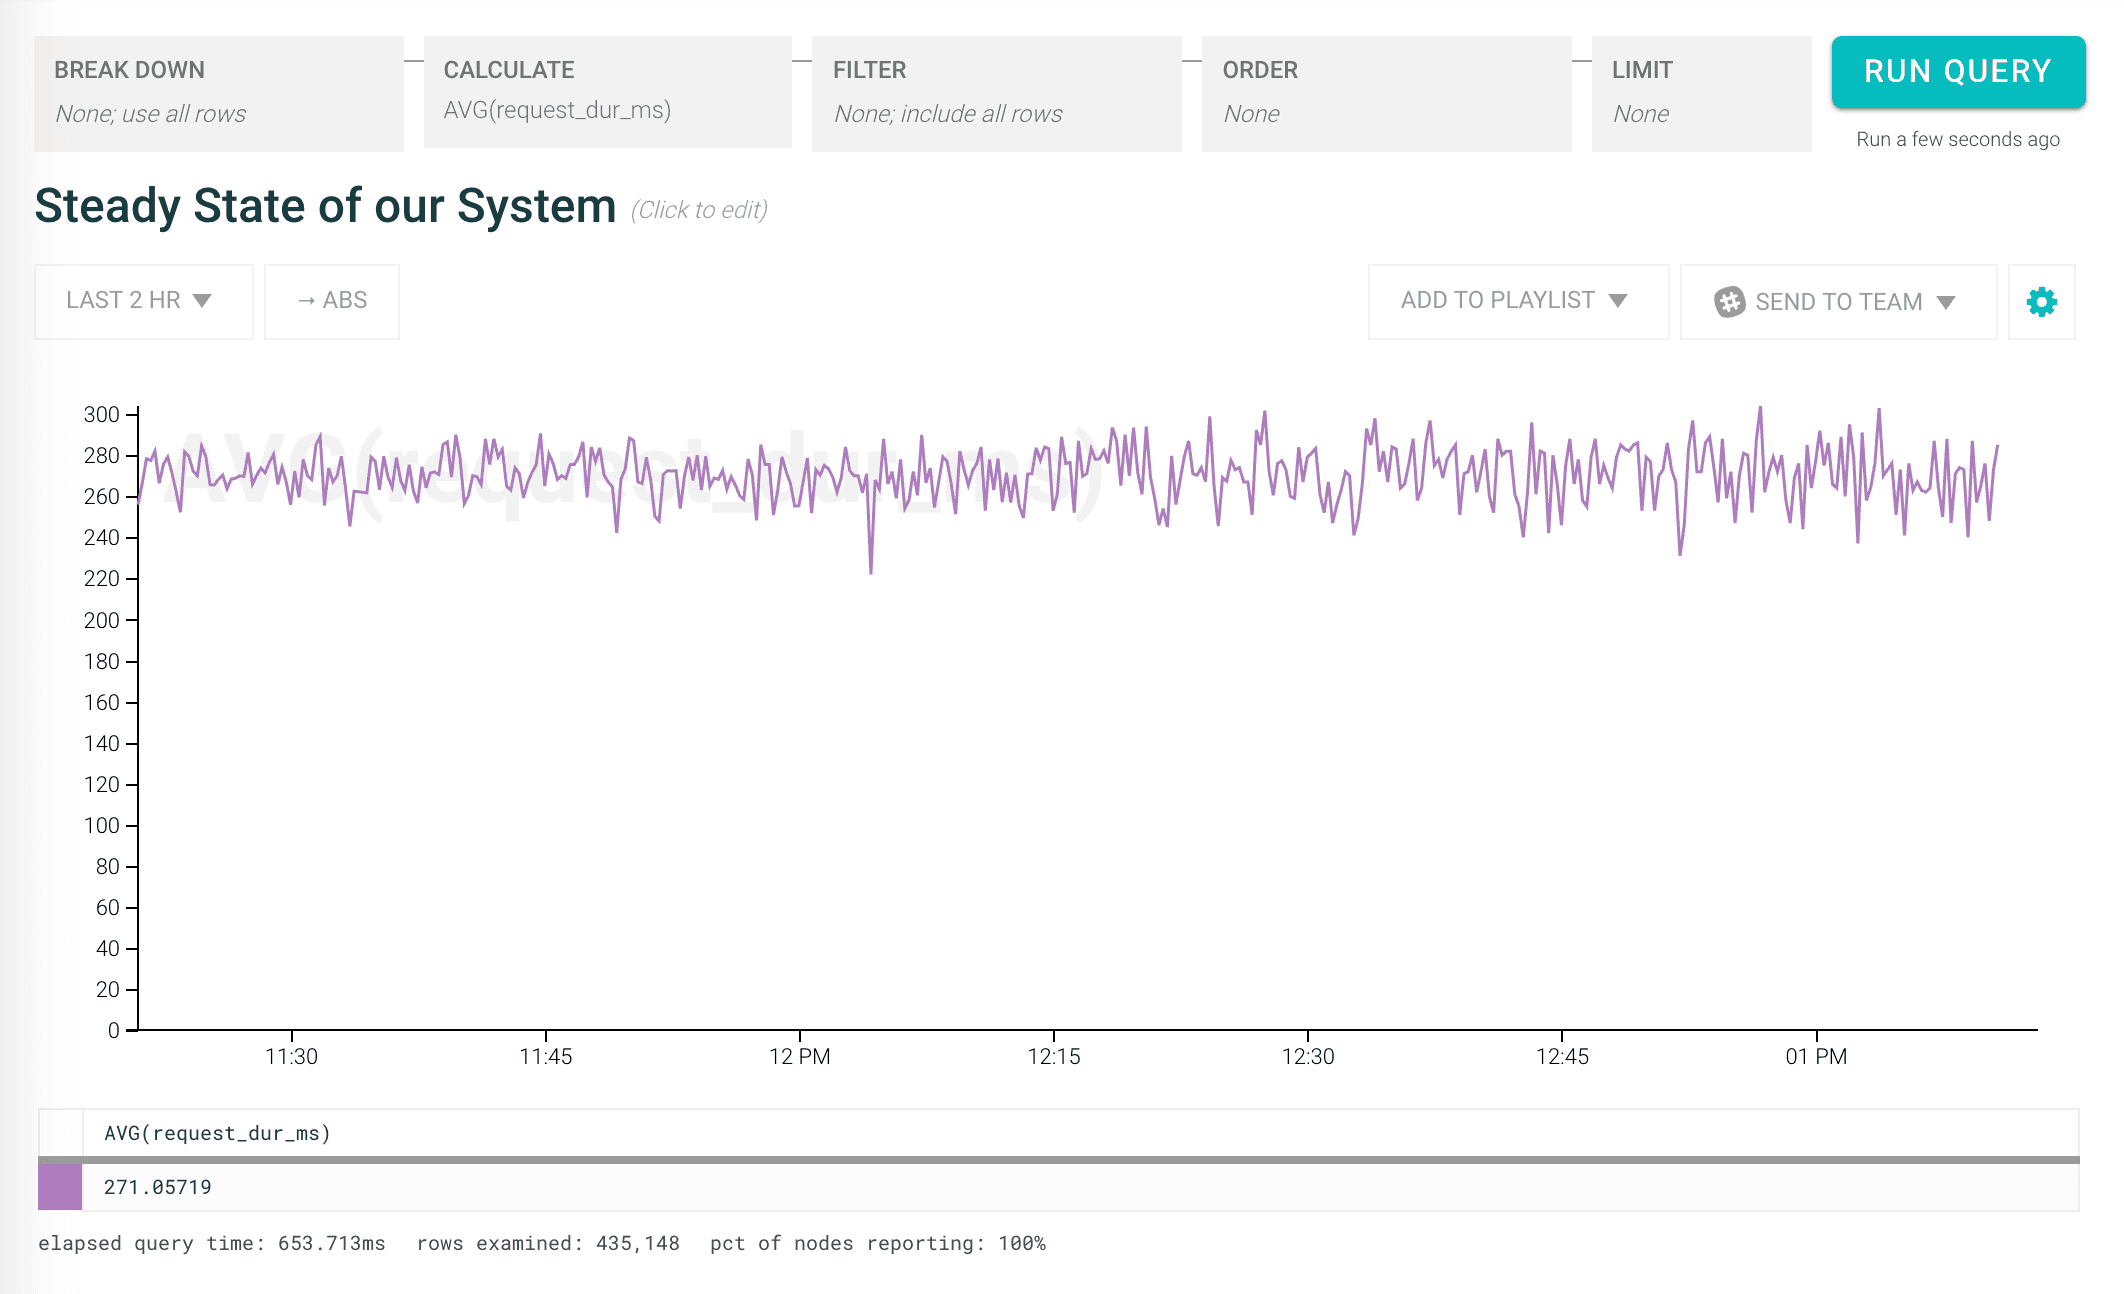
For a while, the site rocked pretty steady:

So you keep on keeping on until….
À la recherche du temps perdu
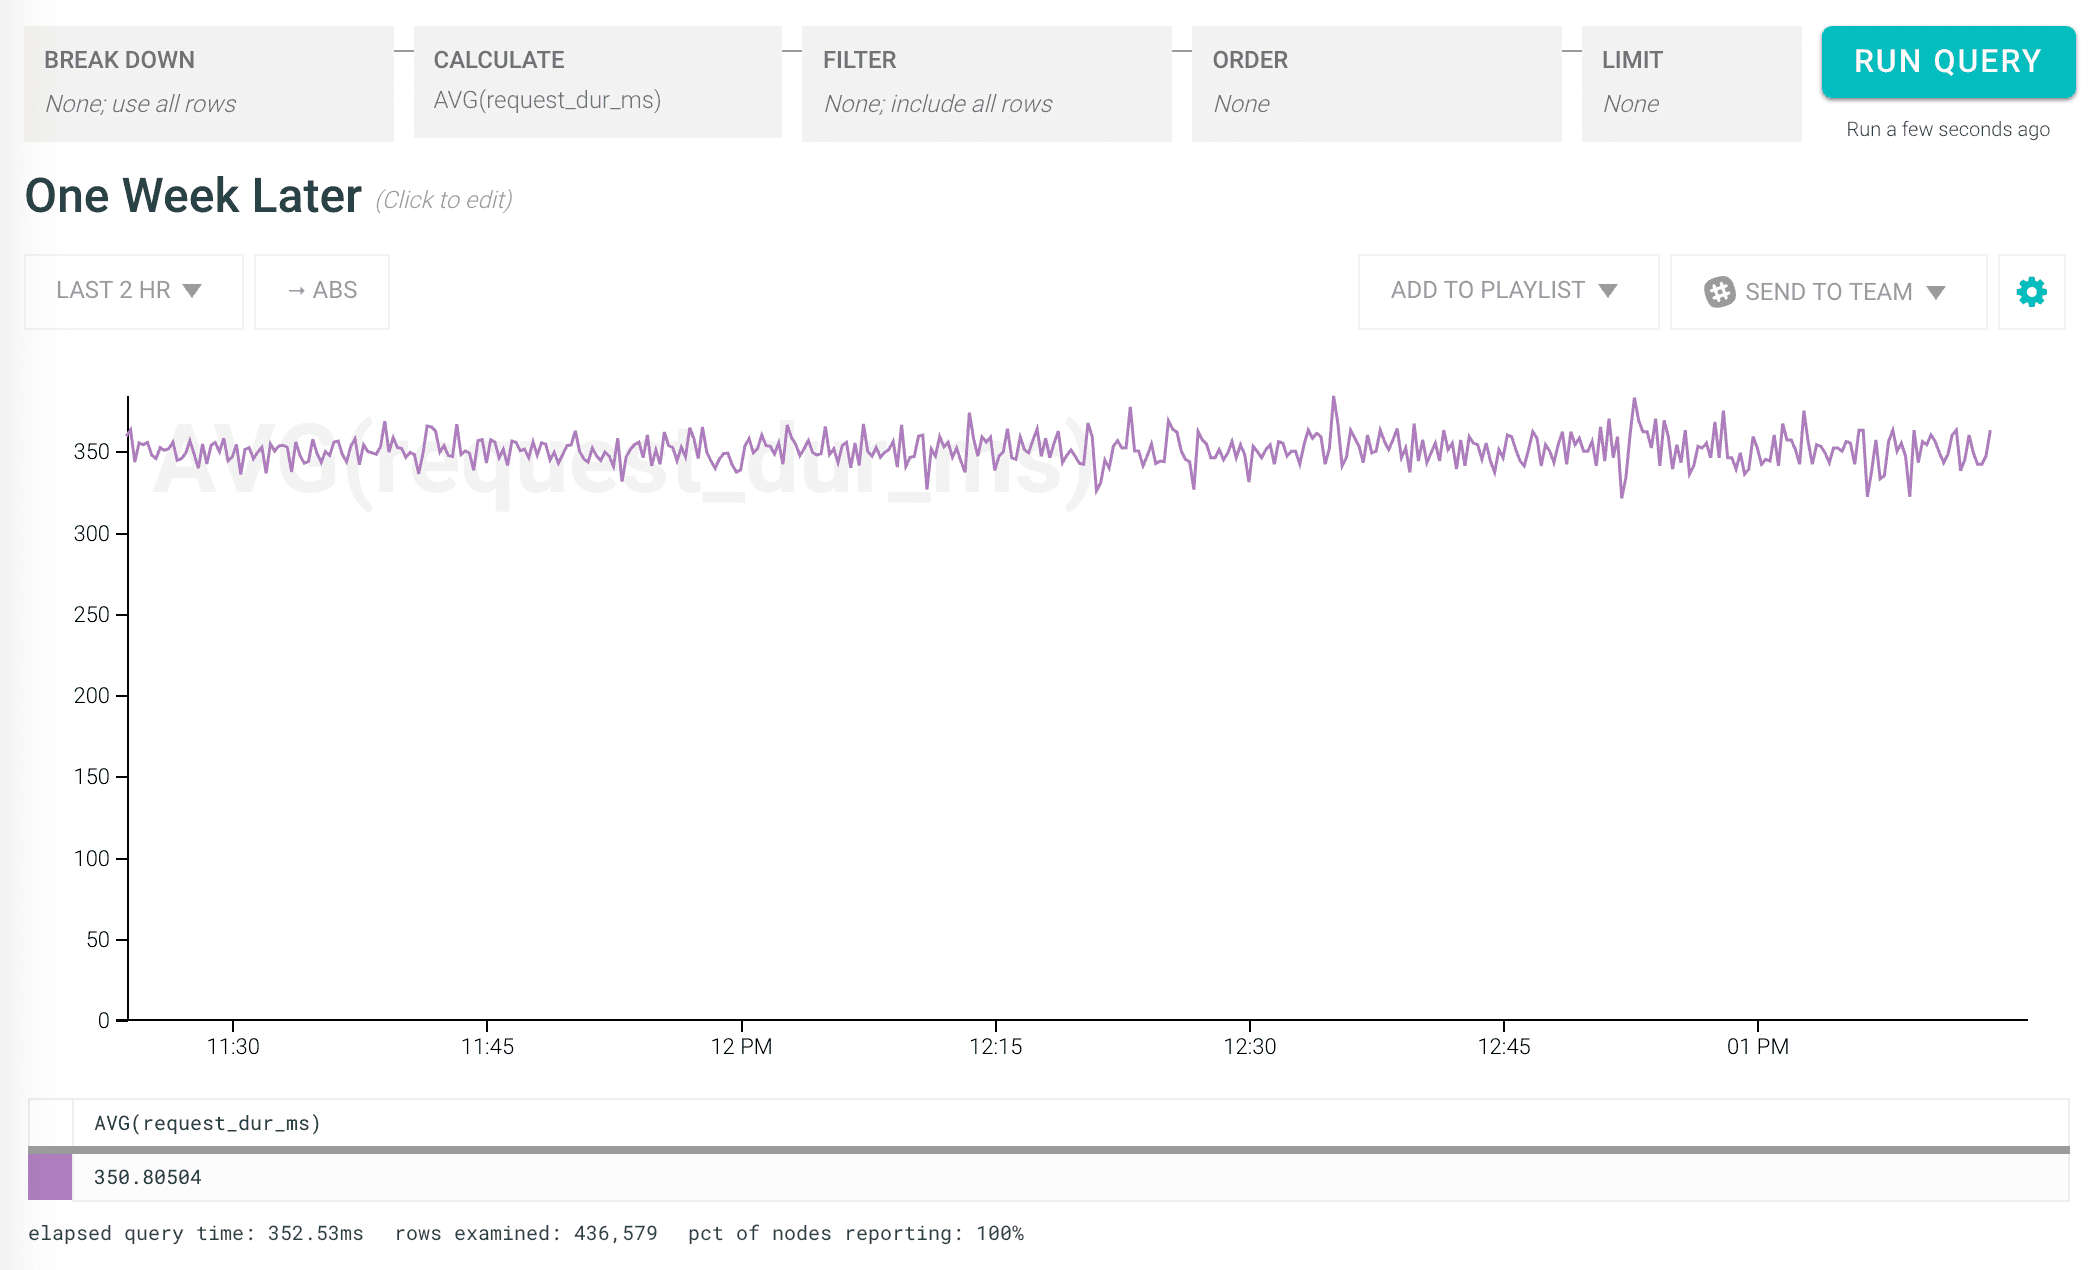
Oncall has been pretty chill, but a few days ago the team rolled out some new code, and things seem to get a bit slower. Time to dig in to find out what happened. First, let’s see how long stuff overall is taking:

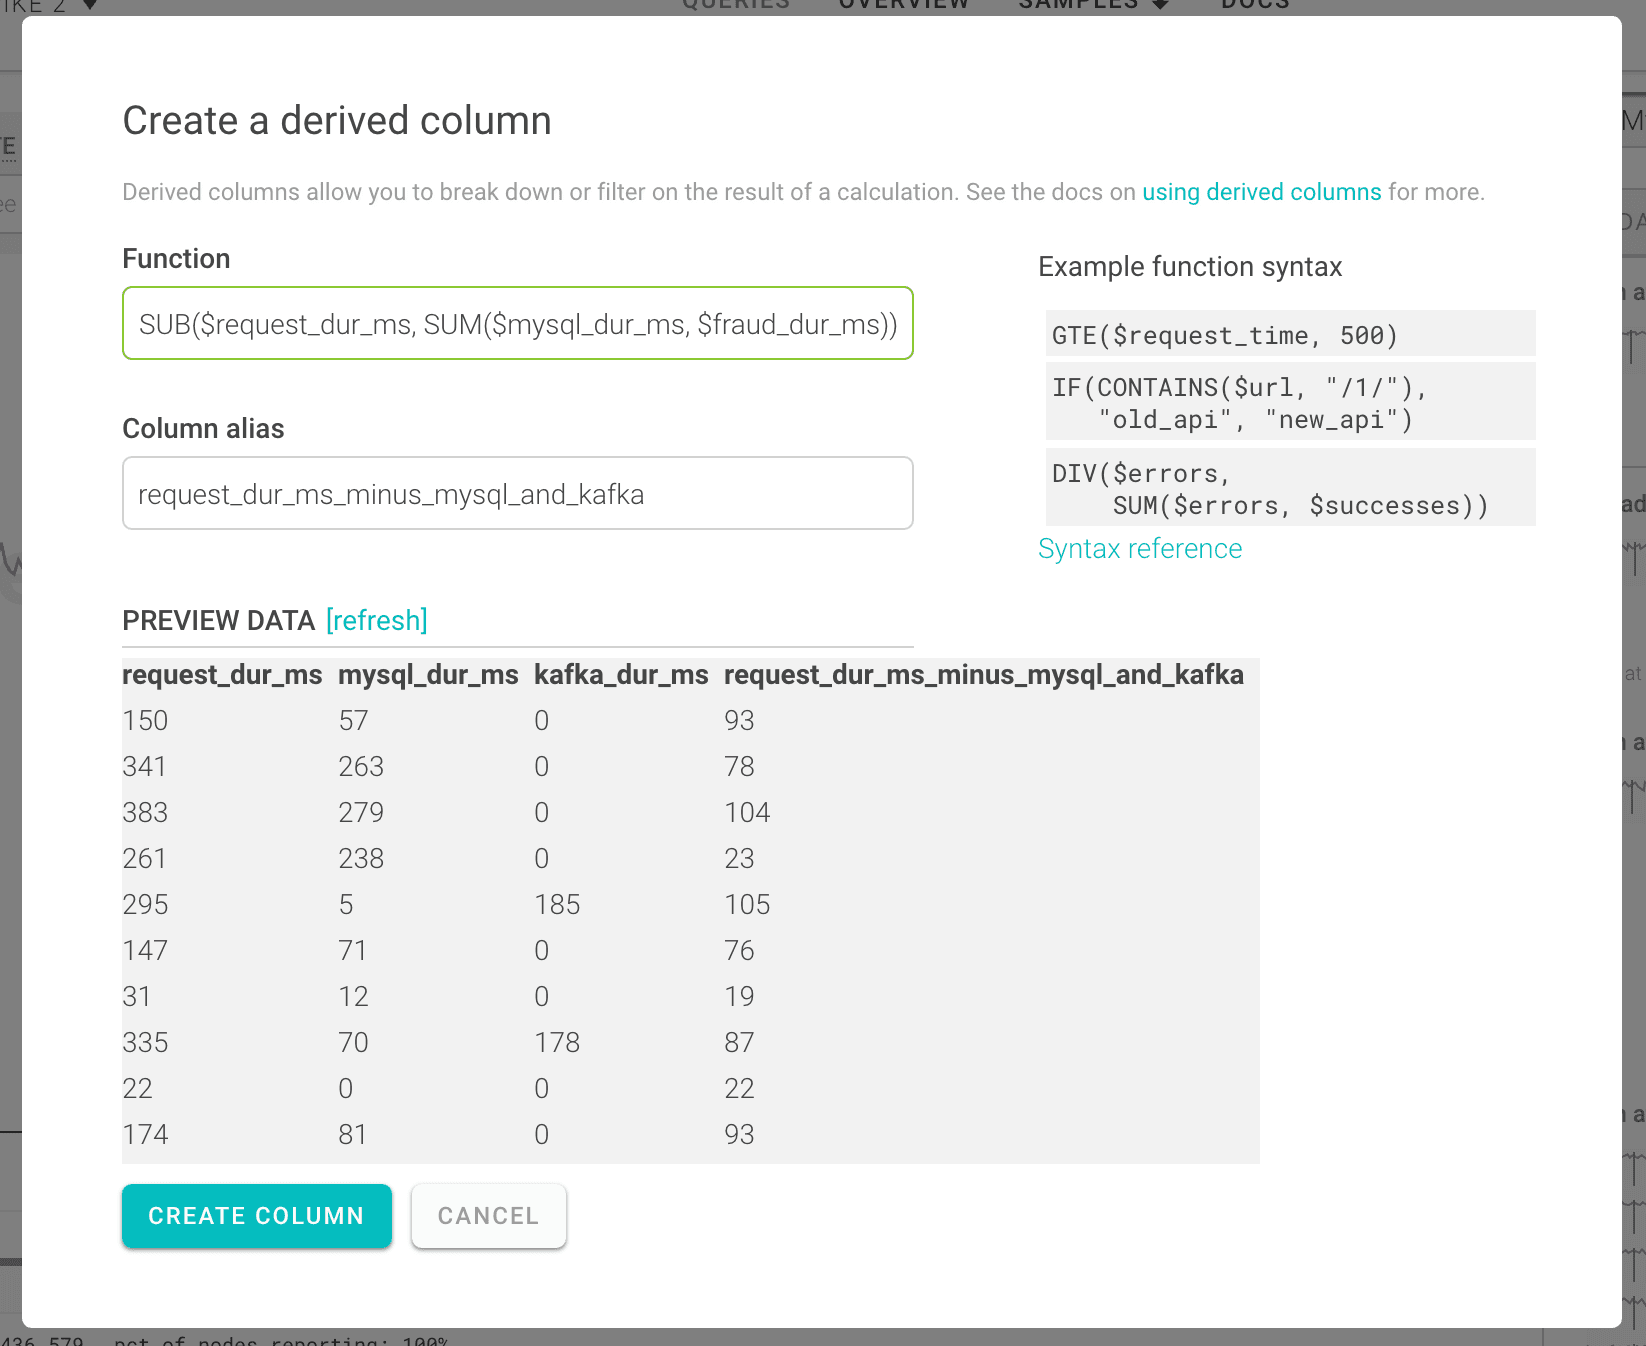
Things are getting slower overall, but it’s hard to see whether the cause is hiding in one of your existing timers. You want to find out if there is an obvious new culprit that needs a timer added—one way to do this is to set up a derived column that adds up all your existing timers and subtracts them from the average request time:

Looking at your new derived column, it’s clear that the parts of this event that are slow are not currently being timed—77ms are missing entirely from our existing timers! (Click through for the detail):

It’s time to add a new timer around the next few obvious culprits, so you decide to see if it’s the JSON parsing that’s contributing this extra time:
- Update your event with JSON parsing timing.
Stay on target
After a few days, you can tell that the JSON parsing accounts for a small part of the additional slowness, but not the majority of it, and it’s not taking significantly longer than it was a week or two ago:

Obviously the new code in the push is suspect, so it’s time to start looking at that in more detail.
You know that changes were made to the auth module and to some validation performed by another piece of code so you start there and:
- Add timings to the auth and validation subsystems.
AHA!

That change to the auth system broke caching—you hadn’t set up a timer there because it had always been fast from the cache before. Now you can see how that one issue impacted the overall system performance.
Of course there’s still a little bit of unknown time being spent, but you can put off investigating that for another day and get on with filing a ticket on the auth module caching 🙂
Want to know more?
Talk to our team to arrange a custom demo or for help finding the right plan.