Fewer Logs, More Value
We’re always interested in improving the signal-to-noise ratio of our internal telemetry at Honeycomb. In an effort to reduce the amount of noise in our logs, we looked at reducing and deduplicating the logs emitted by our infrastructure and applications.

By: Alex Boten


The Director’s Guide to the Future of Observability: AI, OpenTelemetry, and Complex Systems
Learn MoreWe’re always interested in improving the signal-to-noise ratio of our internal telemetry at Honeycomb. In an effort to reduce the amount of noise in our logs, we looked at reducing and deduplicating the logs emitted by our infrastructure and applications.
In version v0.107.0 of the Collector’s release, a new component was added to the Contrib and Kubernetes distributions, the logdedup processor. The Log Deduplication processor allows users to aggregate duplicate logs via the Collector, and keeps a running count of the number of times the logs were deduplicated. We started working on a similar component at Honeycomb, and when we proposed it to the community, our friends and OpenTelemetry collaborators at ObservIQ chimed in to point us to an existing component they created some time ago. Not wanting to reinvent the wheel, we asked if they would be willing to donate the component, and when they said yes, we jumped at the opportunity to collaborate with them on it. Soon after, the Log Deduplication processor was shipped in a release of the Contrib distribution of the OpenTelemetry Collector.

Let’s start with an easy win: Kubernetes logs
With the new build of the Collector in hand, we looked at some Kubernetes logs that were pretty noisy and easy to collect. Based on the following sample, we could immediately see opportunities to deduplicate log records with little effort:
time="2024-08-23T11:03:01Z" level=warning msg="No files found for pattern" Pattern="/var/log/pods/app1-28734625-tm8mx_5ffbf6e6-3ed4-4111-8fa9-917720d06a3c/*/*"
time="2024-08-23T11:03:01Z" level=warning msg="No files found for pattern" Pattern="/var/log/pods/app1-28734626-qq9sr_57298751-f350-4751-95d8-d23ee21e9496/*/*"
time="2024-08-23T11:03:02Z" level=warning msg="No files found for pattern" Pattern="/var/log/pods/app1-28734625-tm8mx_5ffbf6e6-3ed4-4111-8fa9-917720d06a3c/*/*"
time="2024-08-23T11:03:02Z" level=warning msg="No files found for pattern" Pattern="/var/log/pods/app1-28734626-qq9sr_57298751-f350-4751-95d8-d23ee21e9496/*/*"Our infrastructure was already configured to send Kubernetes logs through an internal installation of the OpenTelemetry Collector, so all we needed was to add the Log Deduplication processor to our telemetry pipeline configuration. We did that by adding a logdedup processor configuration to the logs pipeline:
receivers:
  filelog:
    include:
      - app.log
    start_at: beginning

processors:
  logdedup:
    log_count_attribute: sampleRate

exporters:
  debug:
    verbosity: detailed

service
  pipelines:
    logs:
      receivers: [filelog]
      processors: [logdedup]
exporters: [debug]This configures the processor to set a sampleRate attribute on the deduped log record to capture the number of times the log would have been emitted. In order to quickly iterate on the configuration, we tested this with a filelog receiver that can take a local file as input, and reviewed the output using the debug exporter. The resulting log records emitted by the debug exporter look something like this:
2024-08-27T15:31:10.984-0700	info	LogsExporter	{"kind": "exporter", "data_type": "logs", "name": "debug/with-dedupe", "resource logs": 1, "log records": 4}
2024-08-27T15:31:10.985-0700	info	ResourceLog #0
Resource SchemaURL:
ScopeLogs #0
ScopeLogs SchemaURL:
InstrumentationScope
LogRecord #0
ObservedTimestamp: 2024-08-27 22:31:01.251059 +0000 UTC
Timestamp: 2024-08-27 22:31:10.950973 +0000 UTC
SeverityText:
SeverityNumber: Unspecified(0)
Body: Str(time="2024-08-23T11:03:02Z" level=warning msg="No files found for pattern" Pattern="/var/log/pods/app1-28734626-qq9sr_57298751-f350-4751-95d8-d23ee21e9496/*/*")
Attributes:
 	-> log.file.name: Str(bah2.log)
 	-> sampleRate: Int(1)
 	-> first_observed_timestamp: Str(2024-08-27T22:31:01Z)
 	-> last_observed_timestamp: Str(2024-08-27T22:31:01Z)
...Before looking at the log, I was expecting to see at least a 50% deduplication, but that expectation was unmet.
As the first line shows, four log records were exported. The Log Deduplication processor expects the body of the log record to match, and looking more closely at the debug output, the log body is formed of key-value pairs which include a time value. Aha! We just needed to parse the body and ignore the time field. The filelog receiver supports configuring operators to perform additional manipulation of the incoming log data. To improve the effectiveness of the logdedup processor, we needed to modify the logs by:
- Using the key value parser to split incoming log lines into key value pairs.
- Parsing the timestamp from the time attribute parsed in step 1.
- Removing the time attribute as it was no longer needed.
- Overriding the log’s body with the msg attribute also parsed in step 1.
These operations can be expressed via the following Collector configuration:
receivers:
  filelog:
    include:
      - app.log
    start_at: beginning
    operators:
      - type: key_value_parser
        id: kv-parser
        timestamp:
          parse_from: attributes.time
          layout: '%Y-%m-%dT%H:%M:%SZ'
      - type: remove
        field: attributes.time
      - type: move
        from: attributes.msg
to: bodyWith the new config in place, running the test once again provided us with more encouraging results:
2024-08-27T15:39:33.788-0700	info	LogsExporter	{"kind": "exporter", "data_type": "logs", "name": "debug/with-dedupe", "resource logs": 1, "log records": 2}
2024-08-27T15:39:33.788-0700	info	ResourceLog #0
Resource SchemaURL:
ScopeLogs #0
ScopeLogs SchemaURL:
InstrumentationScope
LogRecord #0
ObservedTimestamp: 2024-08-27 22:39:24.060599 +0000 UTC
Timestamp: 2024-08-27 22:39:33.760501 +0000 UTC
SeverityText: warning
SeverityNumber: Warn(13)
Body: Str(No files found for pattern)
Attributes:
 	-> Pattern: Str(/var/log/pods/app1-28734625-tm8mx_5ffbf6e6-3ed4-4111-8fa9-917720d06a3c/*/*)
 	-> log.file.name: Str(bah2.log)
 	-> level: Str(warning)
 	-> sampleRate: Int(2)
 	-> first_observed_timestamp: Str(2024-08-27T22:39:24Z)
 	-> last_observed_timestamp: Str(2024-08-27T22:39:24Z)
...The count of log records exported seen in the first line of the output shows that we’ve now exported two logs instead of the original four. In addition, the sampleRate attribute also matches the expectation, since it shows us that each log has a sample rate of two.
Further reducing logs with the Reduce processor
Deduplication is a great first pass at filtering out noisy logs. If they match exactly, it makes sense to not bother sending duplicate events for each instance of it. But what about application logs that are similar, but not identical?
Once we made some progress on deduplication, we wondered if there were other ways we could reduce our remaining log volume. It turns out our infrastructure emitted another category of similar logs. These were logs where the body was the same, but attributes could differ. We put together the Reduce processor: a custom processor that allows us to configure attributes we want to see merged via a custom strategy, allowing us to further reduce the number of logs emitted.
The following is a sample configuration of the Reduce processor:
reduce:
  group_by:
	- "host.name"
  reduce_timeout: 10s
  max_reduce_timeout: 60s
  max_reduce_count: 100
  cache_size: 10000
  merge_strategies:
	"some-attribute": first
	"another-attribute": last
  reduce_count_attribute: sampleRate
  first_seen_attribute: first_timestamp
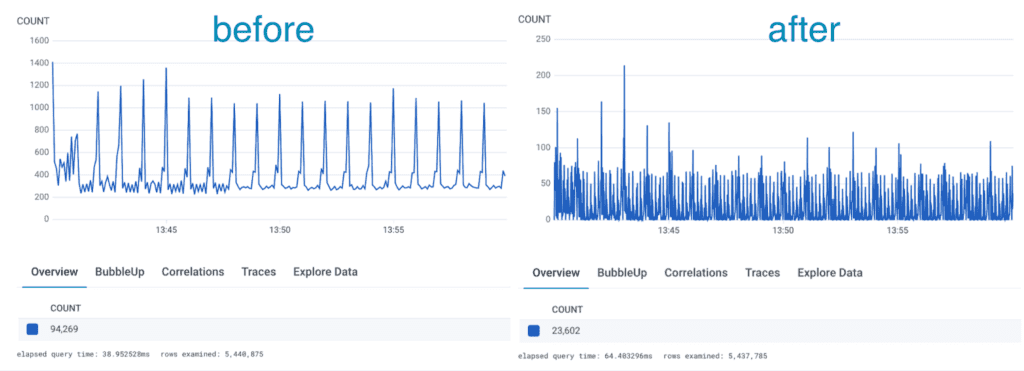
last_seen_attribute: last_timestampNote that although the code is available for anyone to use, this processor currently requires building a custom Collector to include it, as no existing distribution includes this processor today. After deploying the Log Deduplication processor and the Reduce processor in our infrastructure, we observed a dramatic reduction in logs: about 75% on our test data set. In the case of some specific application, logs were reduced by up to 95% without modifying any application code!

Lessons learned
The most important mechanism to reduce the overall load of logs was ensuring they were parsed correctly in the first place. As is often the case, logs and their formats grow organically and vary from service to service, or team to team. This means that a single mechanism for parsing will likely not fit for all cases.
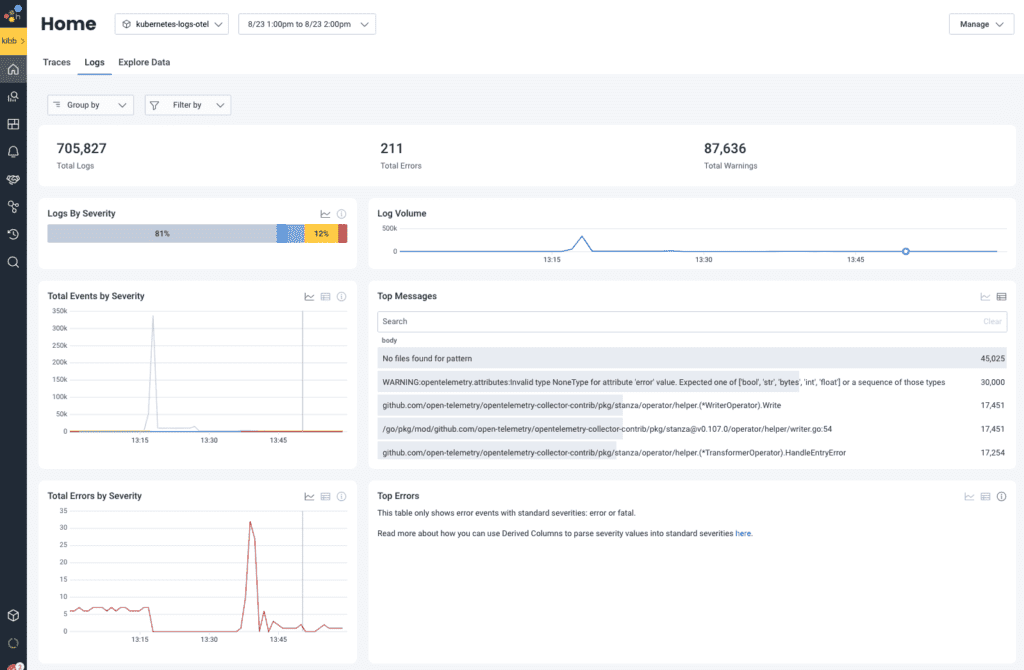
When we investigated our logs, we started with the filelog receiver that’s preconfigured with the OpenTelemetry Helm chart and quickly found that it didn’t cover all of our cases. But after reviewing the logs we were receiving via the Honeycomb UI, we quickly identified some easy wins for deduplication and reduction.
Additionally, since we started running this in production, we used the sampleRate attribute to identify interesting patterns in the logs produced by our systems. In some cases, applications were too noisy, but in others, we found problems causing these spikes in emitted logs.
Get more value out of your logs with Honeycomb for Log Analytics.
Want to know more?
Talk to our team to arrange a custom demo or for help finding the right plan.