Honeycomb <3 Kubernetes Observability
Introducing the Honeycomb Kubernetes Agent and ksonnet integration We’re excited to release the Honeycomb Kubernetes Agent. The agent provides a flexible way to aggregate, structure, and enrich events from applications running on Kubernetes, before…

By: Eben Freeman
Introducing the Honeycomb Kubernetes Agent and ksonnet integration
We’re excited to release the Honeycomb Kubernetes Agent. The agent provides a flexible way to aggregate, structure, and enrich events from applications running on Kubernetes, before sending them to Honeycomb for you to explore. A huge thanks to the fine folks at Heptio who worked with us on developing this agent and making it available as a ksonnet mixin!
Why You Might Care
Kubernetes can be complicated, and identifying the root causes of problems within a cluster can be difficult. Is something wrong with a particular node? An application’s latest code? Did a customer start sending traffic that’s causing the service to behave weirdly? Does a pod have a noisy neighbor?
By consolidating application and cluster data into a single rich event, Honeycomb makes it possible to ask unconstrained questions in order to track down issues and ship with confidence.
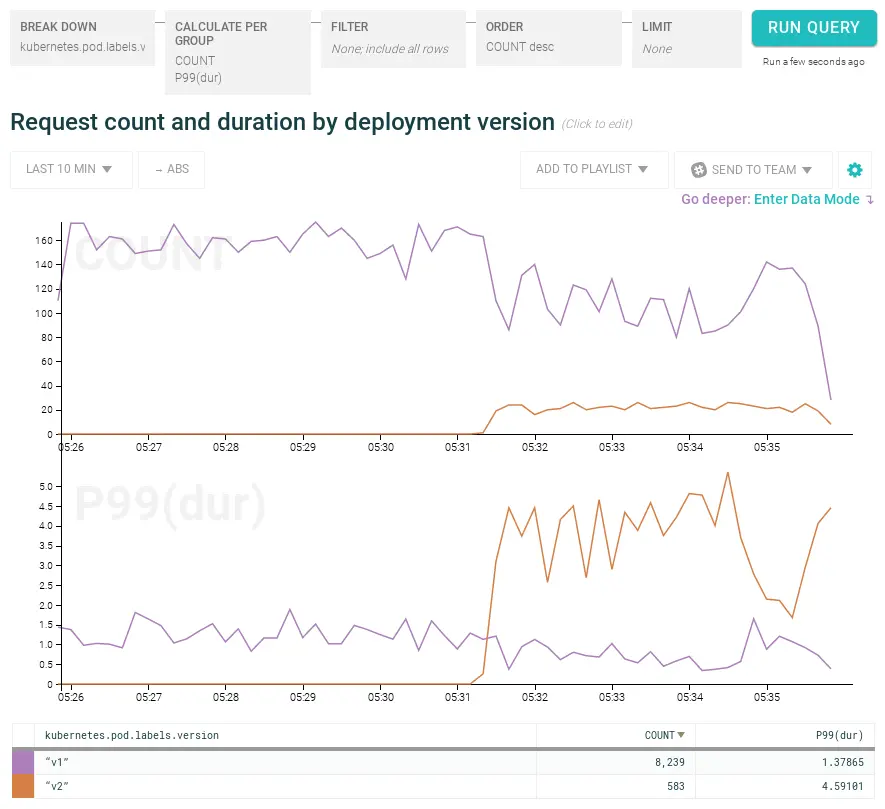
How did response time change after the canary deployment?

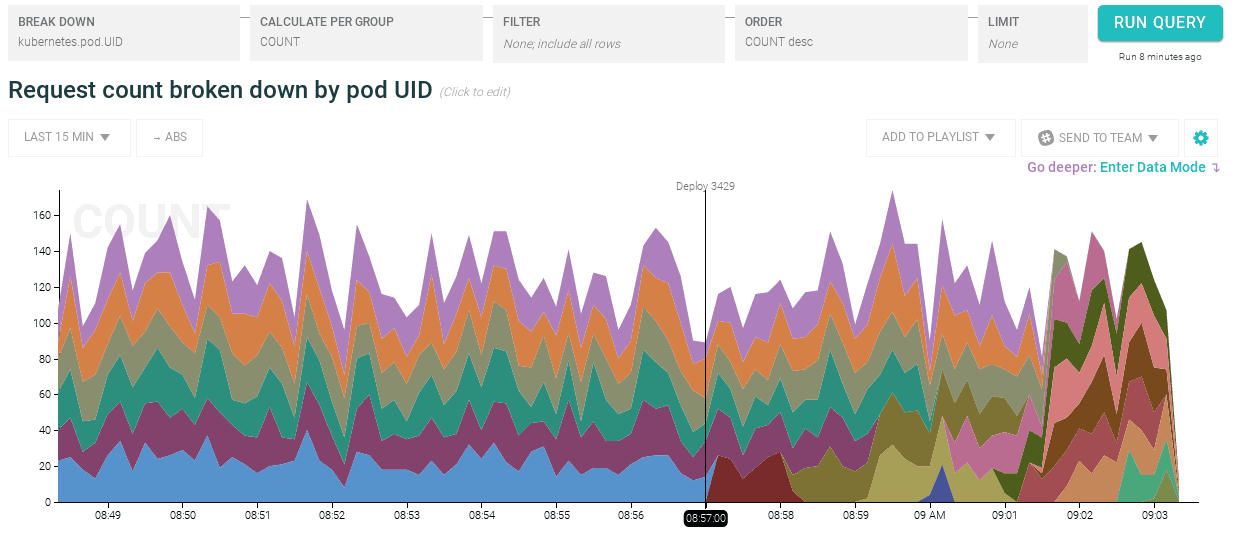
When did that deployment’s containers start crashing?
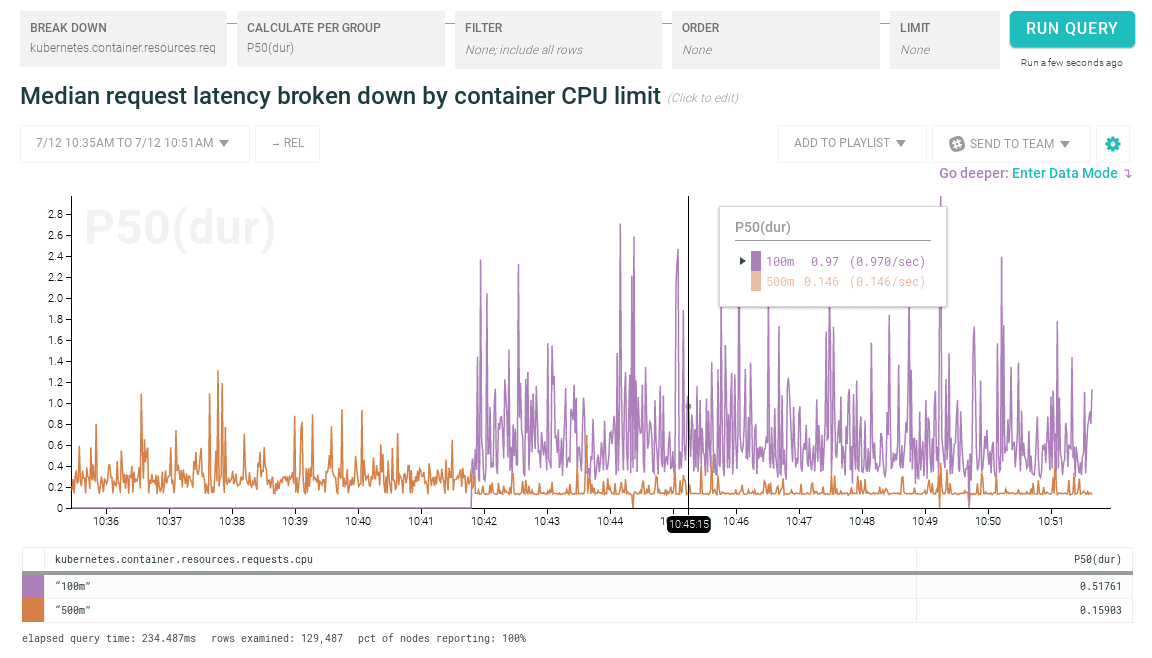
How did performance change when we decreased resource limits for an application container?
How It Works
The Honeycomb agent can be deployed as a DaemonSet, meaning that one copy of it runs on every node in your cluster.
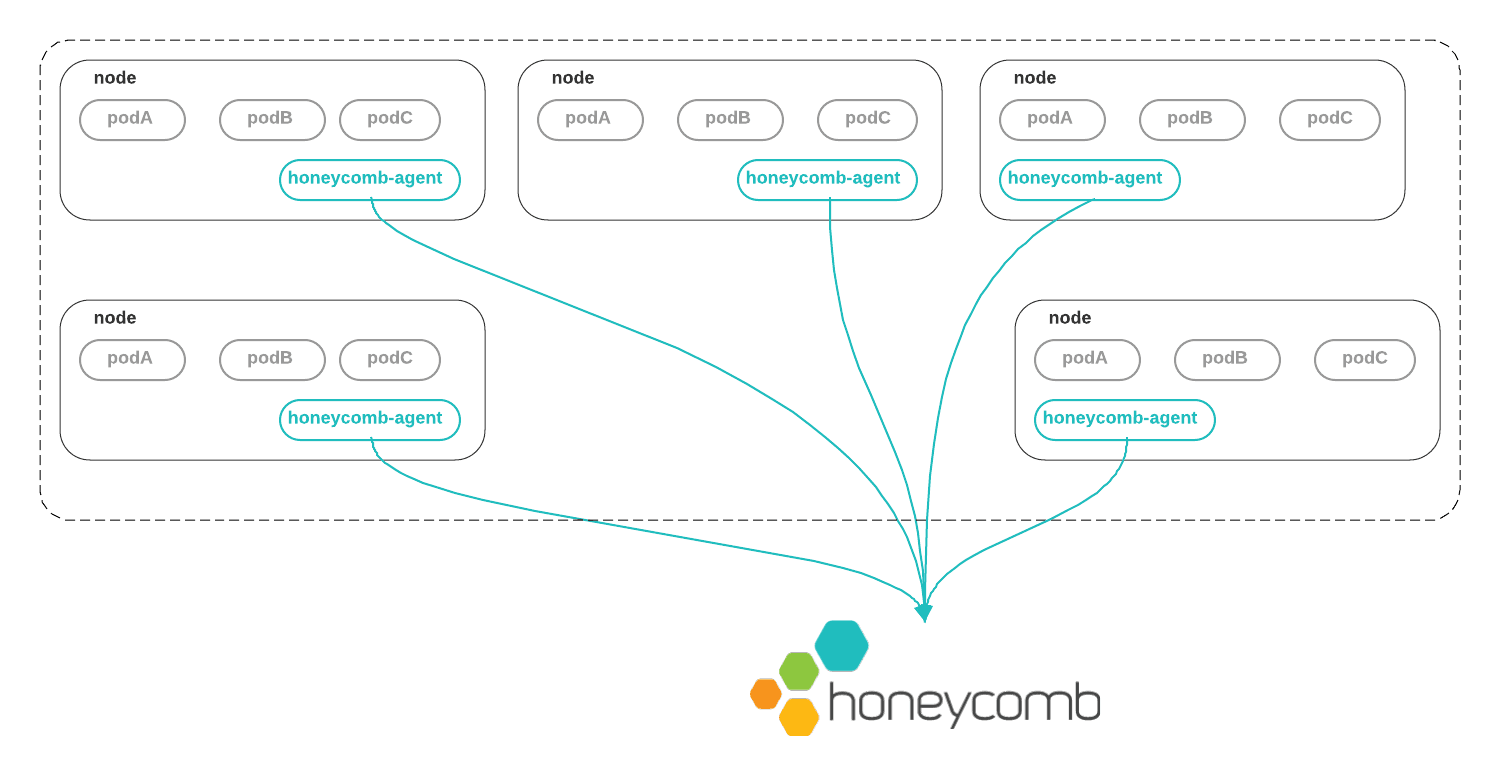
Within each node, the container runtime writes containers’ stdout and stderr to files on the host. The Honeycomb agent tails these files, parses their contents into structured events, and sends those events to Honeycomb. This means that the agent can be rolled out without changing existing deployments.
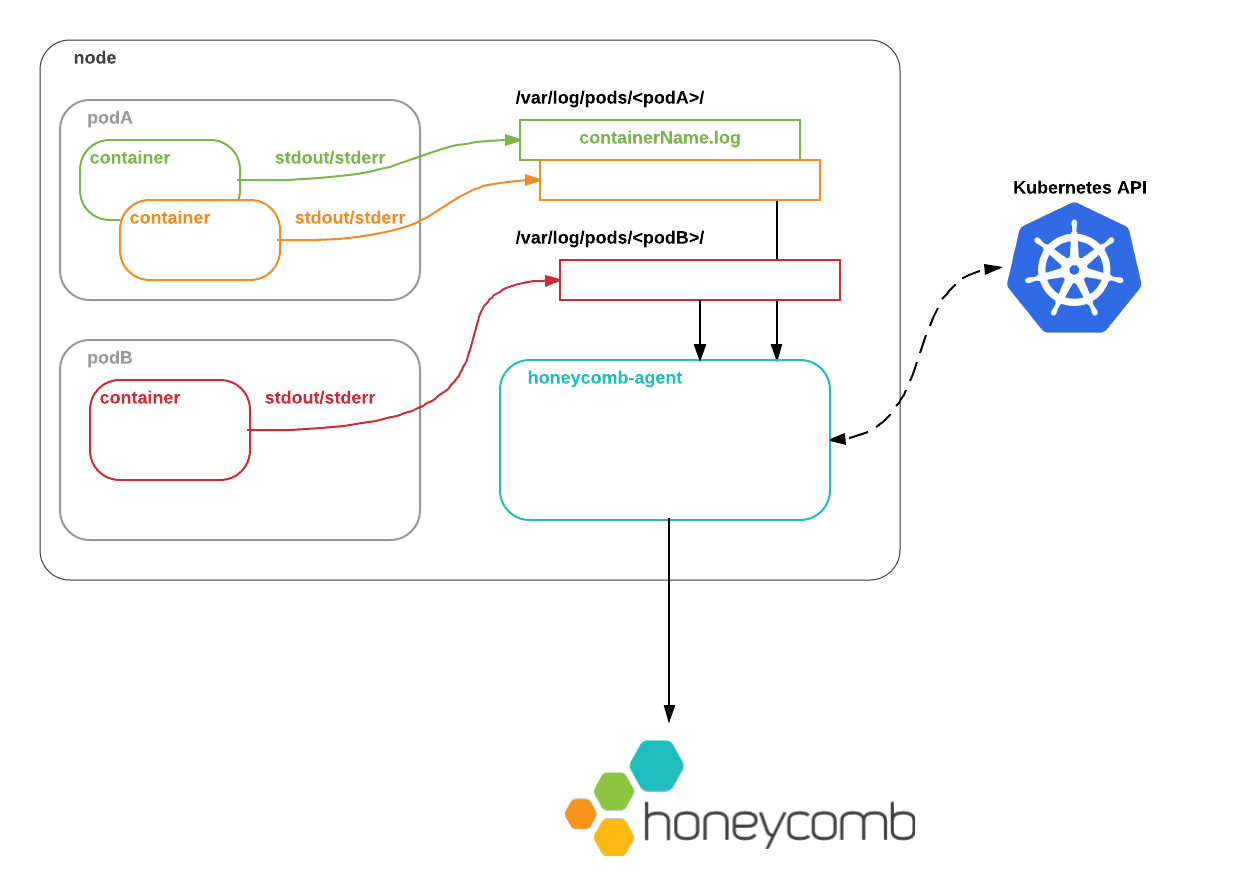
Instead of simply slurping up logs, the agent lets you define how logs from a particular pod should be handled, by leveraging Kubernetes’s labelSelector API.
This is important, because you’re likely to rely on third-party applications — such as reverse proxies, queues, or databases — whose log output you don’t fully control. A dumb logging pipe that can’t structure those logs won’t help you extract useful insights.
For example, to parse logs from an NGINX ingress controller labelled with k8s-app: nginx-ingress-controller, you could pass the following configuration to the agent:
watchers:
  - labelSelector: k8s-app=nginx-ingress-controller
    dataset: kubernetes-ingress
    parser: nginx
    processors:
      - request_shape:
field: requestThis tells the agent to consume logs from the ingress controller pods, parse them as NGINX logs, and additionally unpack the request field into its component parts. Finally, the agent will automatically augment each event with metadata about its state in the cluster. Thus, a log line such as…
192.168.147.0 - - [10/Jul/2017:22:10:24 +0000] "GET /api/v1/users?id=3409 HTTP/1.1" 200 1680 "-" "curl/7.38.0" "-"`
…becomes a fully contextualized JSON object like this:
{
  "Timestamp":"Mon Jul 10 22:10:24 UTC 2017",
  "bytes_sent":1680,
  "http_user_agent":"curl/7.38.0",
  "remote_addr":"192.168.147.0",
  "request":"GET /api/v1/users?id=3409 HTTP/1.1",
  "request_method": "GET",
  "request_uri": "/api/v1/users?id=3409",
  "request_path": "/api/v1/users",
  "request_query": "?id=3409",
  "request_shape": "/api/v1/users?id=?",
  "status": 200,
  "kubernetes.container.image": "nginx:1.7.9",
  "kubernetes.container.resources.requests.cpu": "100m",
  "kubernetes.pod.UID":"c5e99aa7-65bb-11e7-9d99-02fdde876ec8",
  "kubernetes.pod.labels.k8s-app": "nginx-ingress-controller",
  "kubernetes.pod.name":"nginx-deployment-4234284026-58vp5",
  "kubernetes.pod.namespace":"kube-system",
  "kubernetes.pod.nodeName":"ip-10-0-17-56.us-west-2.compute.internal",
  "kubernetes.pod.serviceAccountName":"default",
  "kubernetes.pod.subdomain":"",
  ...
}This makes it possible to follow an investigation across different layers of your architecture, instead of being constrained by cluster-level or application-level metrics:
- What does latency look like for a particular customers’ requests?
- How about on a particular container image?
- For a particular customer and on a particular container image?
And so on.
The promise of infrastructure as code
Finally, we’re thrilled that the agent is available as a ksonnet mixin. We feel that walls of YAML don’t quite fulfill the promise of infrastructure as code. But ksonnet makes it easy to use the agent flexibly.
For example, instead of deploying the agent as a DaemonSet, you might want to add the Honeycomb agent as a sidecar in an existing deployment, in order to watch log files at a particular path. Ksonnet makes it easy to compose the agent with an existing deployment:
local appWithHoneycomb =
  honeycomb.app.deploymentBuilder.fromDeployment(existingDeployment, config) +
honeycomb.app.deploymentBuilder.configureForPodLogs(config);Similarly, ksonnet makes it straightforward to deploy similar configurations of the agent across test, staging, and production clusters, without writing tons of boilerplate. The fine folks at Heptio have written in depth about how the design and application of the ksonnet mixin. Head over there and read more about it.
We believe that users deserve flexible, composable tools for operating and understanding applications on Kubernetes. It’s clear that ksonnet is delivering on that promise, and we’re excited to be early participants.
Give it a try
Have a Kubernetes cluster? Have questions about what it’s doing? Sign up for a free Honeycomb trial account and follow the two-step guide to getting started. Let us know if you have any troubles (or if you don’t).
Want to know more?
Talk to our team to arrange a custom demo or for help finding the right plan.