Honeycomb Triggers – Alert on your Data
We’re happy to announce the launch of Honeycomb Triggers—a method to get notifications when the data you send in to Honeycomb crosses configured thresholds. We’d like to show off how to use Triggers with…

By: Ben Hartshorne

We’re happy to announce the launch of Honeycomb Triggers—a method to get notifications when the data you send in to Honeycomb crosses configured thresholds. We’d like to show off how to use Triggers with a practical example. Check out the docs for more a conventional description of how to use them.
We have a scheduled job that submits an event to Honeycomb and then attempts to read it back from the UI. This end to end (e2e) check catches overall problems that individual checks might miss. The job submits a report of its success (or failure) to our dogfooding Honeycomb cluster. Let’s set up a Trigger that will notify us when the e2e check detects failures.
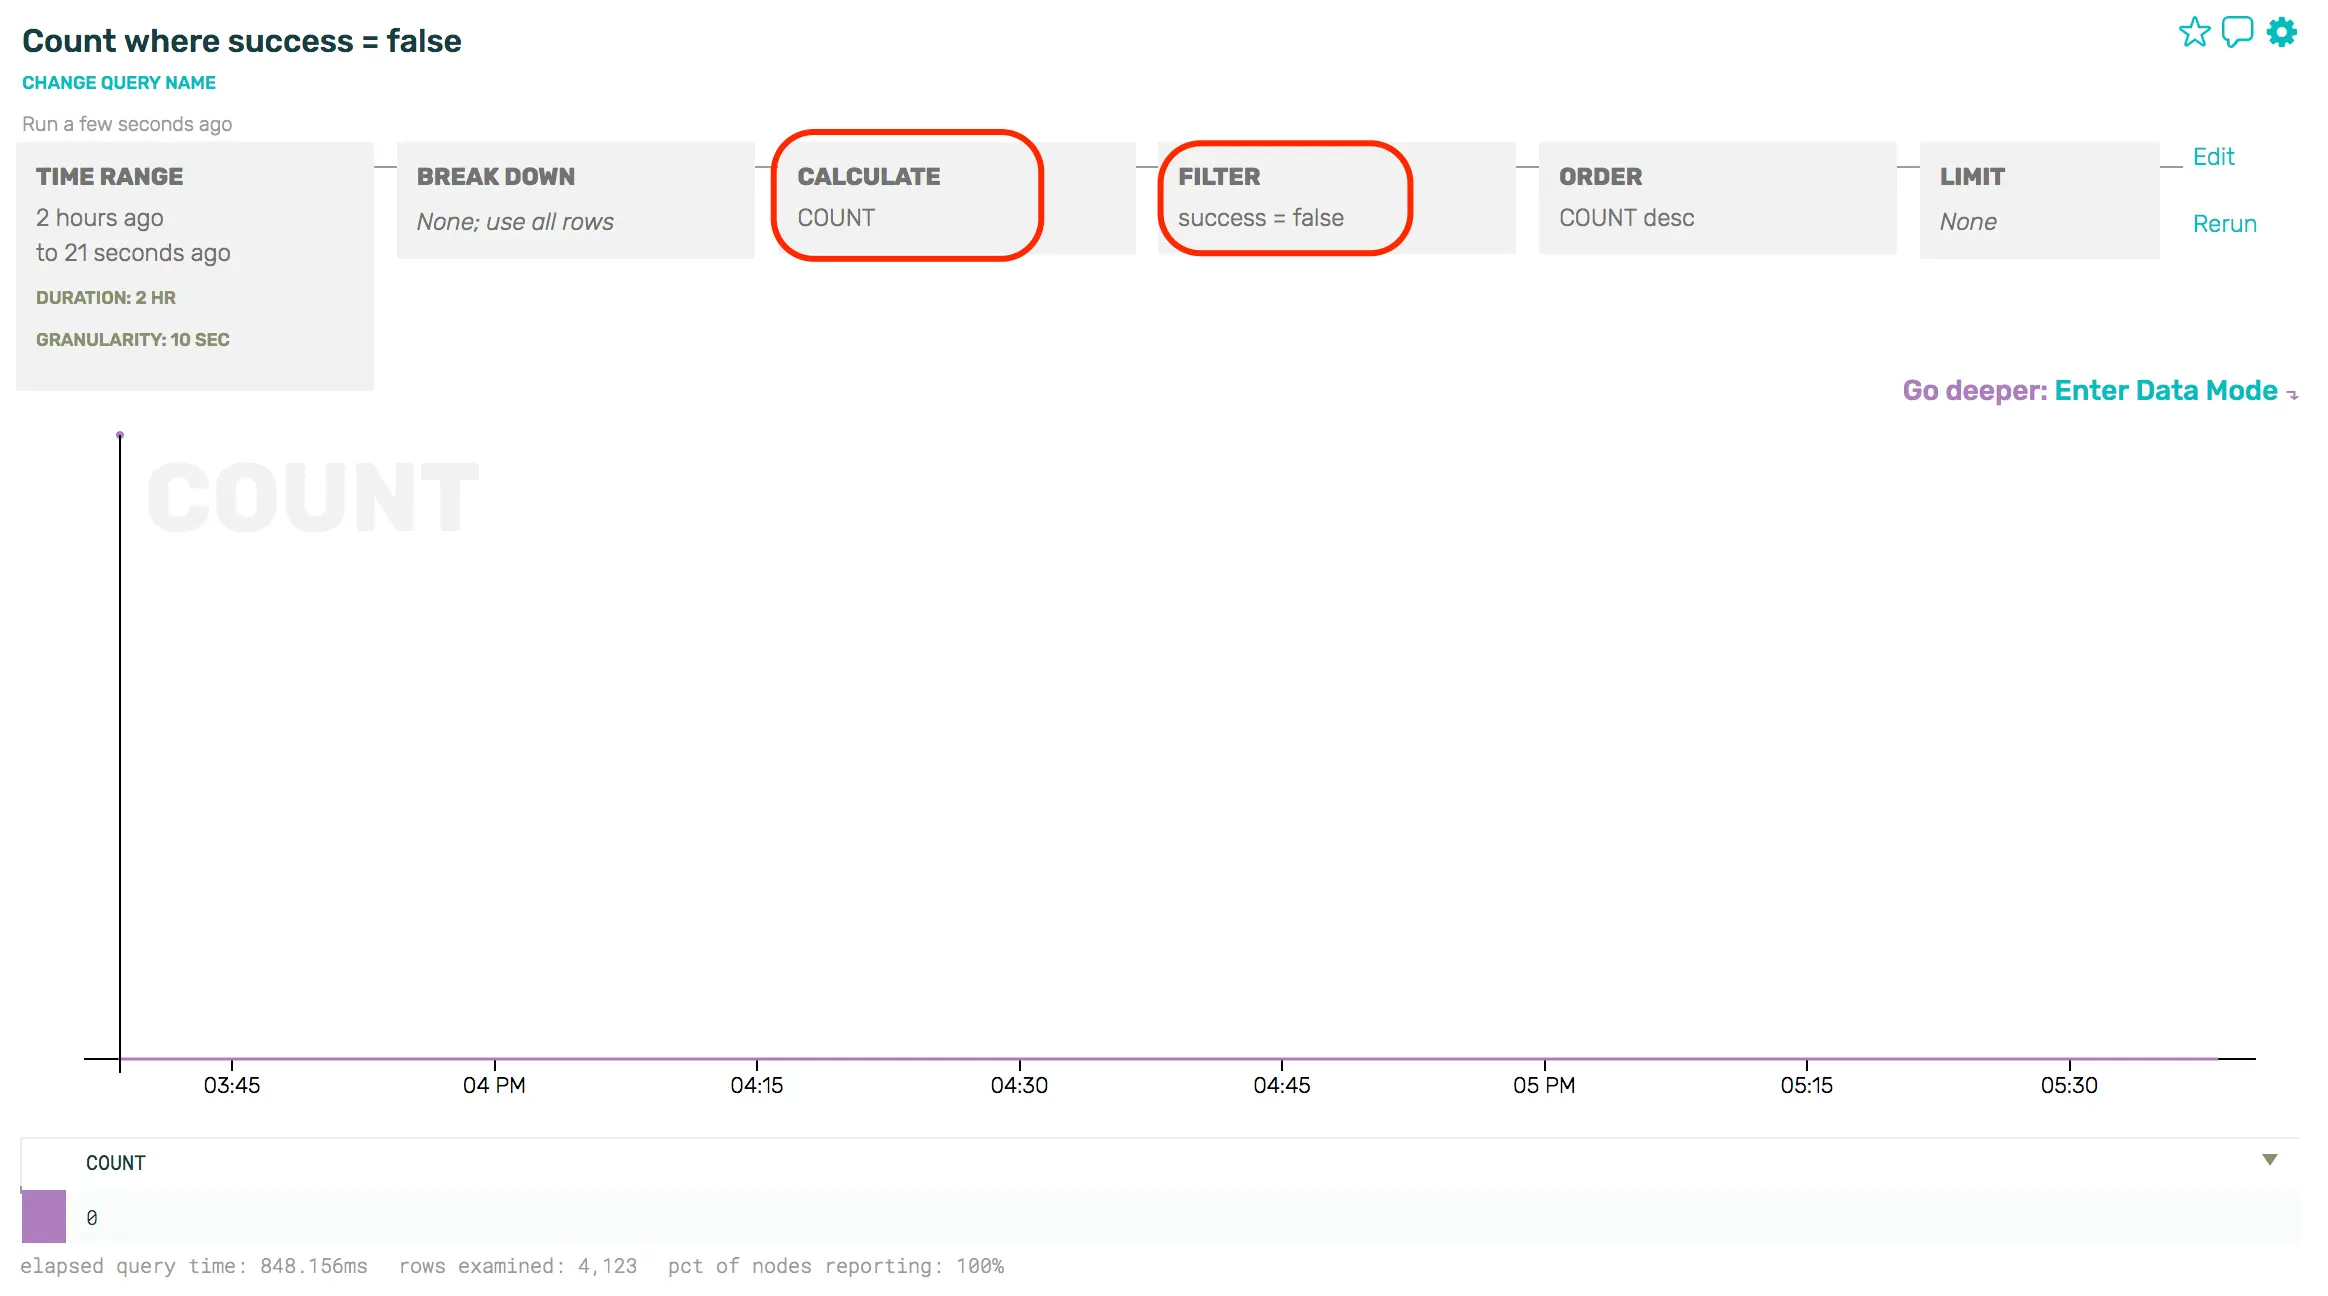
Our first step is to build a query in Honeycomb that represents the data on which we wish to alert. In this case, I want to see a COUNT of how many events were sent where the success field is false. It’s a rather boring graph at the moment – no failures to report.

From the Gear menu, we’ll choose “Make Trigger”.

On the Trigger creation page, we get a chance to name the Trigger and provide some text that will help whomever receives this alert. It’s a great idea to put links to the runbook for this failure in the description of the Trigger.
In addition to the name and description, you specify a threshold. For this example, we want to know if there are any failures.

We can send notifications to email, Pagerduty, and Slack. When you get pinged, you’ll be able to click back through to Honeycomb to see what happened. This is where the Honeycomb trigger starts to shine—though the trigger threshold was set to fire upon any failure, we can immediately change the query we’re looking at to show which shard is causing the failure, see whether it’s failing entirely or just slowing down, and so on. When we find what looks like the cause, we can flip to see the raw rows representing each individual test.
In this example, glancing at the raw rows makes it obvious that the trouble is with shard 8 and the write duration of 30s is suspiciously similar to our default timeout for writes. Further investigation is jumped forward several steps from just “the end to end check is failing” to “look at the write path for shard 8”—this kind of extra detail drops the time to resolution for our outage by an order of magnitude.

Sleep easy, knowing that when your service has any problems, Honeycomb Triggers will let you know. Give it a try!
Want to know more?
Talk to our team to arrange a custom demo or for help finding the right plan.