How Honeycomb Uses Honeycomb, Part 2: Migrating API Versions
Continued from How Honeycomb Uses Honeycomb, Part 1: The Long Tail. We recently released a new version of our API. As scarred veterans of building and supporting APIs, we made sure to retain backwards…

By: Ben Hartshorne

Continued from How Honeycomb Uses Honeycomb, Part 1: The Long Tail.
We recently released a new version of our API. As scarred veterans of building and supporting APIs, we made sure to retain backwards compatibility. Our code paths are versioned, but we’ve also versioned our docs to match. These things are good for developers even though they come at a cost — it takes time and effort to make sure that things continue to work.
We have a strong interest in encouraging our customers to upgrade to the new API, especially at such an early stage, when we are shipping radical improvements almost every day.
One of the fields that we include with every event we send in to our dogfooding cluster is the User-Agent string provided by the client. Most of our libraries put useful information in the User-Agent field for later consumption, but few folks think of it immediately as something worth indexing by.
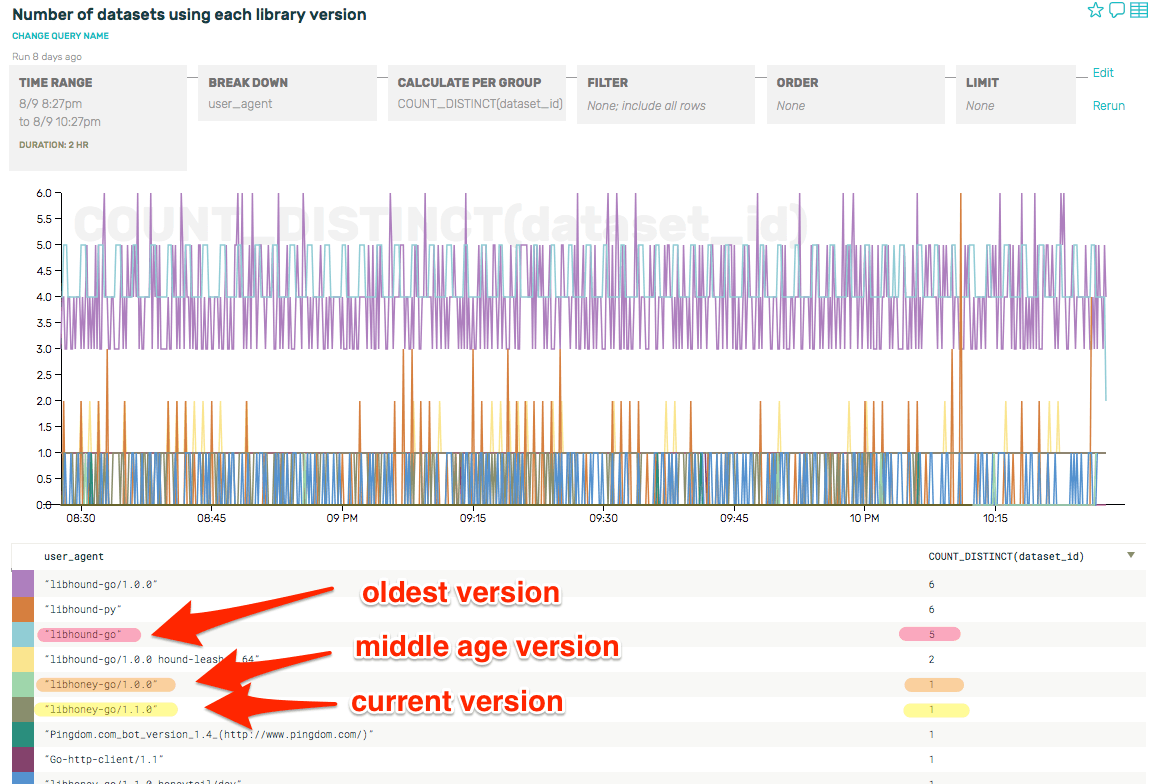
Let’s find out how many datasets are representing each version of our client library, by setting up a query to track unique User-Agents and seeing how many datasets were associated with the distinct User-Agent values:

We can quickly see that there’s only one client using the current version, one client using the previous “older” version, and 5 clients using the oldest version. This is clearly something we should work on fixing. But who should we talk to first? The number of datasets using each version is not a good indication of the importance of each one, as someone sending tons of traffic will have more of an impact that someone with just a trickle of traffic.
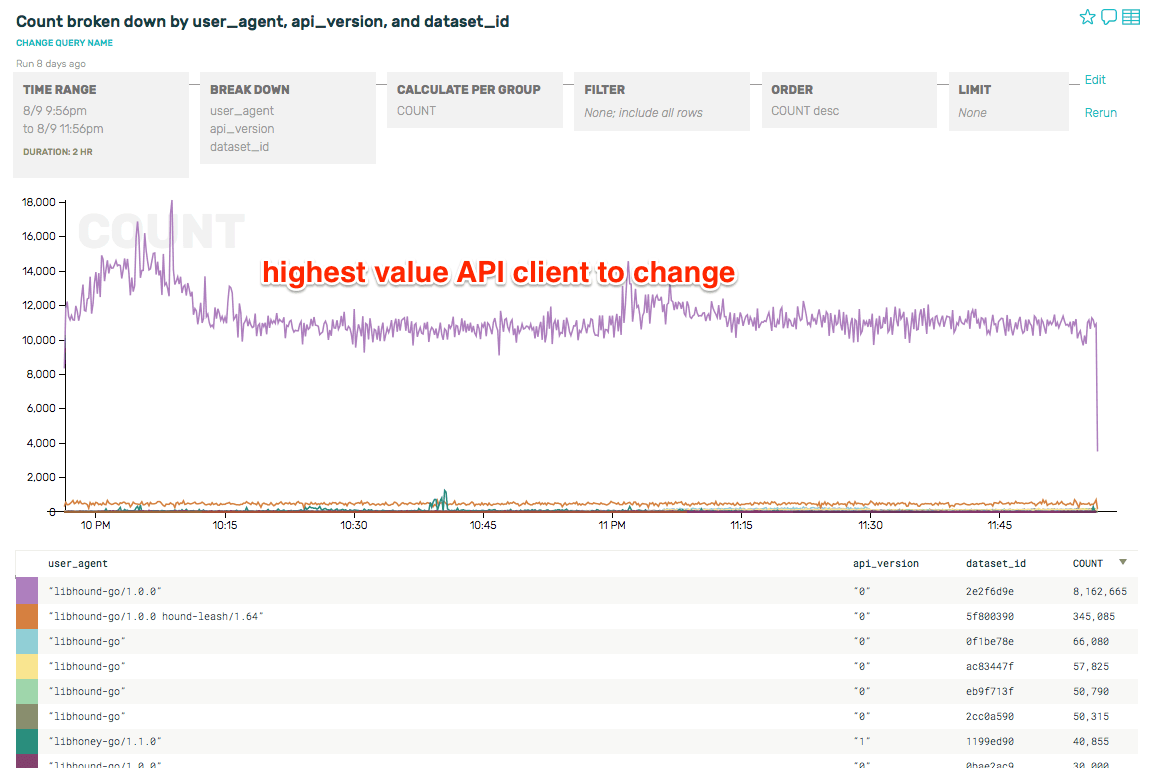
Let’s ask for the same breakdown, but by traffic volume instead of the number of datasets:

There is one clear candidate to chase down first, and a strong second place finisher. After that, there are a number of clients that should convert, and after that the long tail that has much less impact.
If you have a strictly limited set of fields you can aggregate on, as with many time-series column stores, User-Agentis usually not one of those few precious fields. But with Honeycomb, where you aggregate on anything and everything, it suddenly proves its worth.
As progress drives on you may have many, many versions in the wild. Honeycomb lets you break down any arbitrary number of versions combined with volume + other factors, displaying segments of customers to nag, beg, encourage, and finally deprecate or limit if they have fallen too far behind for you to support.
We’ve all been in the position of needing to urge customers to upgrade their clients. With Honeycomb, you could also bolster your arguments by comparing performance, error rates, etc for each of the older versions versus the new and improved release.

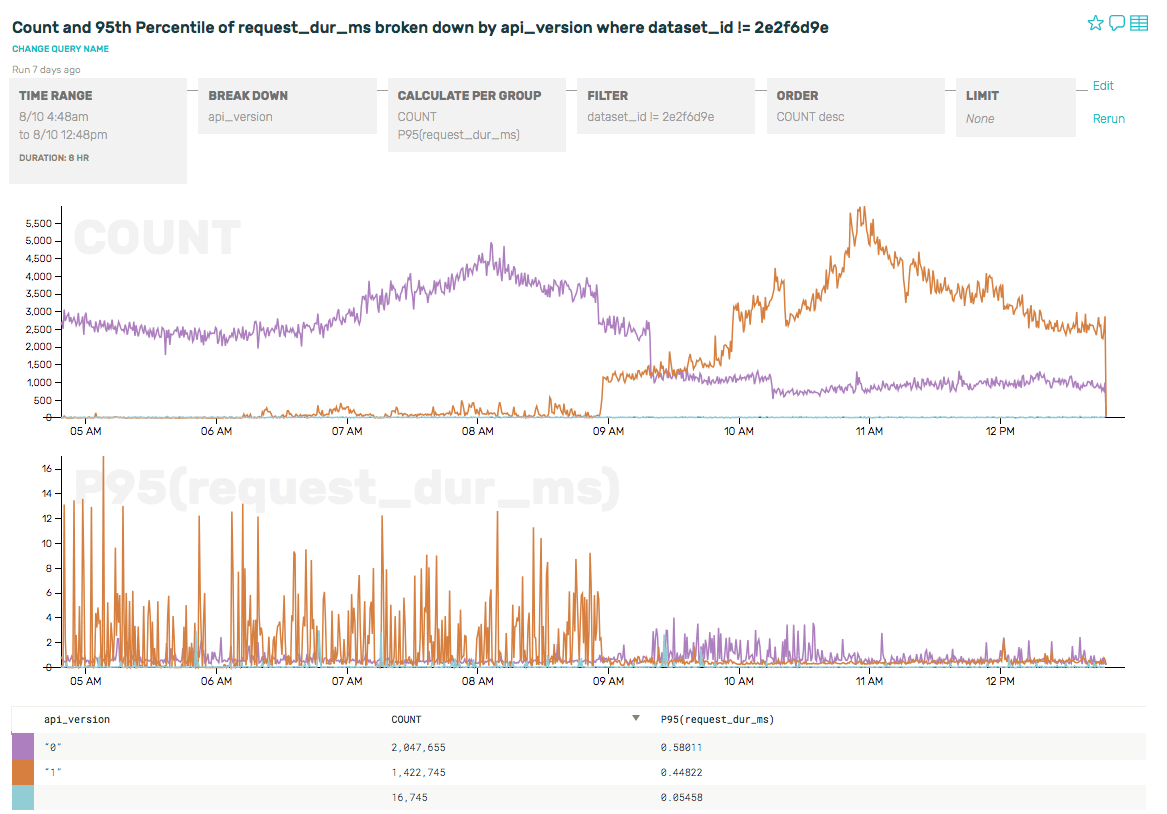
When the high value client we found above actually did the cutover, watching the traffic switch from one version to another made for a very pretty graph. 🙂
Happy metric-ing!
This is another installation in a series of dogfooding posts showing how and why we think Honeycomb is the future of systems observability. Stay tuned for more!
Get Started!
Sign up to try Honeycomb for free!
Want to know more?
Talk to our team to arrange a custom demo or for help finding the right plan.