Incident Report: Investigating an Incident That’s Already Resolved
Summary On the 23rd of April, we discovered that an incident had occurred approximately one week earlier. On April 16, for approximately 1.5 hours we rejected approximately 10% of event traffic to our API…

By: Martin Holman
Summary
On the 23rd of April, we discovered that an incident had occurred approximately one week earlier. On April 16, for approximately 1.5 hours we rejected approximately 10% of event traffic to our API hosts. Four of our API servers rejected all traffic with either a 500 or 401 HTTP response. The incident went unnoticed for around a week until a customer brought this to our attention enquiring about data they were missing.

Roads? Where we’re going we don’t need… roads!
What? How is this possible? We didn’t know if a broader incident was happening or if this was an isolated occurrence. We initiated a major incident and began investigating. Due to a sufficient data-retention policy, we were able to look back in time over a week in our datasets to determine what exactly happened and what impact it had.
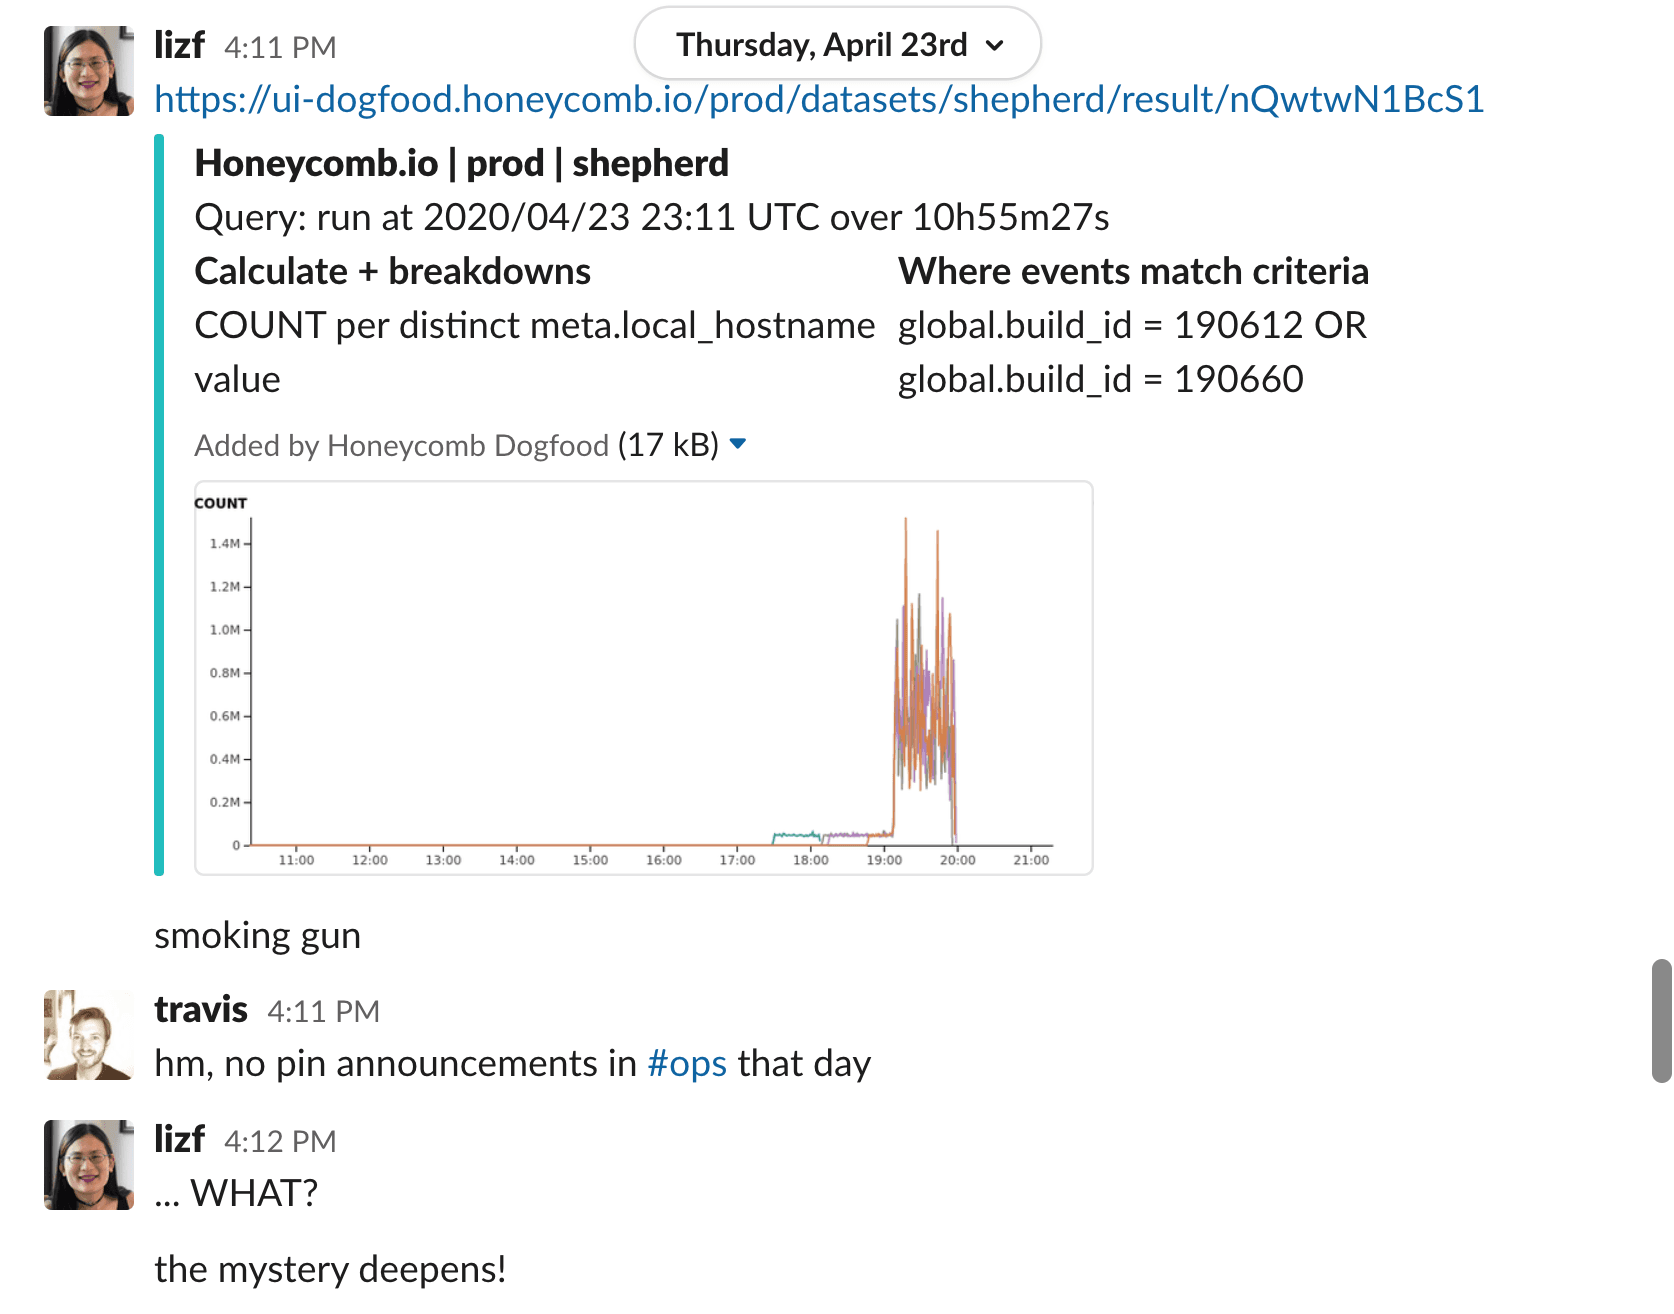
Our investigation uncovered that four of our API hosts were only responding with either a 401 or 500 response during this time. Our alerting didn’t trigger, since our SLI did not cover 401 responses. Previously, 401 errors were a regular enough occurrence that they were considered background noise and a failure mode where 100% of host responses were 401 errors had never been encountered. Typically, 401 errors don’t generate enough of a good signal-to-noise ratio that they help us detect issues on our side.
The Problem
On April 16, we initiated a database migration that was not applied immediately. Normally, our automated deploy process will pause deployments when a migration is pending. However, in this case, a new deployment was still somehow published. Having a newly deployed binary meant that any new hosts created as part of an autoscaling group would get the new build.
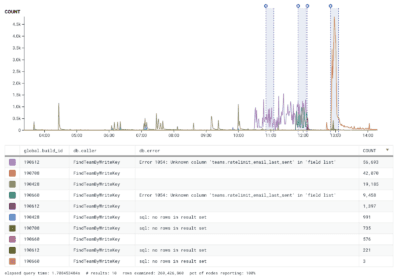
Once these new hosts spun up, they attempted to query for new API keys to authenticate incoming traffic. Outgoing queries from this new build contained a new column that’s supposed to be created via a database migration–the one that had not run yet. These new hosts requested a column that didn’t exist, so a 500 error got thrown on the first attempt.
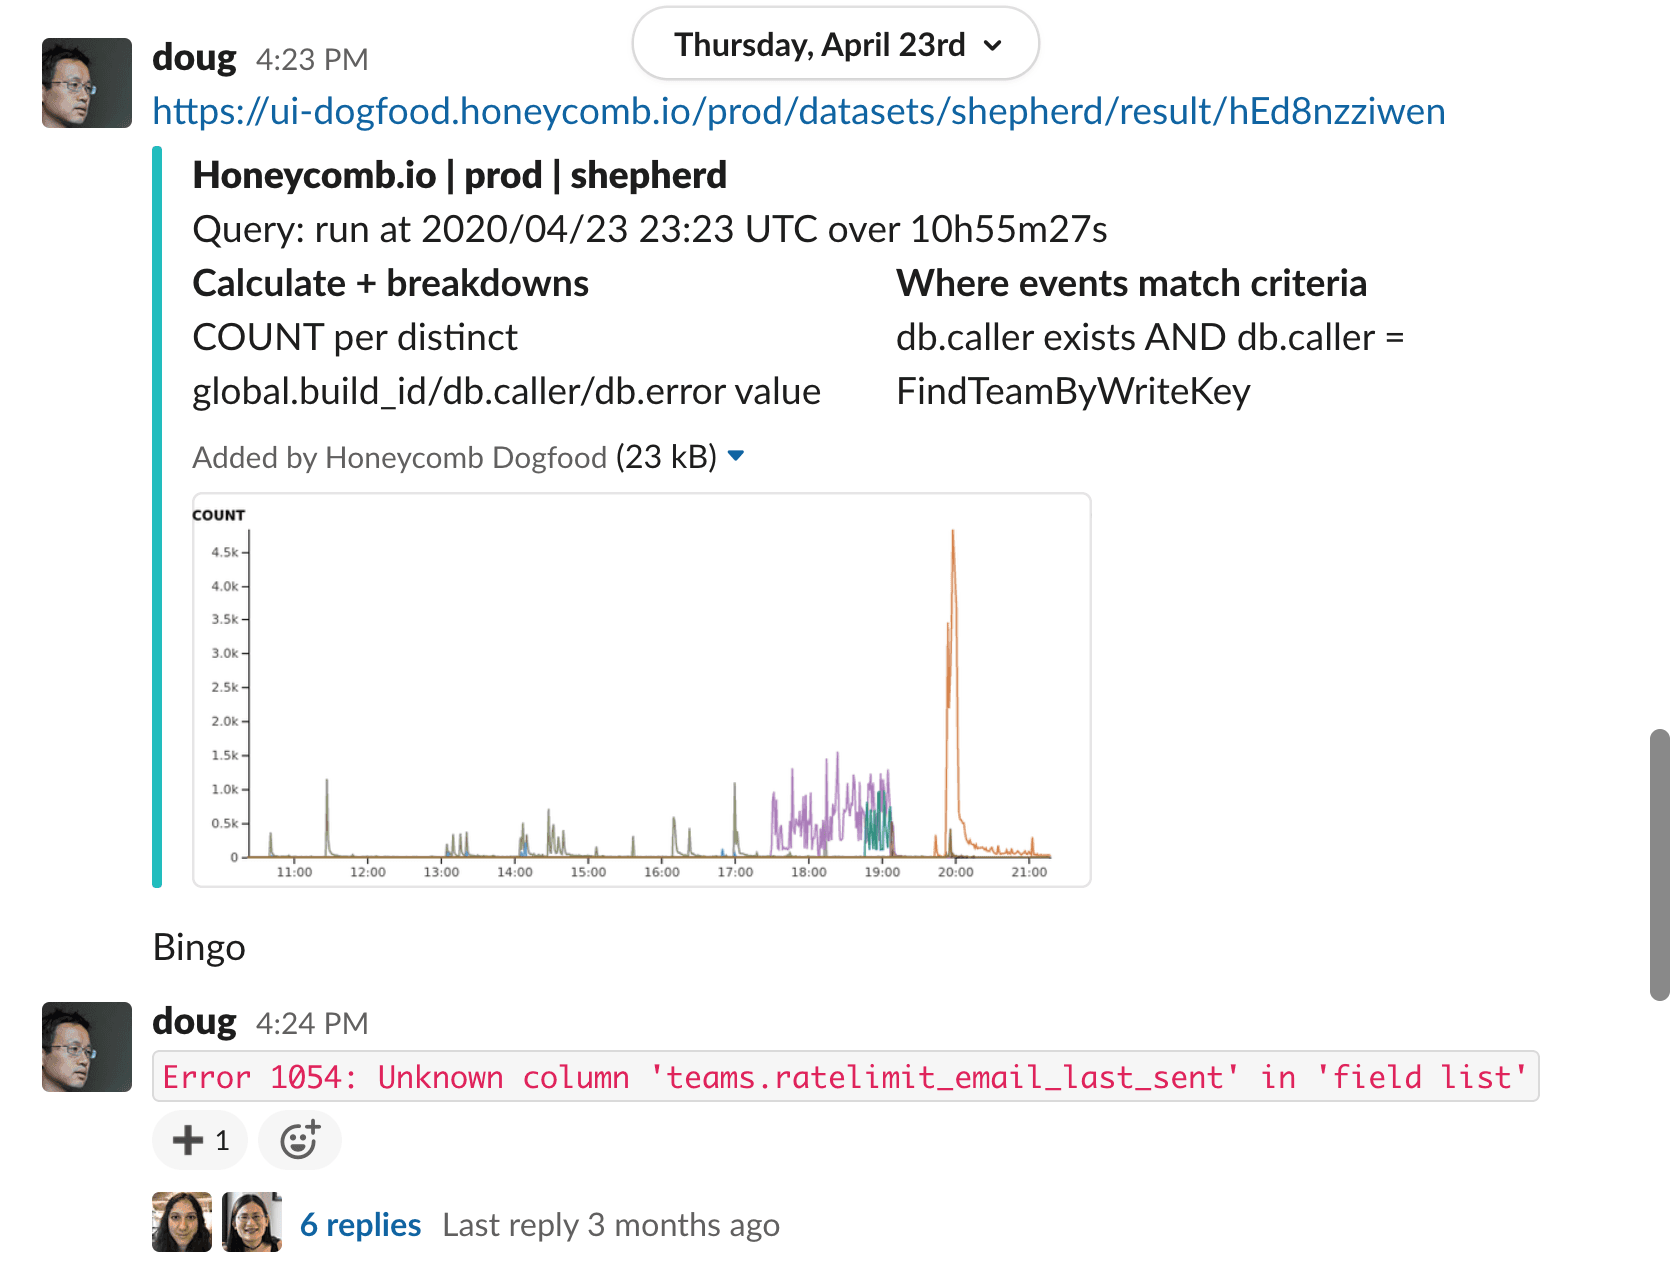
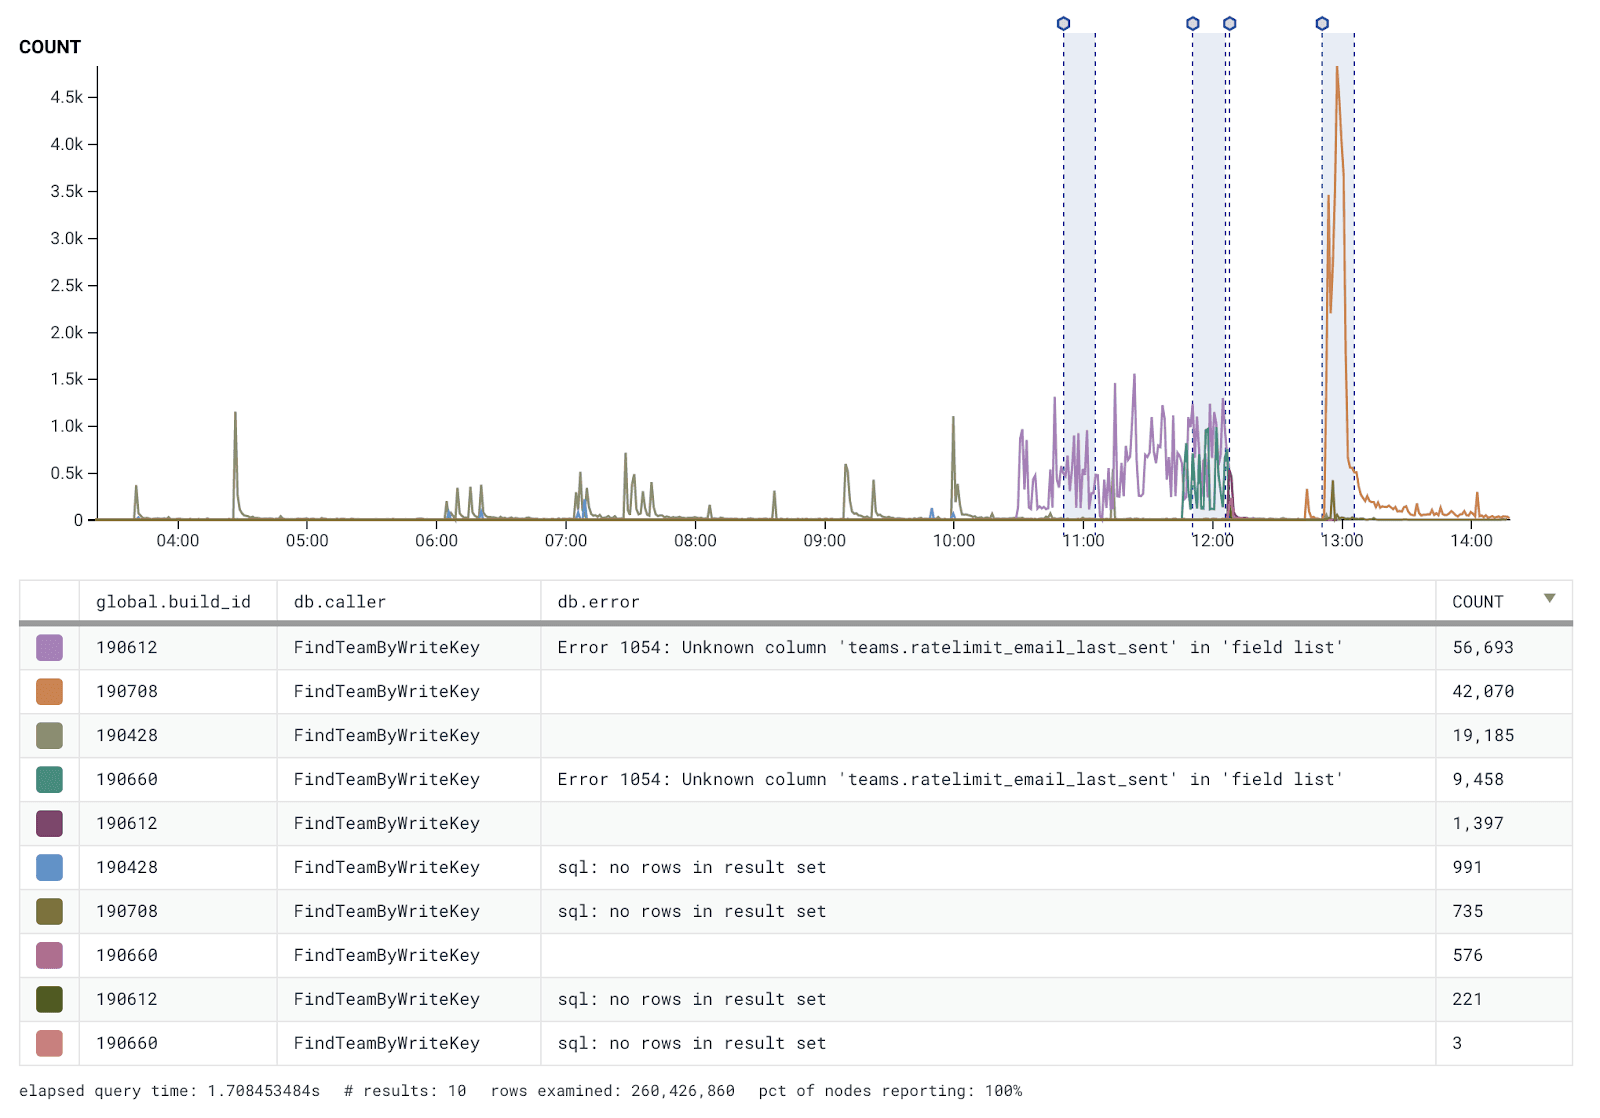
A small number of 500 errors occurred due to the database rejecting bad requests. However, because only four new hosts spun up during this time, the volume of 500 errors wasn’t enough to trigger any of our self-healing mechanisms.
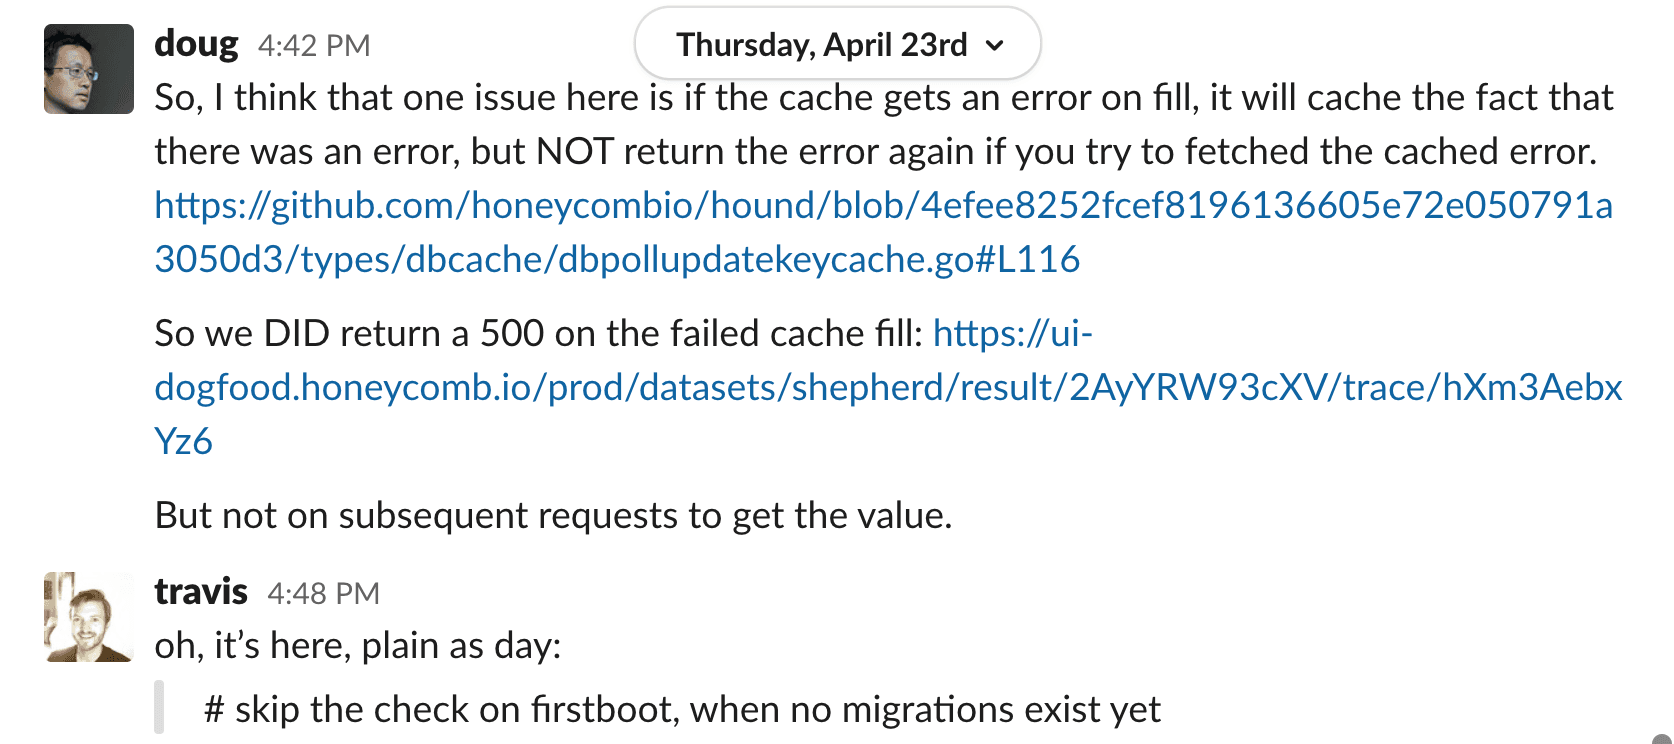
Then an expected behavior was triggered. After the initial bad request, the hosts wait for a retry interval. After the interval, the caching mechanism we use to store API keys would still not have the needed key. What we expected was to see the cache return a null error. However, the cache returned null responses with no error. The cache returned a null value from having failed the query, but it wasn’t considered an error. That gave the new hosts a null key and caused them to return 401 responses, as the API key was missing.

These hosts continued to generate 401 errors until the database migration applied. Once the migration was complete, the new hosts were able to query the database again. This allowed them to retrieve the correct API key, authenticate requests, and start serving traffic again.
The error automatically resolved itself.
Things that went well
Although this incident wasn’t discovered as it was happening, we were able to fully investigate a week-old issue and quickly diagnose what had occurred because we had all the data we needed. The incident occurred well within our 60-day data retention period.
We use deployment version as a column across all of our events, so it was quickly evident when an unexpected mismatch across some hosts occurred. We were able to identify problems by comparing hostname, deployment version, and http response (high-cardinality fields).
Things that could have been better
First and foremost, our SLO did not alert us of a potential problem. As intended, we use SLOs to measure user experience. We typically see 401’s as occasional blips that don’t indicate a poor user experience problem. However, in this case, our customers couldn’t use our service, so they do have an impact in certain cases. Had 401 errors been a part of our SLO at the time, we would have blown through 81.6% of our error budget during the incident.
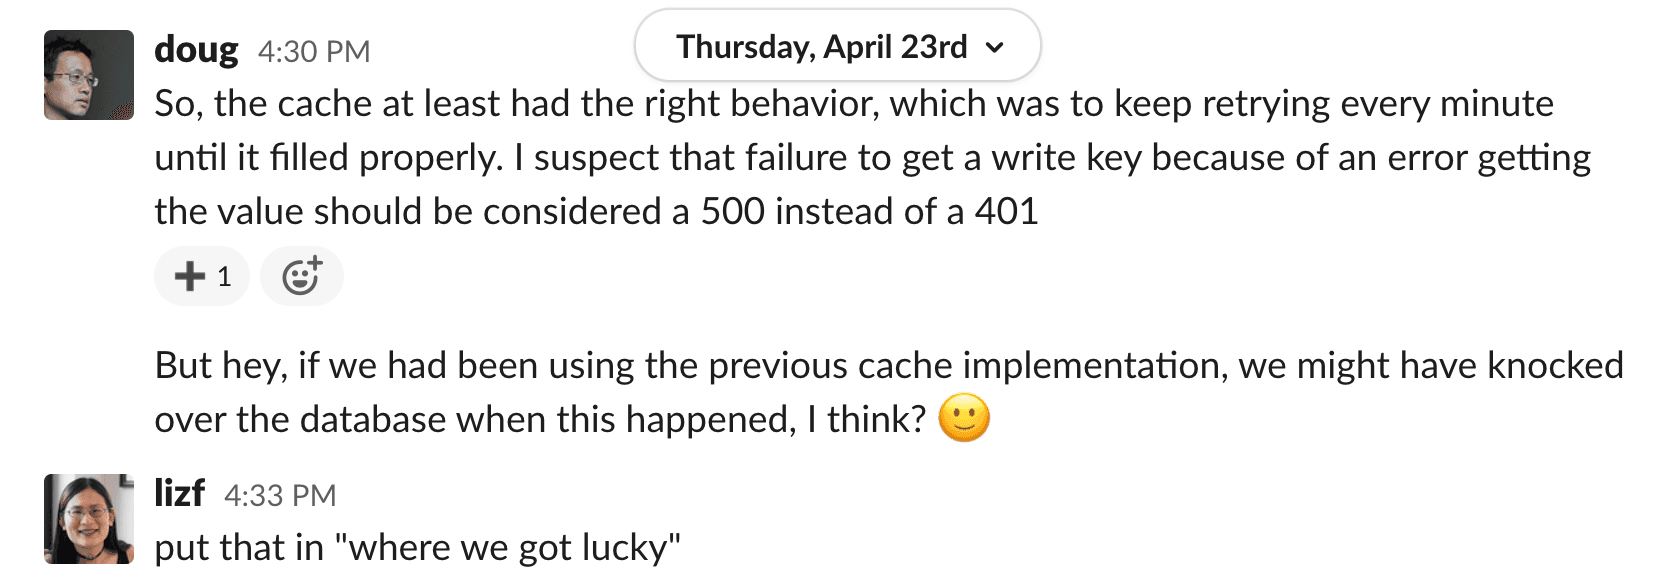
Our caching implementation cached a null value and did not report that as an error. While our retry and circuit breaker logic worked as intended by preventing the database from being hammered, it also hid a critical error that was occurring.
Things we changed

- We fixed our deployment process so that any new hosts that come up do not have an unexpected version deployed
- We also fixed caching mechanisms so that database errors are properly propagated.
Gotta get back in time
This incident was interesting because the underlying errors were particularly obscured. Modern systems are typically designed with automated remediations like load balancing, autoscaling, database failover, etc. Which means that systems can often heal themselves before the issues requiring remediation have been fully investigated. In some cases, those issues may never even come to the attention of the humans who would need to investigate or the discovery, like in our case, may not happen for many days after.
For these modern systems, it’s critical to be able to step back in time to examine the state of a system before, during, and after a failure for forensics to be useful. This is a good example of how observability paired with a long data-retention policy can help detect unseen problems and identify remediations, even after the incident is no longer occurring. Because we were able to zero in on a specific user’s experience, we could follow the trail of clues to uncover a hidden error that would have otherwise eluded detection.
Contact our sales team to find out how Honeycomb’s 60 days of retention can help you learn from incidents and improve your system resilience.
Want to know more?
Talk to our team to arrange a custom demo or for help finding the right plan.