Tame Your Telemetry: Introducing the Honeycomb Telemetry Pipeline
Observability means you know what’s happening in your software systems, because they tell you. They tell you with telemetry: data emitted just for the people developing and operating the software. You already have telemetry–every log is a data point about something that happened. Structured logs or trace spans are even better, containing many pieces of data correlated in the same record. But you want to start from what you have, then improve it as you improve the software.

The Bridge From Observability 1.0 to Observability 2.0 Is Made Up of Logs, Not Metrics
Learn MoreObservability means you know what’s happening in your software systems, because they tell you. They tell you with telemetry: data emitted just for the people developing and operating the software. You already have telemetry–every log is a data point about something that happened. Structured logs or trace spans are even better, containing many pieces of data correlated in the same record. But you want to start from what you have, then improve it as you improve the software.
Honeycomb helps you derive more value from your existing telemetry data. Its unified storage puts all the data together, its unreasonably fast querying gives you access to all your data organized by every combination of fields, and its unique alerting and sharing features help all your teams work together.
However, not all telemetry is immediately of maximum value in Honeycomb queries. While Honeycomb’s datastore accepts any structured data, unstructured logs need to be structured; small logs need context added; and redundant data needs to be dropped or stored somewhere cheap. Honeycomb offers tools that make this work smooth and efficient.
The distance between a log statement and your understanding of the software is covered by Honeycomb and the Honeycomb Telemetry Pipeline.
What is the Honeycomb Telemetry Pipeline?
Your software creates log files, emits OpenTelemetry traces, or serves Prometheus metrics. The Telemetry Pipeline lies between here and Honeycomb’s datastore.
- Multiple OpenTelemetry agents (Collectors) processes scrape logs, receive OTLP (OpenTelemetry) data, and gather metrics. The Collector is built by the OpenTelemetry community. With the right configuration, it gathers, restructures, enhances, and filters telemetry. It sends data to both blob storage and onward toward Honeycomb.
- To run, configure, and update all necessary OpenTelemetry Collector processes, there is the Honeycomb Telemetry Pipeline Manager. This comes with configuration supporting many common log formats, and it lets you set up and then change the behavior of many OpenTelemetry Collectors. It shows you what’s happening in your pipeline and gives you fast feedback on changes in a clear, appealing user interface.
- Send the structured, standardized data from the Collector to Refinery, Honeycomb’s industry-leading dynamic sampler. Refinery drops redundant data, keeping the most interesting stories (all errors and slow requests), plus a representative selection of successful request processing. In case you find some important data was dropped, the Telemetry Pipeline Manager can bring it back from archives.
With this combination, you get maximum value from your telemetry, with the power of Honeycomb’s unlimited query engine, Service Level Objectives, shared boards and history, and more. You save money by filtering the telemetry you have, and by dropping redundant data—while retaining safe access to all data. You’re getting more than ever from the telemetry you have, and you’re supported in improving your telemetry for even more.
Honeycomb is a partner on your observability journey, and the Telemetry Pipeline smooths this journey for you.
How it works: Honeycomb Telemetry Pipeline Manager
The Manager starts up and monitors fleets of OpenTelemetry Collector agents. For instance, you might have a Collector on each EC2 instance you run, or each node in a Kubernetes cluster, plus one listening for cluster-wide events.
The Manager helps you configure the Collectors. It knows how to parse many common log sources. Its interface lets you create rules for filtering and transformation, in a purpose-built GUI that’s easier to get right than YAML. Even better, it shows you the future effect of the rules as you write them—on your own data. Then, it rolls the configuration out to all Collectors in the fleet.
All of this can be done by hand in YAML plus various infrastructure provisioning tools, but the Pipeline Manager brings it together, making each improvement safe, smooth, and auditable.
More detail: Data sources and destinations
Each OpenTelemetry Collector accepts data from multiple sources. Any services using OpenTelemetry can send it traces, metrics, and logs. At the same time, it can pick up log files and read them. The Pipeline Manager reveals each of these activities and tells you how much data is flowing through each source.
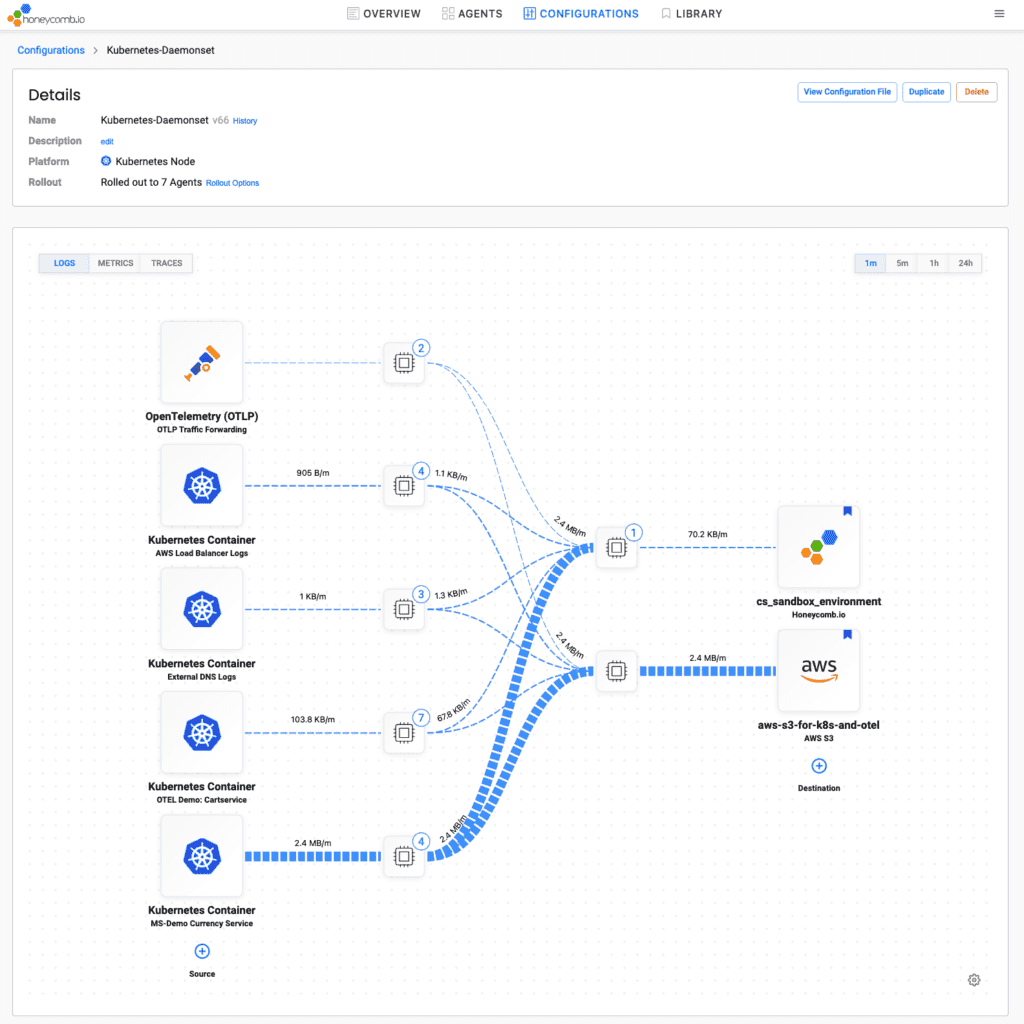
Each source’s data flows through its own processor, where logs are parsed, content is structured, and additional context is added. That context might include which service it came from and what node or server it runs on. The Manager comes with standard configuration for many common data sources.
Then, all data flows to each destination: your Honeycomb team and archival storage. Each destination has its own processor, where you filter the valuable data to send on to Honeycomb, and batch up all data for storage. Archival storage includes S3 and Azure Blob Storage.
More detail: Configuration
While the OpenTelemetry Collector is powerful in its abilities to filter and transform telemetry, that power comes with all the hazards of custom languages embedded in YAML. It’s easy to make a mistake, very hard to test, and tough to deploy uniformly. The Manager smooths all these challenges.
The configuration editor lets you write filter and transformation rules while showing their effect on real data sampled from your telemetry pipeline. Then, you can see the before-and-after change in configuration, choose to roll it out to your Collector fleet, and see how it affected your data flow.
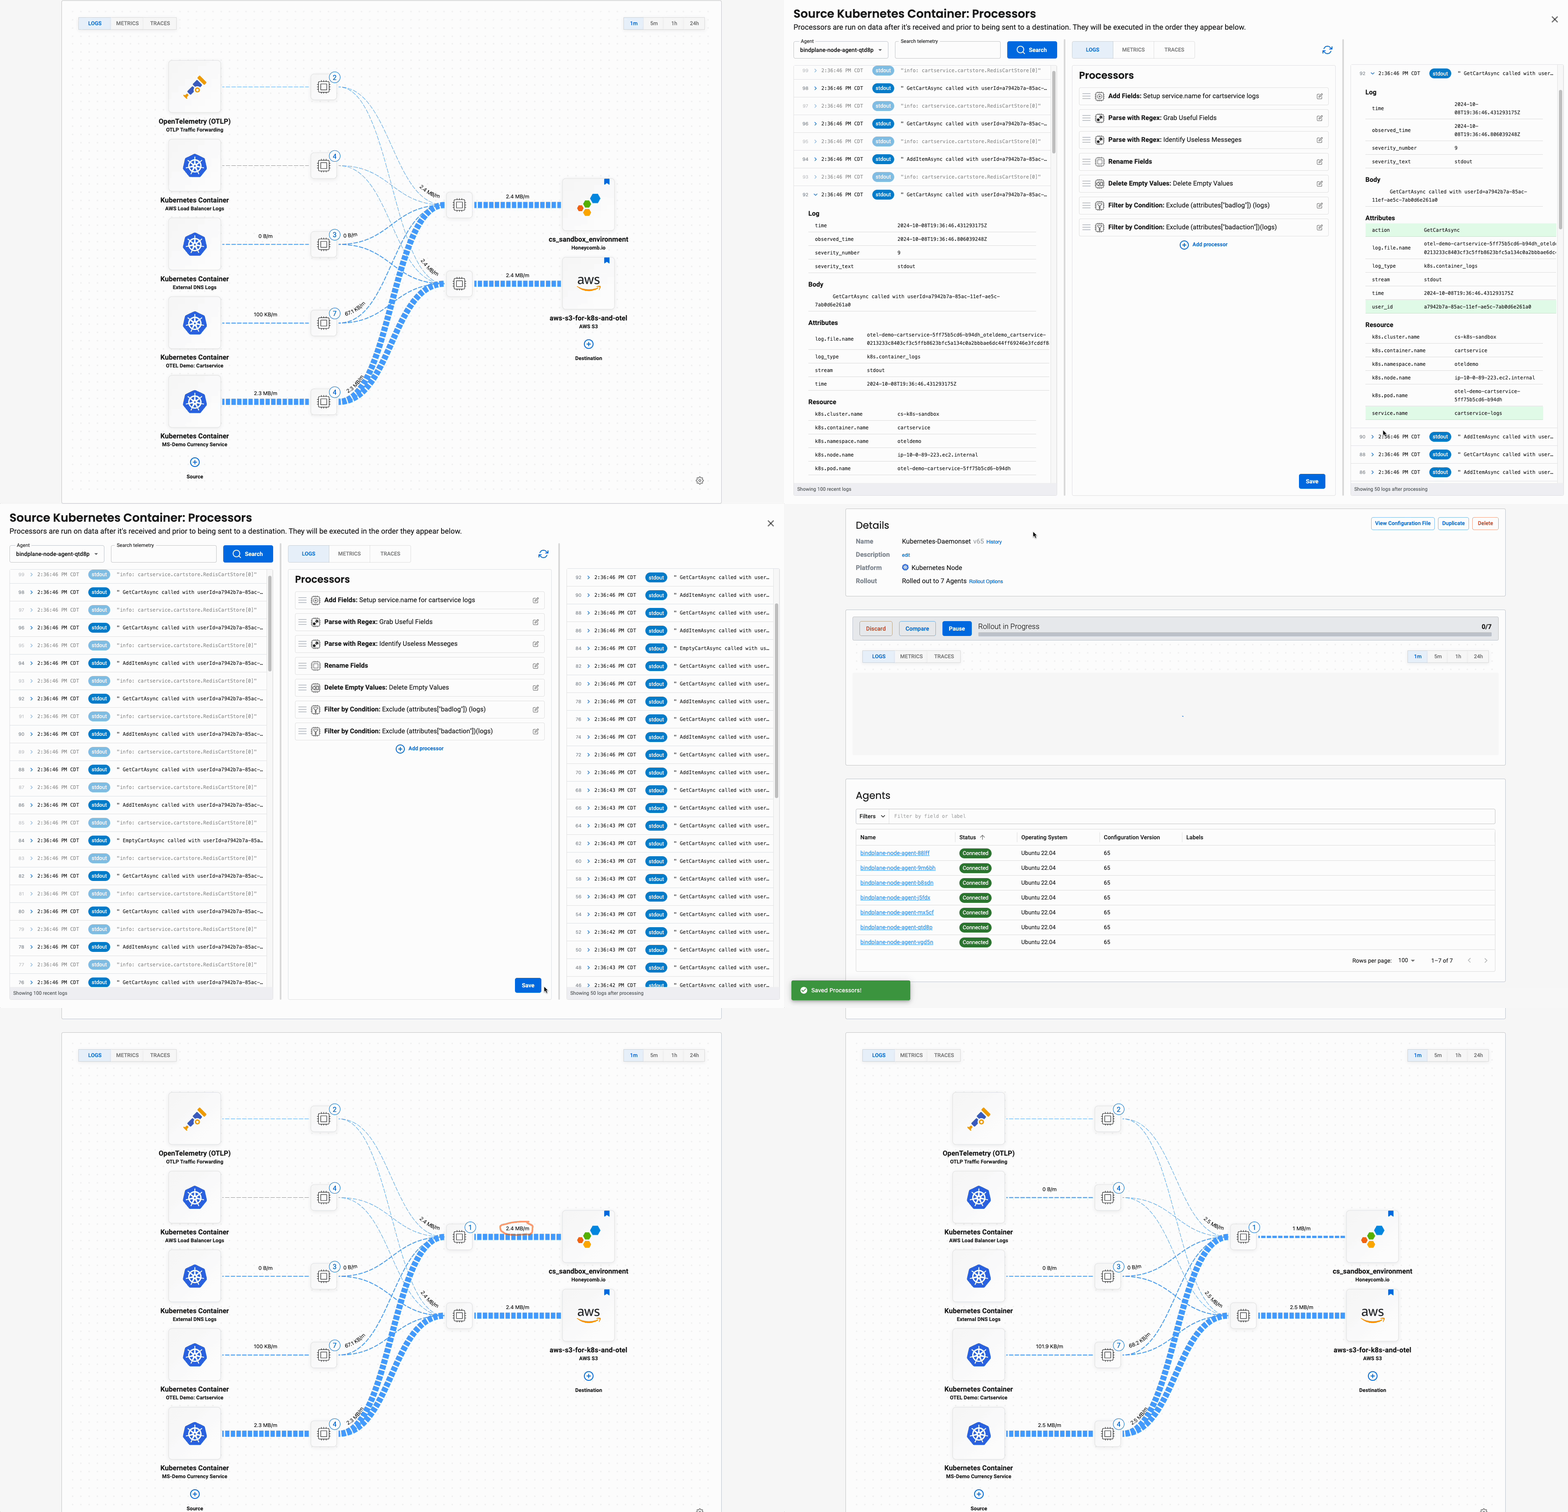
These configuration changes are tracked and auditable.
The Telemetry Pipeline Manager can also upgrade OpenTelemetry Collector binaries that are running on servers. To accomplish this, it deploys a special version of the OpenTelemetry Collector, with extensions that report back to the Manager for all these reports.
How it works: Sampling and rehydration
While the OpenTelemetry Collector can filter some low-value data, such as duplicate logs, more can be done with rich context. Honeycomb created Refinery, which gathers traces and logs, each describing the processing of a single customer request, and keeps the most interesting stories. Refinery can be configured to send a certain amount of Honeycomb events, choosing all the interesting ones, and balancing the rest among distinguishing fields. For instance: keep all errors and high-latency requests, while distributing the rest among different routes and regions. This is dynamic tail sampling.
Sampling like this gives you the shape of the forest—from the representative requests kept—and still lets you look at individual trees. You get the details of all the unhealthy requests, plus enough successful requests to compare them. This is how distributed tracing balances detail and rich context with cost. Sometimes, too much data is less information. Dynamic tail sampling optimizes the value of telemetry.
However, dropping data can be risky, because you might need a particular request that didn’t meet your configured standards for “interesting.” Or some filtered logs, usually low-value, might contain a clue in an unexpected situation. This is when you want the Manager’s rehydration feature.
In the Telemetry Pipeline Manager, you can choose a time range and move all records from archival storage into Honeycomb.
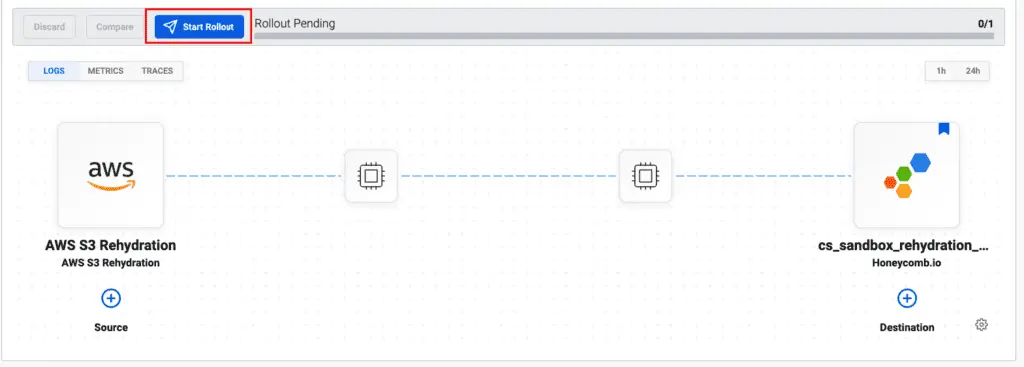
In this way, the Honeycomb Telemetry Pipeline gives you safety by retaining all records, and multiple ways to send the optimal telemetry to Honeycomb for unlimited querying. Data coming into the pipeline is priced per gigabyte; data stored in Honeycomb is priced per event for any number of custom fields, all queried and aggregated in a breath.
Honeycomb Telemetry Pipeline builds on top of open source standards and projects, including OpenTelemetry Collector and Refinery. Honeycomb has always accepted any structured data you send it, with dynamic schemas and instant fast querying. Most of the accomplishments of Honeycomb Telemetry Pipeline are possible with extensive configuration and infrastructure work, plus domain knowledge for the formats of common logs, and long feedback cycles of testing. Honeycomb Telemetry Pipeline Manager is here to smooth the road, get you to answers quickly, and support fast, safe, and accountable change.
Conclusion
Honeycomb is the observability platform that gives you the most information from your telemetry—from existing logs to OTLP traces and everything in between. Developers, SREs, product, and customer support—everyone benefits from unlimited graphs of application metrics generated on the fly from detailed telemetry data. This unified view, shared by all teams, provides one source of truth. Scale from the specifics of a single log to the customer value of a Service Level Objective in one data source and one product.
Honeycomb Telemetry Pipeline makes it easier than ever to get this value. You don’t need to have OpenTelemetry; get the most out of the logs you have. Meanwhile, Honeycomb is a partner in progress toward richer, more standard telemetry. It gives you unprecedented value now, and grows with you.
Your software encompasses more business complexity all the time. Support your teams with the best observability.
Get a personalized demo.
Want to know more?
Talk to our team to arrange a custom demo or for help finding the right plan.
