A unified, fast, and collaborative platform
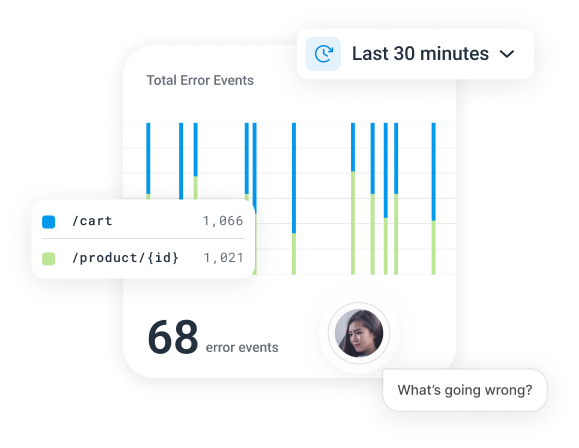
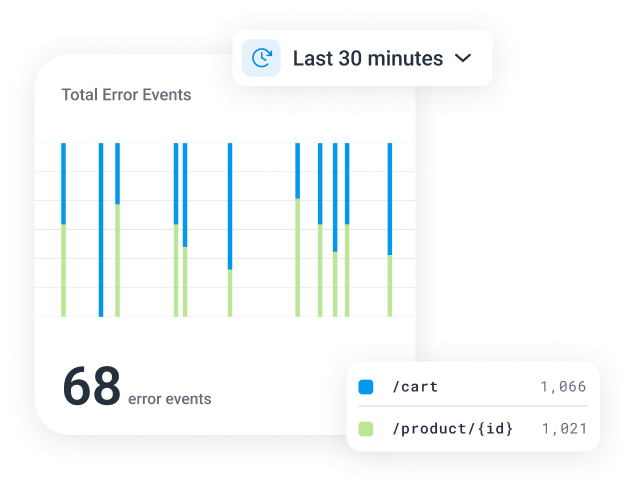
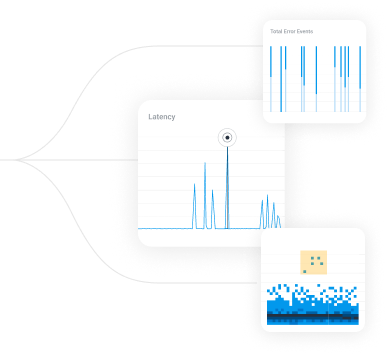
Honeycomb stores all of your telemetry signals in one place, giving you a single source of truth about what’s actually going on in production. Visualizations are dynamic and explorable, helping you find anomalies and correlations you didn’t know about.
WATCH A DEMO START FOR FREE

A smarter way to find answers
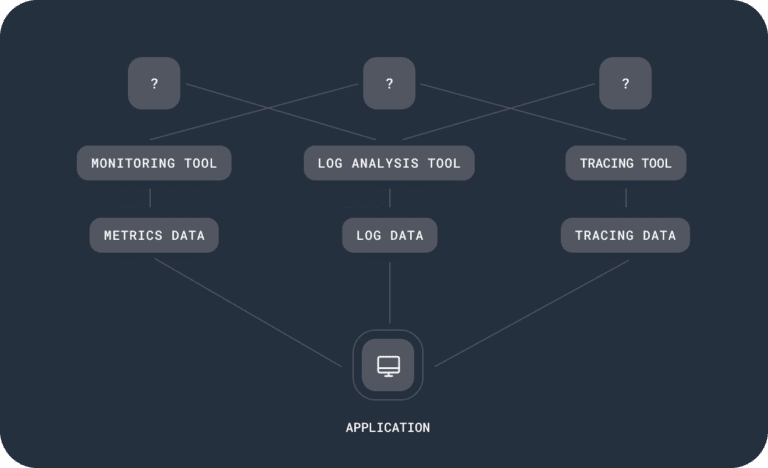
Traditional Monitoring Tools
Engineers use a suite of platforms across logs, metrics, and traces, sometimes from a single vendor. Lots of guessing, hard-fought answers. Extra data comes with extra costs. Slow, difficult, inefficient.
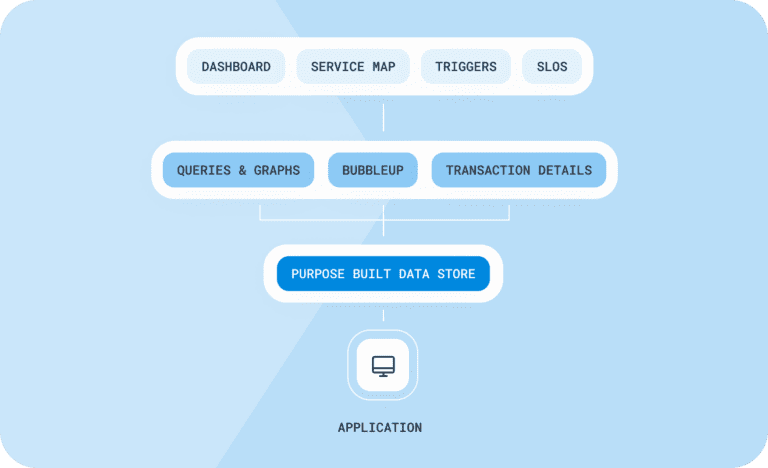
Observability with Honeycomb
Logs, metrics, and traces are unified into one dynamic platform. Engineers have visibility across teams, and down the stack. Issues are resolved before they do damage. Costs are streamlined and predictable.
One data source, everything you want to see
Move from the big picture to the most relevant details, from individual events to custom aggregations.
Events
Structured wide events are the building block of the Honeycomb platform. Logs, metrics, and traces can easily be viewed or derived from these wide events, giving you multiple ways to explore your data.
Metrics
The metrics and charts you know and love—now lit up with all the high-cardinality metadata you could want. Thanks to Honeycomb’s architecture, metrics become debuggable in a way you’ve only ever dreamed of.
Traces
Find interesting traces with Honeycomb’s uniquely powerful trace analytics, then see them in a waterfall view that tells you immediately what’s slow, what’s failing, and where to fix it.
Logs
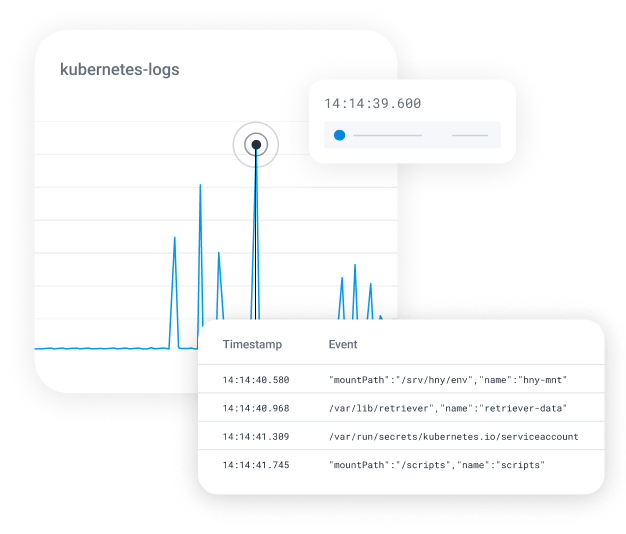
Got logs? Us, too. Start with the logs you have, but get more out of them with Honeycomb. Our powerful query engine means you can analyze your logs super fast, and dissect any chart or visualization by exploring its underlying data.
End-to-end observability
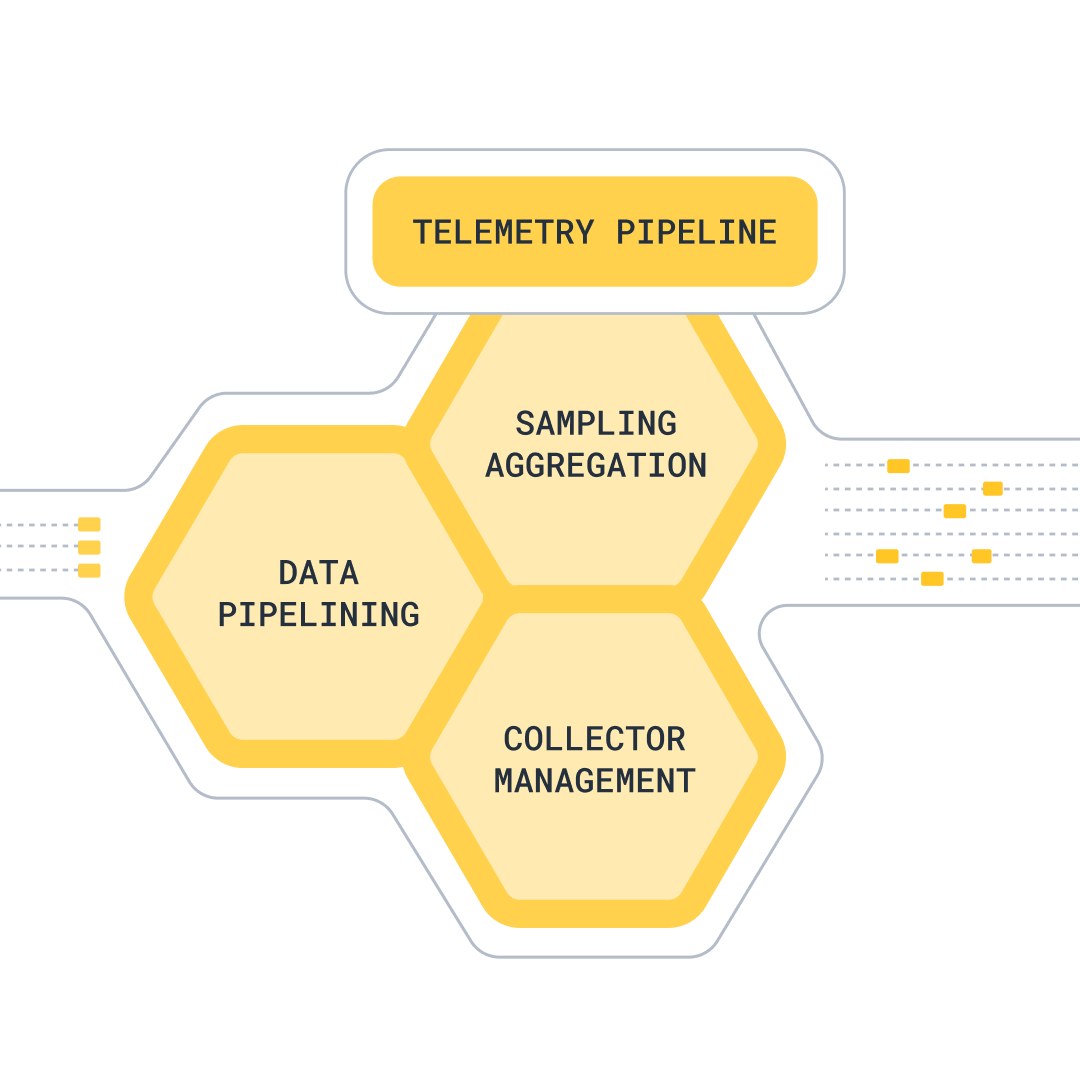
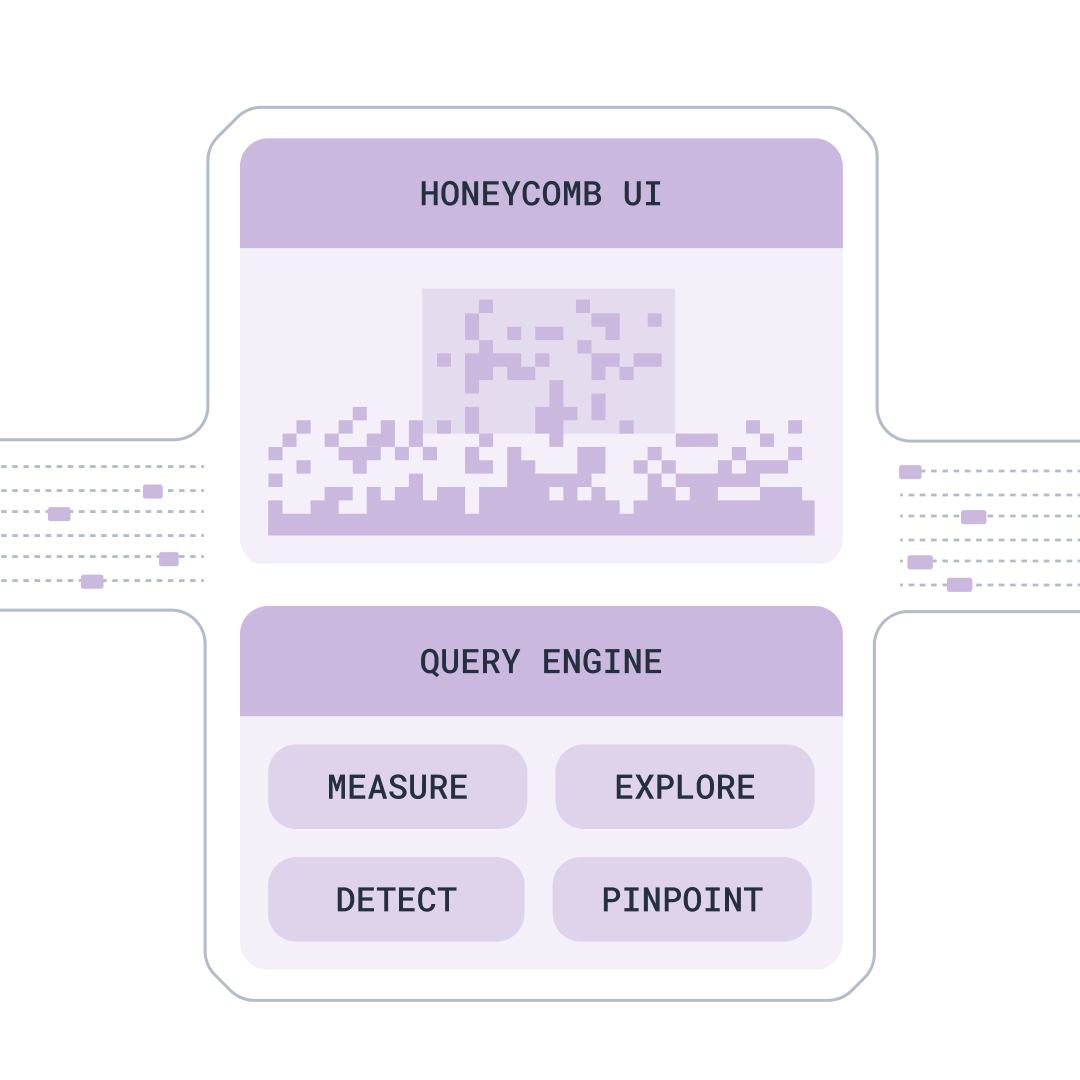
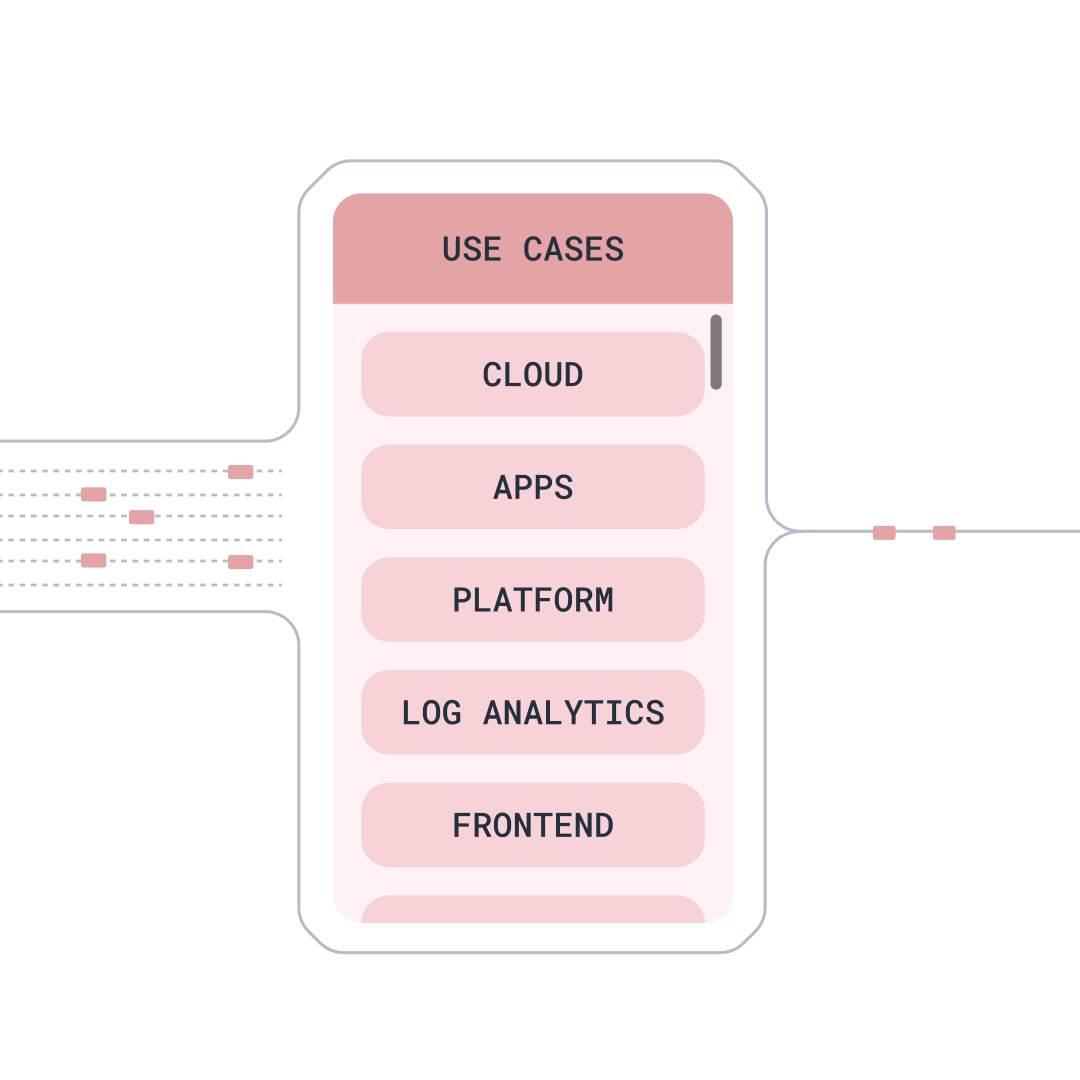
Our unified platform takes data for all of your software, stores it once, and opens up limitless querying and analysis with smart workflows and dynamic visualizations. Scroll to learn more.
Send us all the data you have for an affordable price
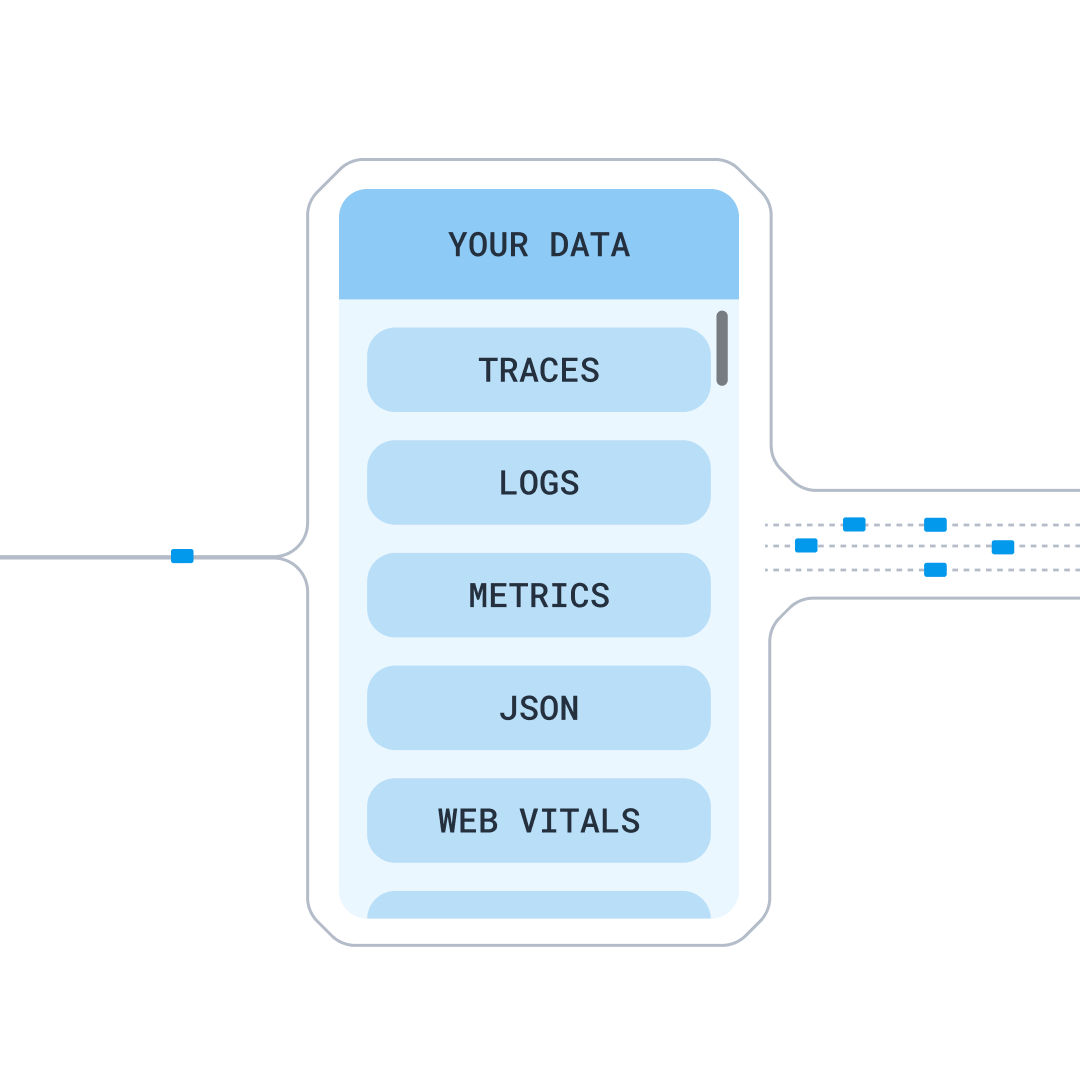
Logs, metrics, traces—send any structured data our way, without incurring extra costs as you capture more data. Let our experts help you build an efficient strategy to manage your telemetry data that captures what you need while keeping your costs predictable.
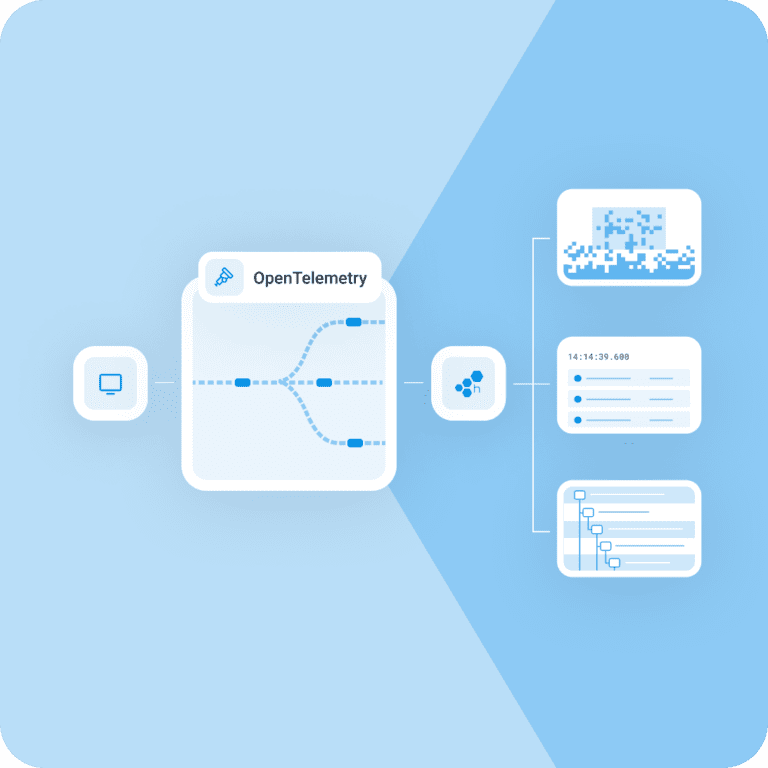
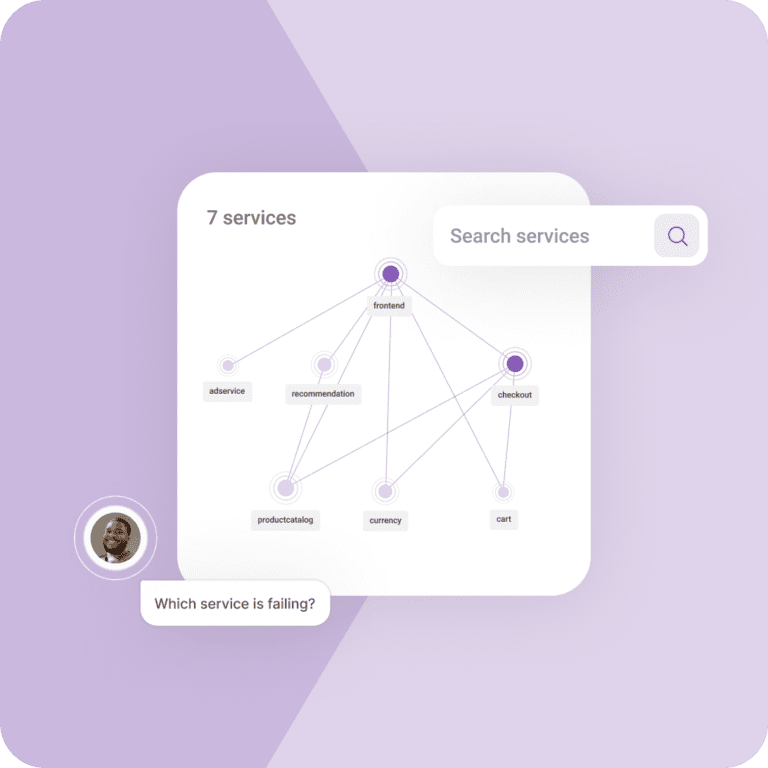
Analyze and understand your whole system
Make answering questions and solving problems simpler. Any engineer can use our intuitive platform and built-in analysis tools to pinpoint issues, conduct investigations, detect anomalies, and identify solutions.
All signal, no noise
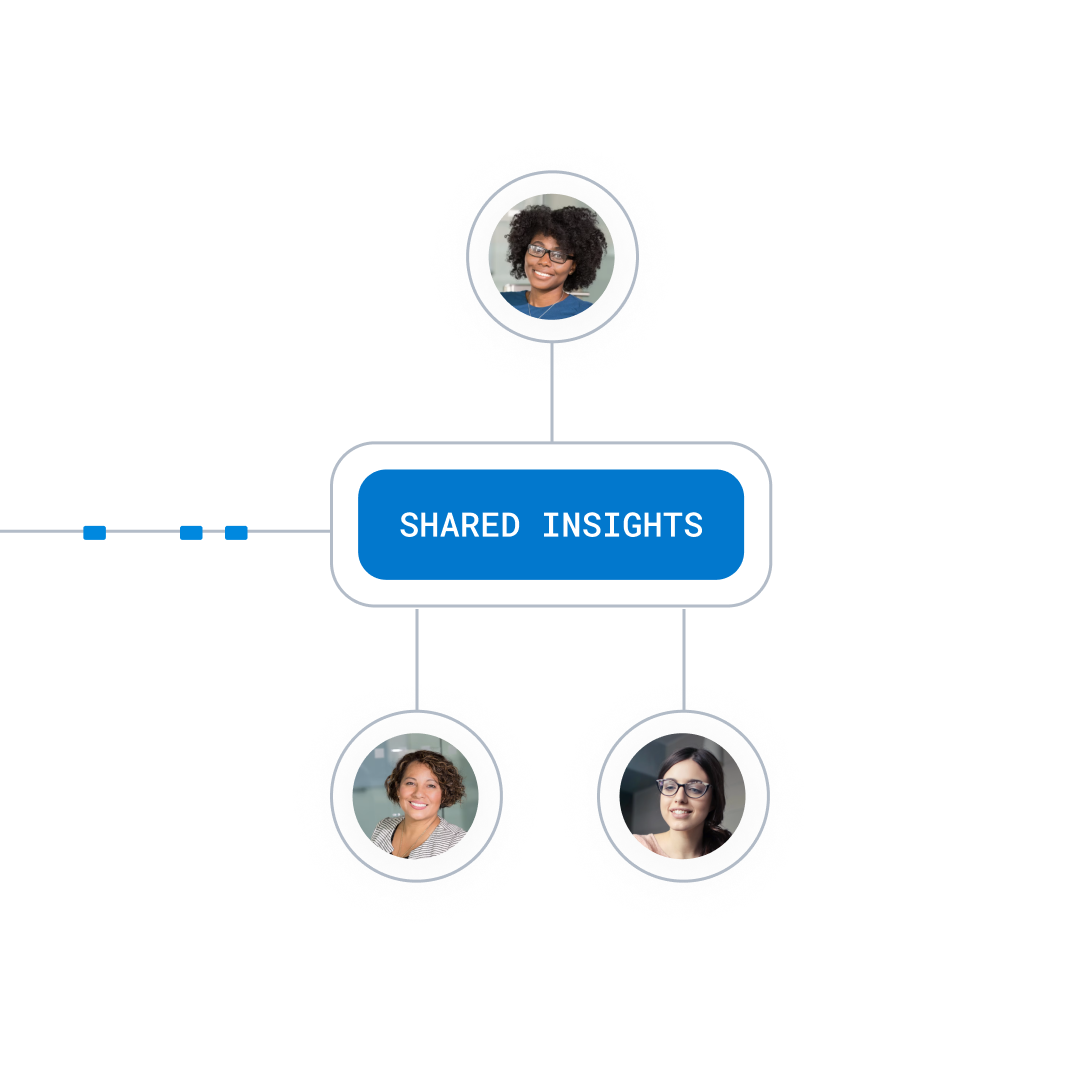
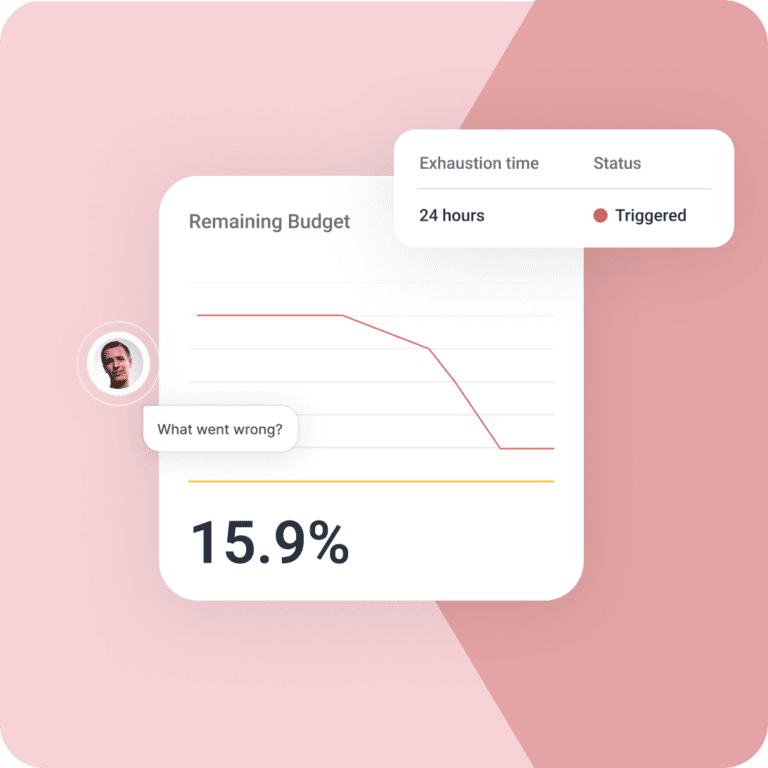
Work smarter, not harder. Set up SLOs and triggers to ensure small issues don’t consume large amounts of time. Work collaboratively to rapidly resolve problems.
See how it works
The features at your fingertips
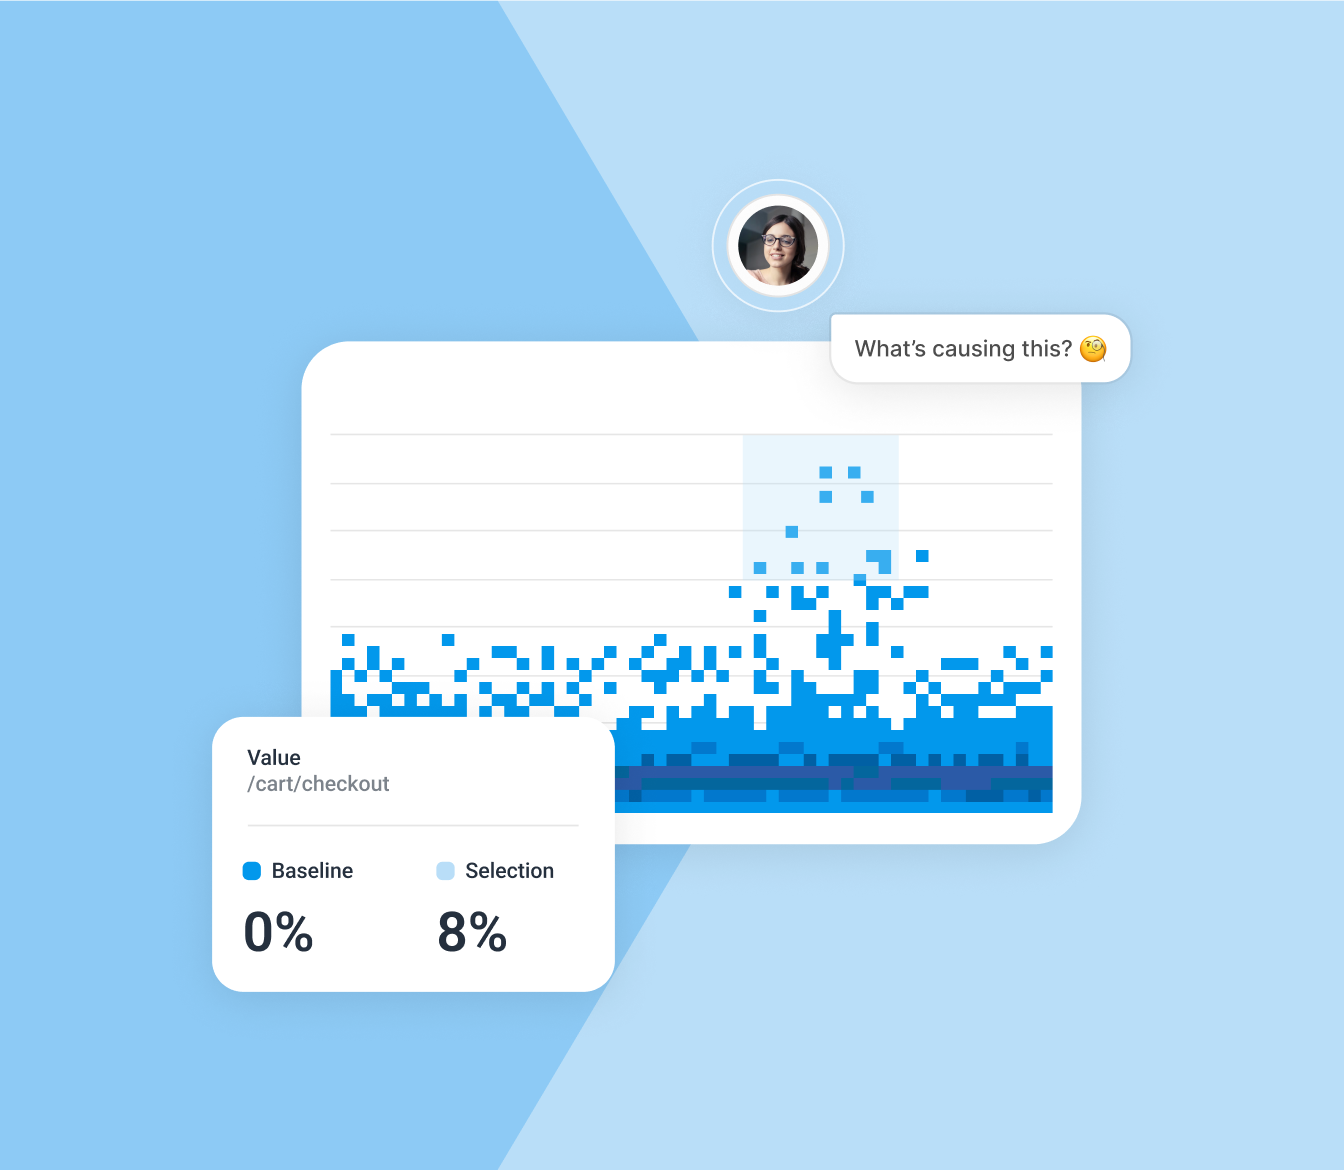
Level up with BubbleUp
Automatically detect any anomalies, then zero in to understand what’s happened and why. Easily explore across multiple views—traces, metrics, and logs—and go wherever the information takes you.
Explore Bubble Up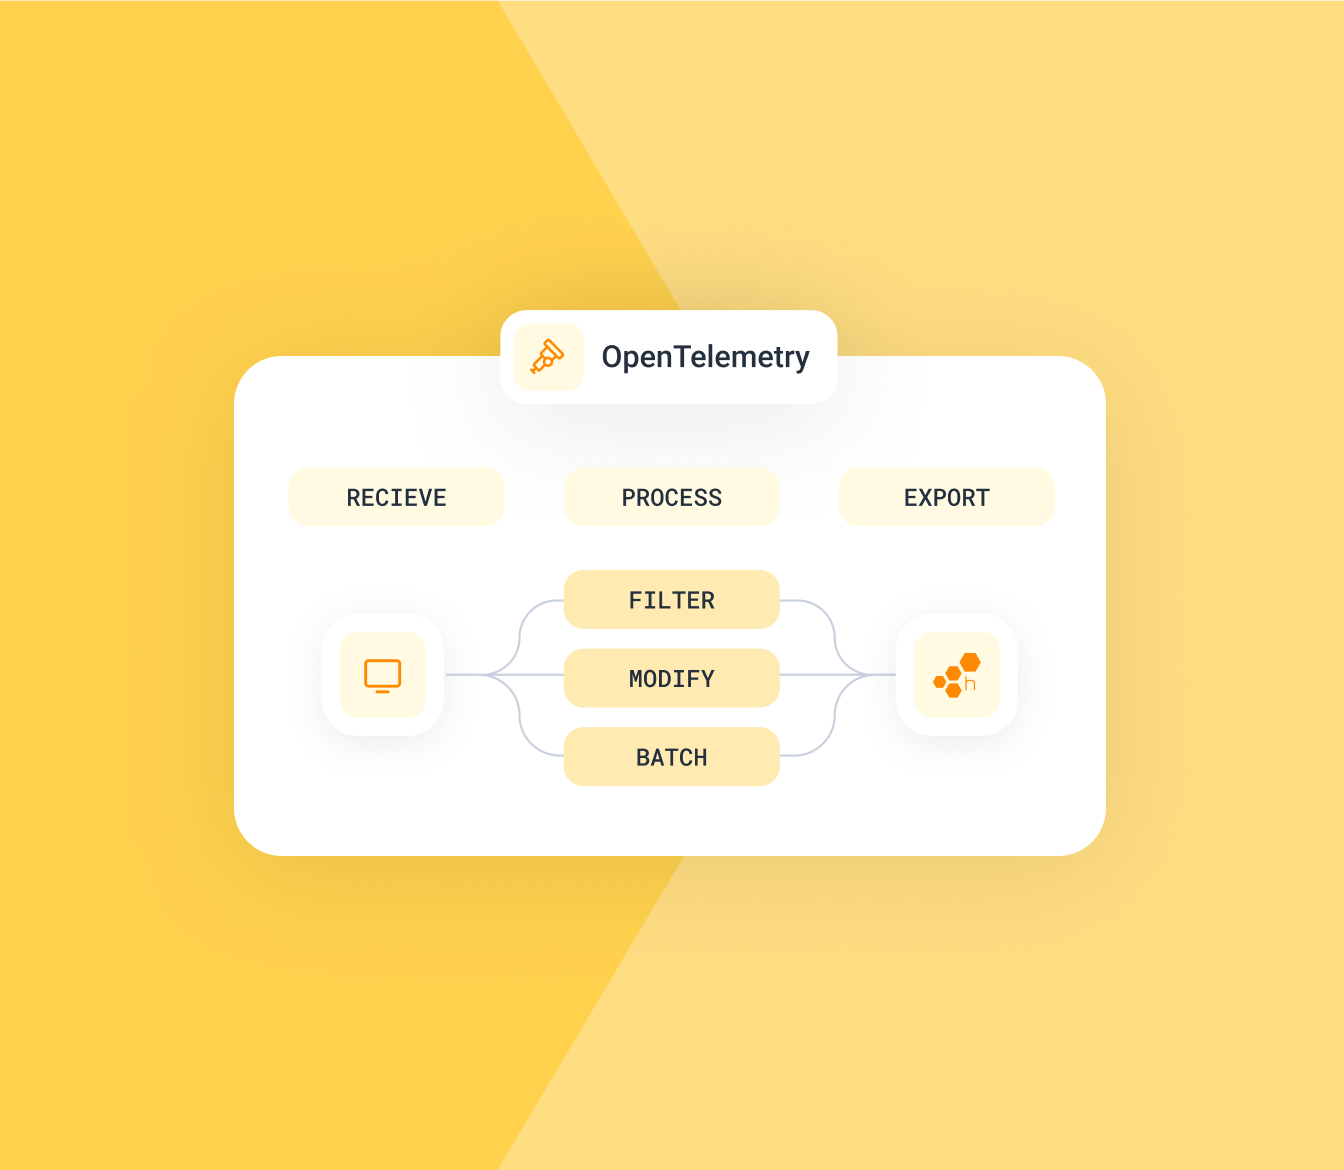
All-in on OpenTelemetry
The Honeycomb platform supports OpenTelemetry standards. Built to support over 40 programming languages, OpenTelemetry allows teams to instrument, collect, and export high-quality telemetry data.
Explore OpenTelemetry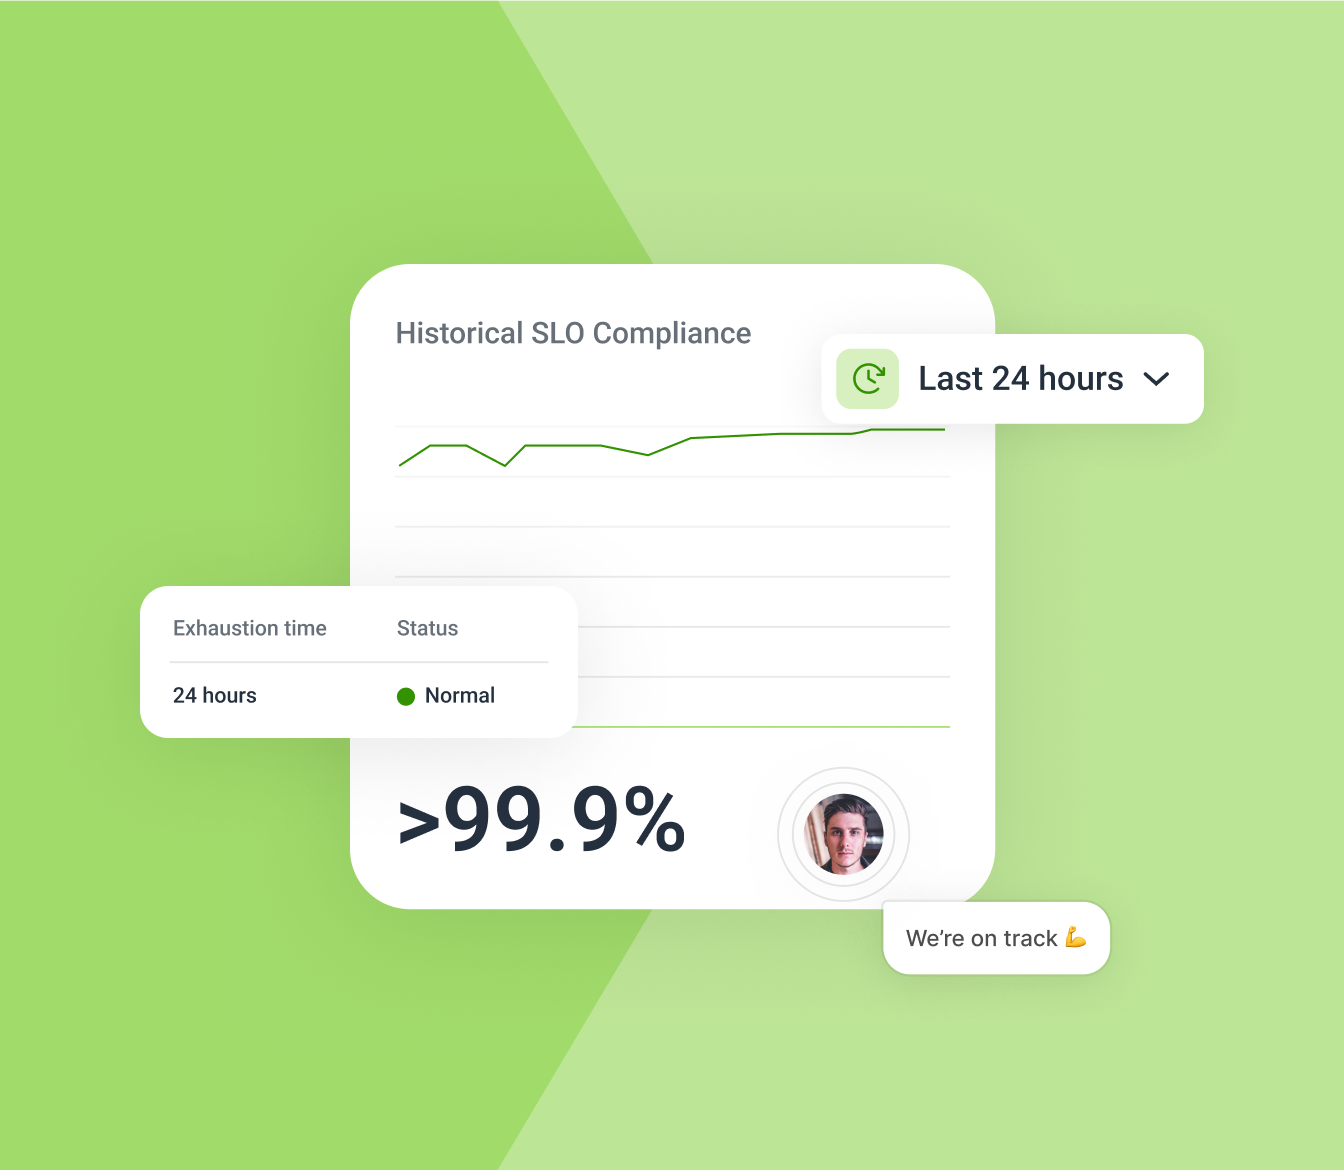
Go SLO to react fast
Service Level Objectives (SLOs) let you specify what good looks like in the language of your business. Set alerts if your service falls below acceptable levels. Every SLO is live and debuggable.
Explore SLOsExperience the power Honeycomb
Jump into our sandbox and start exploring—no signup required.
EXPLORE SANDBOX