RDS Performance Degradation - Postmortem
By Andy Isaacson | Last modified on December 1, 2018Summary
Note: all times are UTC unless otherwise noted.
On Thursday, May 3 starting at 00:39:08 UTC (Wednesday 17:39 PDT) we experienced a nearly complete outage of the Honeycomb service lasting for approximately 24 minutes. Most services came back online at 2018-05-03 01:02:49 and all customer-facing services were fully restored by 01:07:00.
Impact
- During the outage, customers were not able to log in or view graphs on the Honeycomb service.
- Events sent to the Honeycomb API during the outage were refused at elevated rates; approximately 86% of API submissions during the outage were not accepted, and approximately 81% of events that should have been submitted were not recorded during the outage. (The percentages differ because a single API submission can carry multiple events and the outage did not affect all datasets equally.)
- Since the Honeycomb API did not report success, some events remained stored on customer servers and were successfully (re)submitted after the Honeycomb API became fully available again.
- Approximately 15% of events were successfully stored during the outage.
We apologize for this outage, and to every customer that was affected. We take our responsibility for data stewardship very seriously and are making multiple improvements to our systems to ensure this kind of outage does not cause data loss in the future, and to ensure that we can restore service more quickly in the event of a similar failure.
What happened?
In retrospect, the failure chain had just 4 links:
- The RDS MySQL database instance backing our production environment experienced a sudden and massive performance degradation;
P95(query_time)went from 11 milliseconds to >1000 milliseconds, while write-operation throughput dropped from 780/second to 5/second, in just 20 seconds. - RDS did not identify a failure, so the Multi-AZ feature did not activate to fail over to the hot spare.
- As a result of the delays due to increased
query_time, the Go MySQL client’s connection pool filled up with connections waiting for slow query results to come back and opened more connections to compensate. - This exceeded the
max_connectionssetting on the MySQL server, leading to cron jobs and newly-started daemons being unable to connect to the database and triggering many “Error 1040: Too many connections” log messages.
The resolution had equally few moving parts:
- The RDS database suddenly experienced a massive improvement in latency and throughput; in the span of 20 seconds
P95(query_time)for writes dropped from >600 ms to <200 ms, while total throughput rose from <500 OPS to >2500 OPS. - Queued events completed rapidly, saturating the database at >3000 OPS for 70 seconds, after which the system returned to normal behavior: 300-500 OPS, <10 ms write times.
The story of how we got that answer (and identified a theory for the underlying failure and resolution) is an interesting example of using Honeycomb to debug a production system:
Retrospective Root Cause Analysis
The next morning during our post-mortem meeting, two theories were put forward: Either
- the elevated connection count caused the outage, somehow causing the database to run slowly, or
- the database was running slow for some other reason, causing elevated connection counts.
We worried that there might be some bug hiding in our application (or one of the Go libraries we use) causing our app to “pound down the door” when unable to connect to the database, leading to concern that if the situation happened again we might trigger the same outage. Everybody agreed it was more likely that an underlying database issue (storage, CPU, or connectivity) was at root cause, but we also agreed it was more risky if we ignored a potential application-stack bug by waves hands BLAME THE NETWORK!!!
Rule of thumb as a developer: it’s probably not the database, it’s probably your code.
To reduce the uncertainty and risk, we decided to reproduce the Error 1040 scenario in a controlled environment and observe the behavior of the system. Reproducing the connection overflow on our dogfood cluster was a matter of a shell loop and a few MySQL CLI processes and clearly demonstrated that while running out of connections does impact the app and cause cron jobs and similar to fail, it does not lead to runaway CPU use nor elevated latencies.
We now had two datasets: the outage on production, and the experiment on dogfood. Since we use Honeycomb to observe Honeycomb it’s easy for us to compare A versus B, in this case
| Dogfood Experiment | Production Outage |
|---|---|
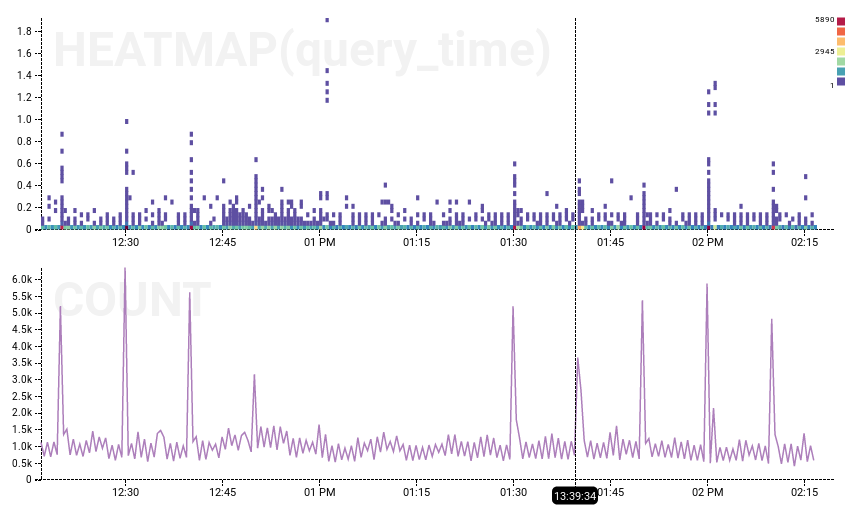 |
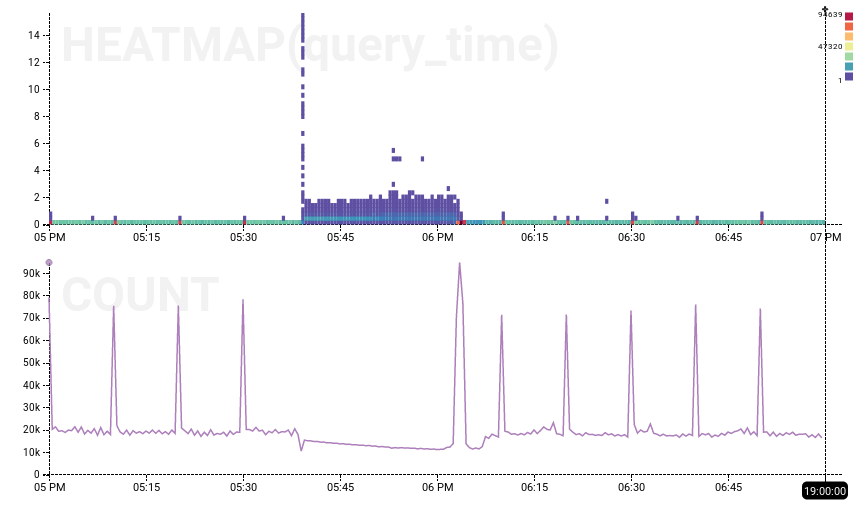 |
On the left, the dogfood experiment ran from 12:30 to 13:23 (it’s hard to see evidence other than the missing cron-job spikes), while on the right, the production outage is clearly visible. Experiment has a null result: we have not shown that Error 1040 caused the outage. More likely, then, something underlying the system is at fault.
With this information in hand, we can dig into the production data more deeply. Because Honeycomb datasets are full-fidelity (we don’t do any pre-aggregation or pre-computation) it’s possible to zoom in down to the single-second level and pivot on arbitrary keys to extract patterns. Here’s the onset of the performance anomaly as recorded via rdslogs:
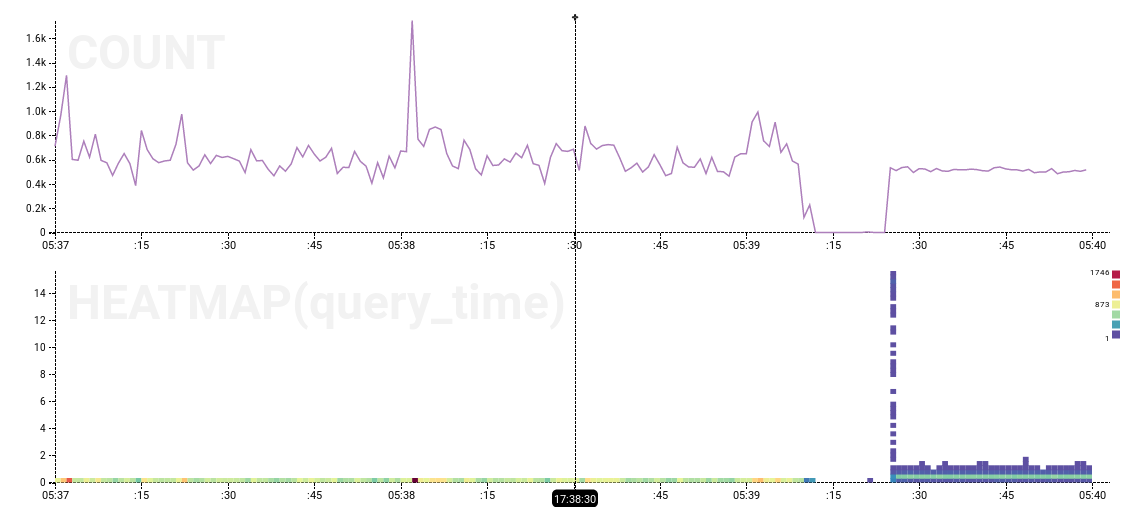
The 15-ish seconds of no activity, followed by a bunch of completed actions with query_time values up to 15 seconds, looks fairly significant. The end of the performance anomaly also has an interesting heatmap pattern:
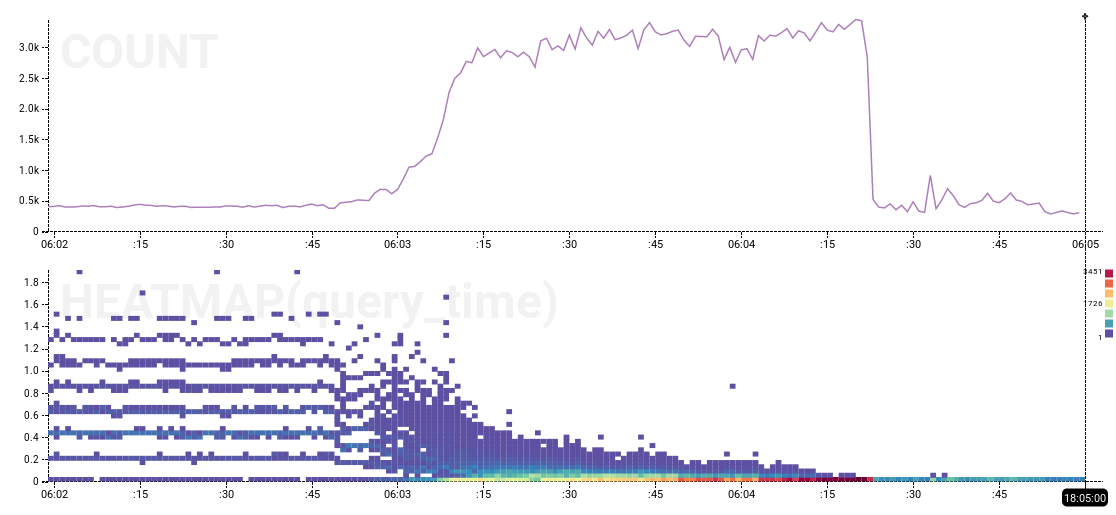
To summarize, the database exhibited 23+ minutes of consistent low-throughput, high-latency behavior, bookended by dramatic transition zones lasting less than 30 seconds, preceded by normal high-throughput, low-latency, spiky application-driven behavior, and followed by a large volume of “catch-up” events afterwards, finally transitioning back to normal high-throughput mode.
While this doesn’t constitute a full root cause analysis, it is a definitive enough pattern for us to conclude that the root cause lies within the database system and not in our application code; our app looks to have done the right thing. We further pivoted on the SQL normalized_query strings to validate that our app code worked as expected during the recovery process.
Armed with this information we re-investigated our RDS configuration and confirmed that
- we have Multi-AZ turned on.
- the instance dashboard did not indicate any health events.
- AWS documentation states that Multi-AZ does not take performance into account for health checks.
Lessons Learned
- Managed databases are great, except when they’re not.
- We will prioritize a “game day” fail-over of our dogfood RDS to revalidate our understanding of how our system performs when (inevitable) hardware failures happen. While we don’t expect more RDS hardware failures, it will be empowering to have a well documented playbook to execute when we do need to handle an RDS AZ failover.
- We are improving our ingest pipeline to ensure that we buffer rather than fail to accept customer events when our infrastructure is unable to access the database. Hardware failures happen, that’s a fact of life; losing data doesn’t have to happen.
Timeline (2018-05-03 UTC)
00:39 - outage starts
00:40 - first alert
00:42 - engineers start investigation
00:50 - escalation, multiple investigators looking at several potential avenues
00:55 - status.honeycomb.io updated to keep our customers informed
00:58 - first engineering interventions to attempt to heal system, minimal impact
01:03 - outage resolution starts
01:04:23 - resolution completes, system stabilized
01:15 - engineers conclude that outage is resolved, update status.honeycomb.io
Thanks for following along. We’re grateful to you for your patience and to our colleagues for help during this outage.
Related Posts
How We Leveraged the Honeycomb Network Agent for Kubernetes to Remediate Our IMDS Security Finding
Picture this: It’s 2 p.m. and you’re sipping on coffee, happily chugging away at your daily routine work. The security team shoots you a message...
Driving Exceptional Support: Unleashing Support Power with Honeycomb
n technical support, ensuring customer satisfaction and quickly resolving issues are of utmost importance. At Honeycomb, we embrace a comprehensive approach by using our own...
How Our Love of Dogfooding Led to a Full-Scale Kubernetes Migration
When considering a migration to Kubernetes, as with any major tech upgrade or change, it’s imperative to understand the motivation for doing so. The engineering...