OpenTelemetry (or “OTel”) helps you get your instrumentation started quickly, and it helps you get the most out of that telemetry data by providing flexible exporting options. As a result, it’s emerging as the new standard for instrumentation. To that end, today we’re sharing more insight into the work we’ve done (and are doing) to enable a path for all Honeycomb users toward OTel adoption.
We hope you’ll be as excited as we are to embrace these open standards!
What is OpenTelemetry?
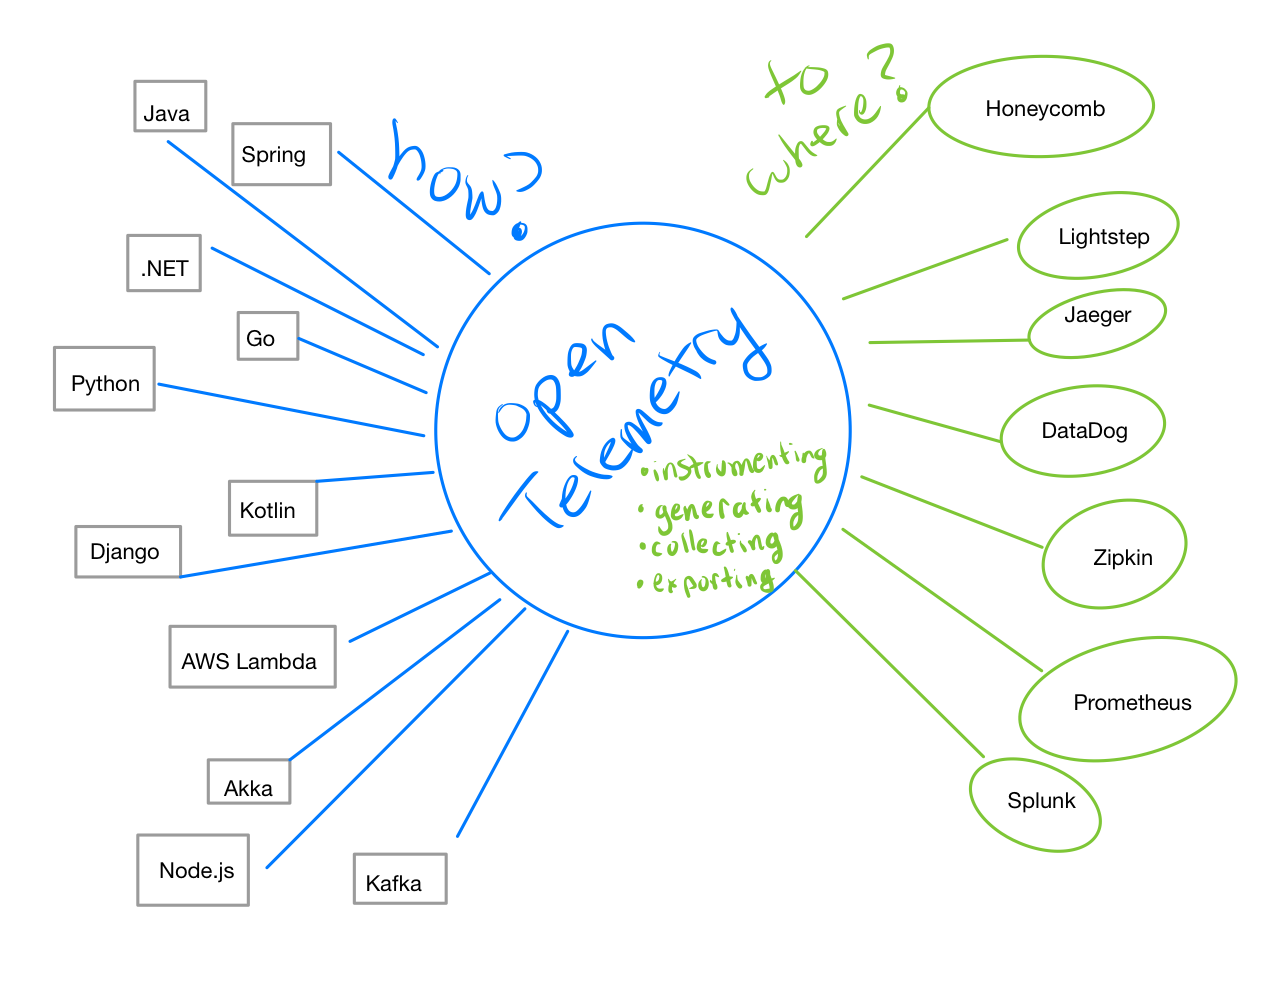
OpenTelemetry is a vendor-agnostic observability framework for instrumenting, generating, collecting, and exporting telemetry data. It integrates with many libraries and frameworks across various languages to offer a large set of automatic instrumentation capabilities. It’s also quickly becoming the best way for you to send us your instrumentation data, both now and in the future. With the broad industry adoption it has received, its capabilities are growing and OTel is maturing rapidly.
Why use OpenTelemetry?
Two critical aspects of OpenTelemetry make it a better choice than proprietary instrumentation libraries:
- The OpenTelemetry format is vendor neutral and it lets you change backends without rewriting your code. It even lets you send your telemetry data to multiple backends.
- OpenTelemetry SDKs give best-of-breed automatic instrumentation, in part because of its vast community of contributors and vendors who contribute features upstream so that they don’t maintain bespoke integrations.
By decoupling proprietary instrumentation from your code, OTel helps you avoid vendor lock-in. It gives you the flexibility to instrument once and send your data anywhere, at any time, to as many places as you want—some of which you probably couldn’t send to before.
As an open-source project with a large and active development community, OpenTelemetry has a growing list of turnkey, automatic instrumentation capabilities that will only continue to expand and mature over time. It has the added advantage of freeing you from the limitations common to many proprietary libraries today (including our own Beelines and Libhoney).
The components of OpenTelemetry
Before diving in, we’ll quickly introduce terminology describing the different components of OpenTelemetry that will be helpful later (for even more detail, you can read the specification overview):
OpenTelemetry API
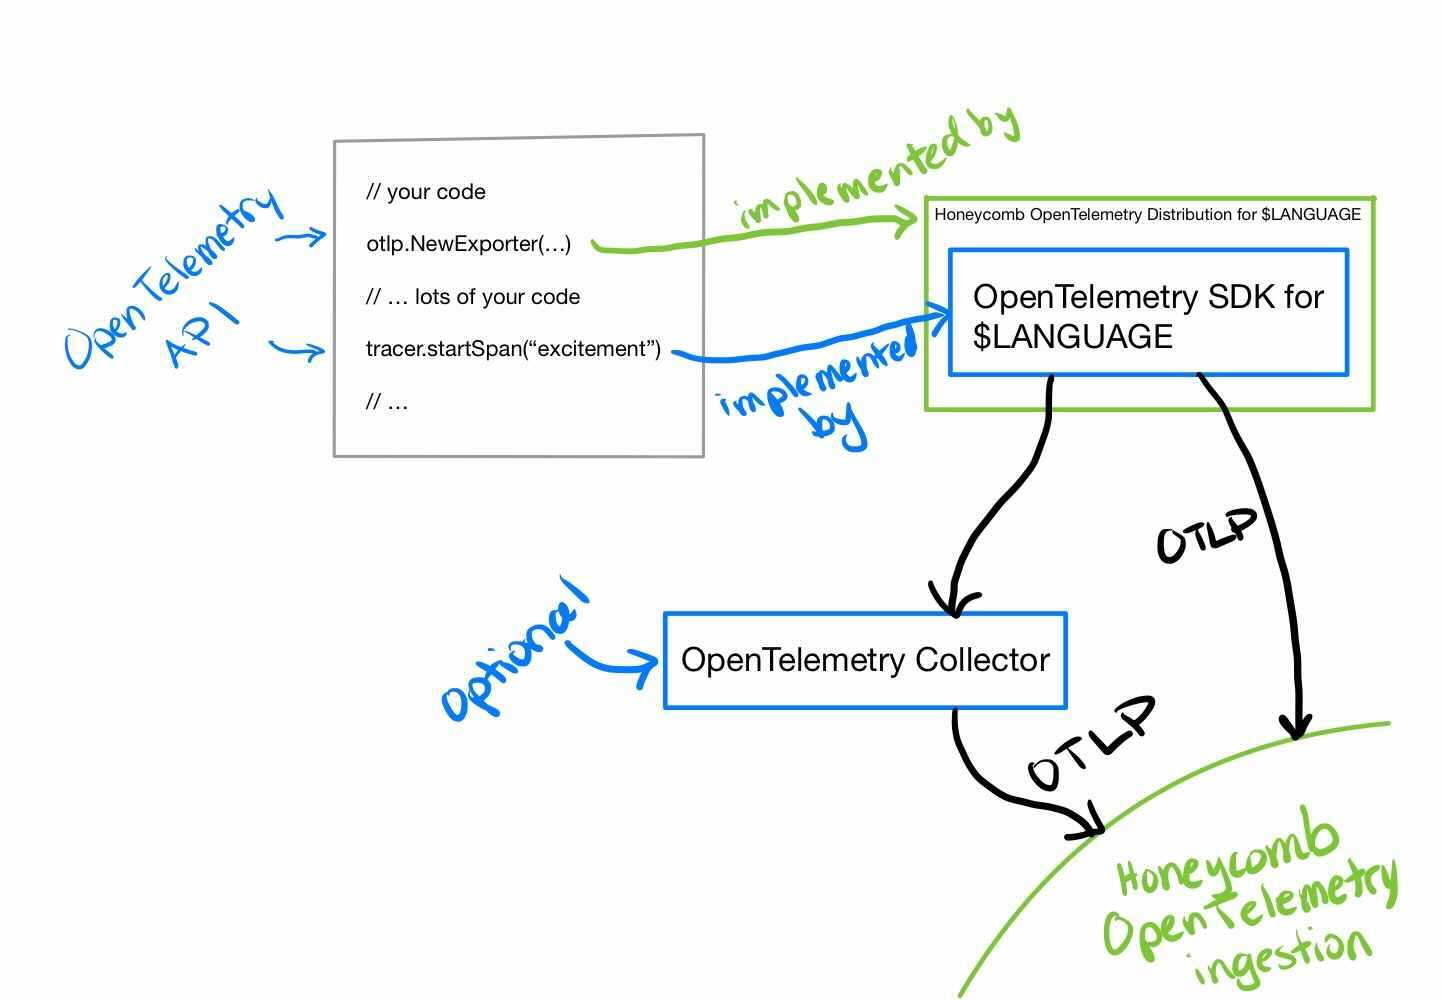
OpenTelemetry API refers to the vendor-agnostic specification of how traces, metrics, and log data interface with your code.
OpenTelementry SDK
An OpenTelementry SDK is a vendor-agnostic implementation of the OpenTelemetry API with processing and exporting capabilities. Each supported language (e.g., Java, Go, JS, etc.) is supported with an SDK. You can depend on an SDK to process and export your application’s telemetry data, any way you see fit.
OpenTelemetry distribution (or distro)
An OpenTelemetry distribution is a wrapper around an upstream component like an SDK and/or collector agent. Distributions make it easier to use or customize your telemetry data by doing a lot of the boilerplate work or providing functionality specific to a particular backend or vendor service.
OTLP (or OpenTelemetry protocol)
OTLP is the protocol that OpenTelemetry uses for data exchange. It currently supports gRPC and protobuf over HTTP, with JSON over HTTP as an experimental format. Some backends support OTLP ingest natively, whereas others require you to use the intermediary OpenTelemetry collector before sending data.
OpenTelemetry collector
The OpenTelemetry collector is a proxy used to receive, process, and export telemetry data. It supports receiving data in several formats (including OTLP), processing data (such as enabling sampling strategies that may not be supported by your SDK), and exporting data in several formats. The OpenTelemetry collector can be configured to send data to multiple backends.
How that comes together: Honeycomb contributes to vendor-agnostic upstream projects like SDKs. We also offer distros that do a lot of the boilerplate necessary to send data specifically to Honeycomb. Honeycomb supports OTLP ingestion of telemetry data. We also contribute to the OpenTelemetry Collector.
Honeycomb now supports OTLP over HTTP
Previously, we announced support for OTLP over gRPC when sending us trace data. Today, we’ve also added support for OTLP over HTTP (OTLP/HTTP + protobuf). Refinery 1.4.0 also supports this too.
This means that you can send us trace data with any OpenTelemetry SDK without any need for a Honeycomb exporter component.
Prior to this change, you needed to use the OpenTelemetry Collector to translate HTTP-encoded trace data to OTLP over gRPC. That additional configuration step is no longer necessary.
For now, the OTLP/HTTP+JSON format for sending trace data is still experimental. We’ll ensure it’s directly supported by all Honeycomb endpoints once it matures.
Also worth noting: if you’re sending us Host Metrics, you’ll still need to use the OpenTelemetry Collector for now.
Metrics—that’s OpenTelemetry, too!
In June, we announced support for Metrics. That means you can send us OpenTelemetry Metrics with the OTel Collector or with any OTel SDK that supports them. Honeycomb Metrics is still in open beta, and support for metrics in OTel varies by language (check out the OTel docs for the latest on metrics support for your particular language).
Honeycomb Metrics also supports receiving metrics from non-OTel sources and the setup docs show you how that’s done (spoiler: they’re sent to us via OTLP).
Wait, doesn’t Honeycomb have proprietary instrumentation libraries?
As a matter of fact, we do!
However, we also believe that the value you get from Honeycomb isn’t at the instrumentation layer. Instrumentation must be done so that you can unlock insights from observability. So we’ll continue to do more of what we do best: give you all the rich debugging and explorational analysis that’s possible with Honeycomb. And we’ll also help the broader community do what it’s now doing best: creating open standards that make it all possible.
We’re thrilled to see OpenTelemetry blossoming into a de facto standard and the future of instrumentation. Here’s what that dynamic means for you.
Honeycomb Java and .NET OTel distros
Currently, we’ve released two official Honeycomb distributions for OpenTelemetry: Java and .NET. Each Honeycomb OTel distribution provides four key features:
- Streamlined configuration for sending trace data to Honeycomb
- Seamless interoperability with existing OpenTelemetry instrumentation code
- Deterministic sampling
- Multi-span attributes (attributes that automatically propagate to child spans)
To get started with these distros, you can just add some dependencies in your codebase. There’s no need to configure an OTLP exporter or to deploy an OTel Collector to send trace data to Honeycomb.
Getting started with Java
Most Java developers are likely to get started with the automatic instrumentation .jar that you can run as a -javaagent alongside your application once you’ve configured your Honeycomb API key:
SAMPLE_RATE=2 \
SERVICE_NAME=my-favorite-service \
HONEYCOMB_API_KEY=my-api-key \
HONEYCOMB_DATASET=my-dataset \

java -javaagent:honeycomb-opentelemetry-javaagent-0.4.0-all.jar -jar /path/to/myapp.jar
This agent will provide rich automatic instrumentation for many libraries and frameworks.
You can also add manual instrumentation to your app by installing the SDK:
dependencies {
  compile('io.honeycomb:honeycomb-opentelemetry-sdk:0.4.0')
}
That’s it! You can learn more about how to set up your preferred configuration and instrumentation strategy with our OpenTelemetry for Java docs.
Getting started with .NET
For .NET developers, we also have a package that configures automatic instrumentation for several components:
- ASP.NET Core
- ASP.NET (if you’re on .NET Framework)
- StackExchange.Redis
- System.Net.HttpClient and System.Net.HttpWebRequest
- Microsoft.Data.SqlClient and System.Data.SqlClient
- Grpc.Net.Client
All you have to do is add the package:
dotnet add package Honeycomb.OpenTelemetry
And configure your API Key. For example, if you’re using appsettings.json with an ASP.NET Core app, you’ll have the following object:
{
…
  “Honeycomb”: {
    “ServiceName”: “my-web-app”,
    “ApiKey”: “my-api-key”,
    “Dataset”: “my-dataset”
  }
}
Then, add a single line of code to ConfigureServices:
public void ConfigureServices(IServiceCollection services)
{
    services.AddHoneycomb(Configuration);
}
There are several configuration options that you’ll want to consider based on the kind of .NET app you’re instrumenting. You can learn how to set everything up with our OpenTelemetry for .NET docs.
More distros are coming soon
We’re just getting started with rolling out OpenTelemetry distros and we’ll continue to build more. We’re prioritizing additional distros by both upstream SDK maturity and by customer demand (see the end of this post for ways to let us know what you want!).
Our goal is to ensure that if you’re sending us application telemetry data, you’ll be doing it with OpenTelemetry. If you can instrument your application in $LANG, you should be able to easily send us your instrumentation data.
Doing that means that, in addition to building out more distros for you, we’ll also be contributing new useful features to upstream OpenTelemetry projects. Our goal is to ensure that OpenTelemetry auto-instrumentation capabilities across the board are as strong as our current Beelines users expect them to be.
What this means for Beelines
As a Beelines user, this change will impact you—eventually.
Starting today, all Beelines are entering maintenance mode.
What that means for you is that you’ll likely stop seeing new major features released for Beelines moving forward. Nor will you see any new Beelines created for new languages. We’ll continue to support Beelines, fix bugs, and continue to be active in the repos. If you’ve adopted Beelines, we’ll continue to support your investment in that direction.
The majority of new future instrumentation development work at Honeycomb will be focused on OpenTelemetry. If you’ve already instrumented your code with Beelines, you can easily mix and match Beelines with OpenTelemetry. That interoperability lets you take an incremental approach to adopting OpenTelemetry in new services or projects, without creating an urgent need to migrate away from Beelines in the near future.
Most importantly, you do not have to take any immediate or near-term action. Beelines will continue to work for you for the foreseeable future.
However, if you’ve considered trying OpenTelemetry before and haven’t yet, we recommend using OpenTelemetry for any new instrumentation needs.
Moving forward, you can expect to see the same type of functionality you expect in Beelines being contributed to OTel upstream. In the long term, all OpenTelemetry SDKs will surpass Beelines with richer functionality. Today, our Java and .NET OTel distros already surpass the functionality of Beelines.
If you’re instrumenting for Go, Python, or JavaScript apps, those languages don’t have a Honeycomb OTel distro yet. However, the OTel SDKs for those languages are already very feature-rich today, and can use them to send data to Honeycomb out of the box with a few lines of config. If you’re using these languages, you should start new instrumentation projects with the corresponding OTel SDK and see if that works for you, before considering using a Beeline instead. Today, Ruby users may find more functionality in Beelines, but we also recommend starting with OTel first and seeing if that works for your current needs.
You can keep up with and learn more about considerations between using Beelines and OpenTelemetry in our docs.
What’s next for Honeycomb and OpenTelemetry
The future looks bright for OpenTelemetry and Honeycomb. You may have missed the incremental steps that got us here, but we’ve been preparing for this day for some time and we’re excited to share the news on what to expect from our ongoing investments in OTel.
In addition to rolling out more distros and continuing to make upstream contributions to OTel, we’re also currently looking at new ways to make OTel even more useful for you when using Honeycomb. For example, we’ll likely be adding new support for ingesting OTLP log data. Support for logs in OpenTelemetry is currently experimental, but we hope to add it to Honeycomb once it matures.
We believe that investing in OTel today means that you’ll get broader support and richer instrumentation for any language or environment than any one vendor can give you with proprietary solutions. Much of that richer experience is now accessible to you today. Soon, you’ll have even more.
How to get involved
We’d love to hear more from you!
If you’d like to weigh in on which OTel distros we prioritize, or if you have any feedback or questions about using the Honeycomb OTel distros today, reach out to us in our Pollinators Community Slack group.
And if you’re interested in helping out, we’d love to collaborate with you! Find us over on GitHub to learn how to contribute.
Happy instrumenting!


