Automating Collection of Troubleshooting Data with Triggers: a How-To Guide
Everyone wants to be more efficient — to spend less time on the tedious things, and more time on the things that move the needle. As much as possible, if you can automate those…

By: Molly Stamos

Everyone wants to be more efficient — to spend less time on the tedious things, and more time on the things that move the needle. As much as possible, if you can automate those tedious things, you should.
With Honeycomb, we enable you to understand how your application behaves in production through the ability to iteratively ask questions of the system instrumentation data, no matter how granular. Honeycomb triggers enable you to be notified when specific things happen in your system.
But when you get that alert, what do you do? You start asking questions of the data to understand what’s happening and get to the root cause. And often times, gathering the initial data to answer the question is tedious.

This blog post explains how to automate the collection of answers to those first few questions in a customizable way that can work in any environment. The goal is to save time and allow you to focus your energies on getting to a solution fast.
I’ve broken this out into 3 sections:
- A quick overview of our Triggers functionality (for those who haven’t used the feature)
- A high-level description of the solution (to automate collection of answers)
- The good stuff AKA the detailed steps (to customize and leverage the solution in your own environment)
What are Triggers?
Triggers are Honeycomb’s alerting and notification system. Triggers let you receive notifications when your data in Honeycomb crosses thresholds you configure. What you can define as a threshold to alert on is as flexible as a Honeycomb query. For example, you can configure a trigger to alert you when the system is exhibiting longer execution times than normal, or when logins are failing due to system issues.
At Honeycomb, we use a variety of system triggers, and we also use triggers to alert us to unusual customer behavior or customer usage of a new feature.
Triggers send notifications to Slack, Pagerduty, and email. Triggers also support posting the alert to a webhook.
When a trigger fires, it sends the list of triggered groups in the alert. For example, if our trigger started seeing excessive 500 errors for a specific set of users, the alert would include the list of users that are getting the excessive 500 errors. This allows us to rapidly hone in on where the problem is.
However, it can be tedious to look up information about each user in the triggered groups to study what they are doing in order to troubleshoot the issue. If we could automate the collection of this initial data, we would save time and be faster at resolving the issue.
For example, in the triggered alert that is sent to PagerDuty or Slack, we could include links to other systems to pull important information, such as the user’s service tier or link to log detail that isn’t in Honeycomb – e.g. in the alert, have a sentence that says
Download the logs from https://console.aws.amazon.com/ecs/home?region=us-east-1#/clusters/default/tasks/<TASK_ID>/details
where Task_ID is pulled from the list of triggered groups. It’s just a single click then for the person troubleshooting the issue.
What does this solution do?
While you can’t customize alert messages within Honeycomb itself, you can leverage a trigger’s ability to post to a webhook to build your own alerts that include these custom links.
In our internal system, we have a trigger that alerts us if any customer’s dataset suddenly starts experiencing massive column growth. While Honeycomb easily supports datasets with many columns, once a dataset exceeds 8,000 columns — we assume something unintended is happening 🙂
When this trigger fires, we look up the owner of the account and email that person to notify them that we’re seeing excessive column growth. Typically, customers appreciate being notified (and the column growth is unintended), but the manual lookup to determine the team owner and get their email address takes time and I wanted the alert that we receive to include links with this information already gathered.
The solution that I built does the following:
- Uses a webhook that receives the posted data from the trigger, ie. the team ID and dataset name for the set of datasets experiencing this sudden column growth.
- Creates a template query (learn about those here) that will pull the team owner’s email address for each dataset experiencing the growth.
- Posts a custom alert to Slack that includes the link that gives me the list of email addresses to contact.
(If you’re not familiar with webhooks, this blog does a good job explaining them.)
Options for webhook hosting
It’s great if you have the infrastructure to host a webhook, but there are a lot of services out there that will host the webhook for you, along with the custom code to run when the webhook is called. This saves you the hassle of managing yet another piece of infrastructure. Zapier is one such service, the service that I use for my solution is Transposit. I like Transposit because I can use my own development environment and I love their SQL interface to APIs approach.
How do I do this myself?
Follow these steps to enable your own custom alerting from a trigger.
Step 1: Set up a Transposit account and log in
Go to https://console.transposit.com/t/mollystamos/trigger_board and click the Fork This App button at the top of the screen, marked with a (1) in this screenshot. This will create your own copy of my application for you to work with.

Note: If you’re like me and prefer to develop in your local environment, you can clone your project to your local Git environment. When you commit your changes, they will be updated in the Transposit system and deployed (if your application is live). Follow these instructions to setup your project locally: https://www.transposit.com/docs/references/repository/
Step 2: Specify your query
You now have your own project where you can make your changes to customize the alert for your purposes. Let’s take a look at what my application contains:
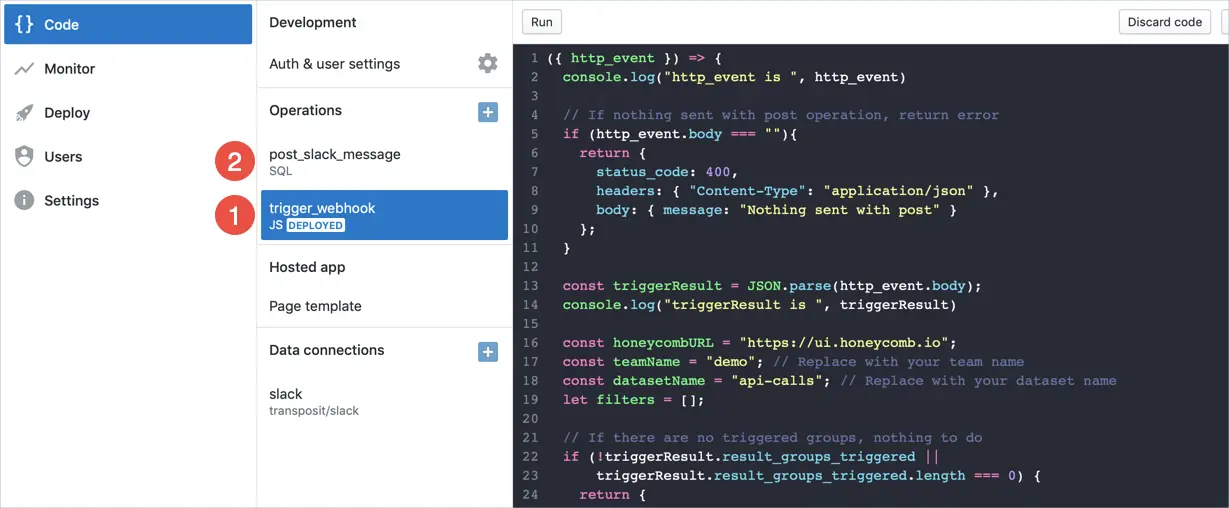
I have two operations:
The first is my webhook, called trigger_webhook(1). The code displayed on the right is the code that will be run when my webhook receives a post from the trigger. It is written in Javascript.
The second operation is called post_slack_message(2). This will post a custom alert to Slack when the webhook runs.
Let’s take a closer look at the Javascript code for my webhook:
When the trigger fires, it will post its details to the webhook. Those details will be passed to my code as an object called http_event.
The trigger payload is in the `http_event.body` field. Here is an abbreviated version of what Honeycomb will post:
{"name": “Excessive Column Growth, "status": "TRIGGERED", "result_groups_triggered":[{"Group":{"team.id":”vs23dfh”},"Result":8102},{"Group":{"team.id":"pcosdfe"},"Result":9834}],"trigger_url":"https://ui.honeycomb.io/demo/datasets/api-calls/triggers/xSUu44xHqW"}
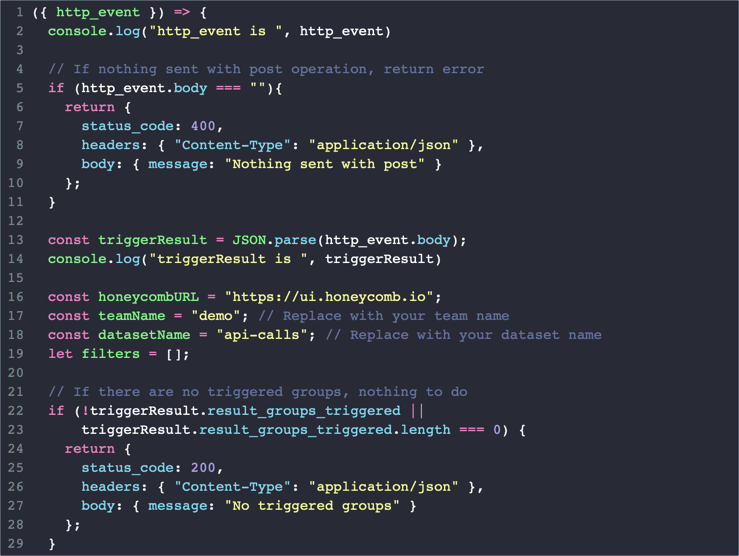
From lines 2 – 15 I verify something was sent and parse the posted JSON into an object I can work with.
To set this up to run for your team, replace the fields on lines 17 and 18 with the team and dataset name for which you want to construct the template query.
(I left the console.log statements in the code – they can be a useful debugging tool.)
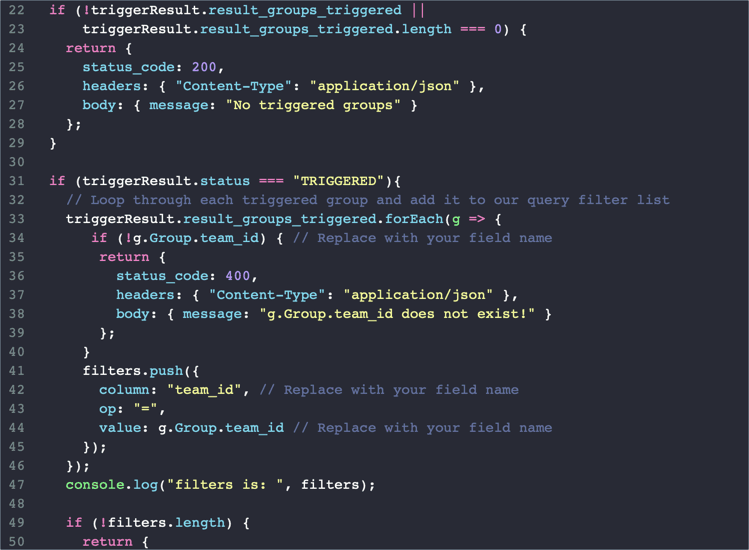
From lines 31 to 44, I loop through each triggered group and add it to the filters array that I will use in my template query. This ensures that when the query runs in Honeycomb, it will be filtered to only those customers who are experiencing excessive column growth.

From lines 55 to 61, I construct the query template I will use to create the query I want to include in my custom Slack alert.
For example, I want my query to includes breakdowns by team_name and owner_email — that’s the specific information I need for my work. Note how I’m using the filters list I generated above in the filters clause. This will ensure the query only pulls the team names/owner emails for those teams experiencing the large column growth.
On line 64, I create the actual URL for the template query that I will send in my custom Slack alert.
Last, on line 70, I invoke the Transposit API to call my post_slack_message operation (which sends a custom alert to slack) with the template query.
Step 3: Add the webhook to the trigger you want to use
Now that you’ve customized the code for the webhook, click on the Deploy link in the left hand menu, and make sure Endpoints is selected.
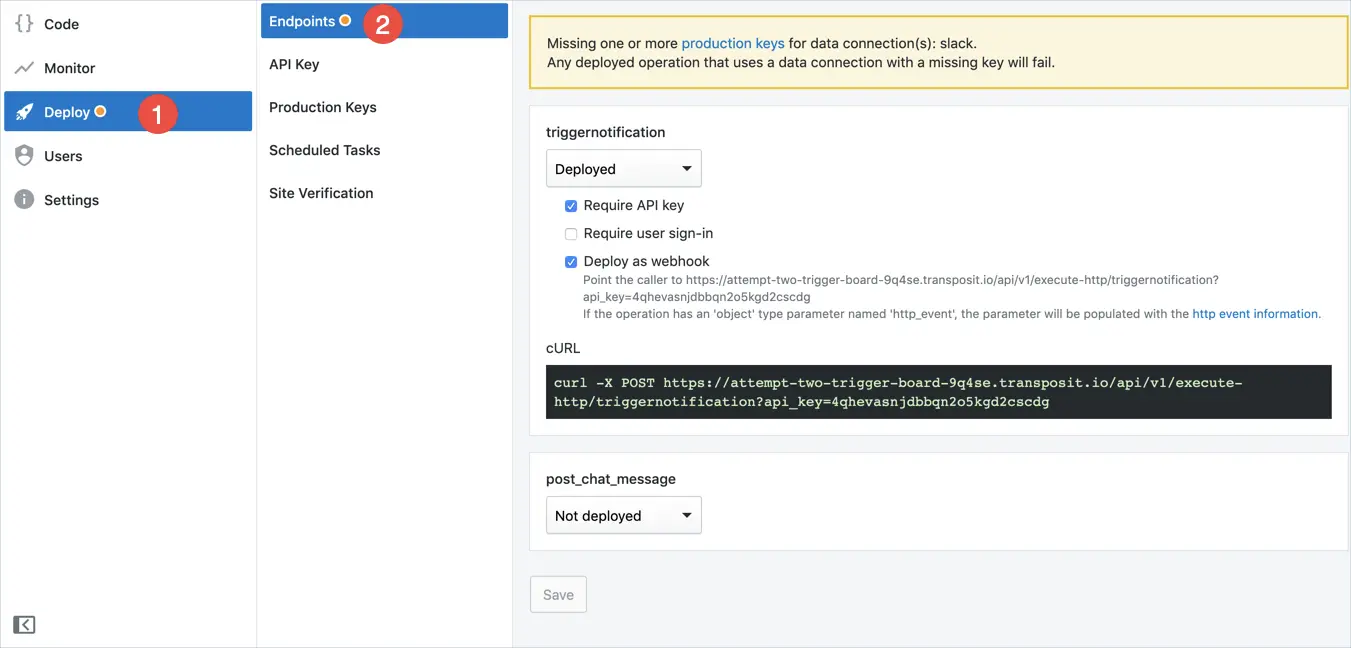
Note: Ignore the Slack error about production keys for now.
Notice that this is configured to Deploy as a webhook and Require an API key for authentication. You can see that it provides you with the URL you should supply to Honeycomb for your trigger to post to this webhook.
Now, let’s go to the trigger you’d like to use in Honeycomb (or set up a practice trigger).

Click on the Alarm Bell icon in the left hand nav bar (1) and then click on the name of the trigger you’d like to set up with the webhook (2).
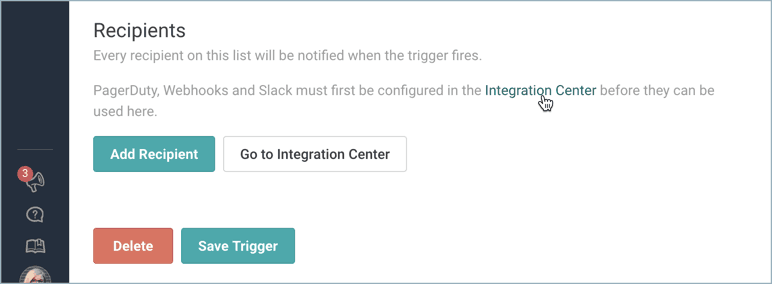
On the Edit Trigger page, scroll down to the Recipients section and open the Integration Center in a new tab.
On the Integration Center page, click Add Integration. The Add Integration dialog will open.
Select Webhook as the type.
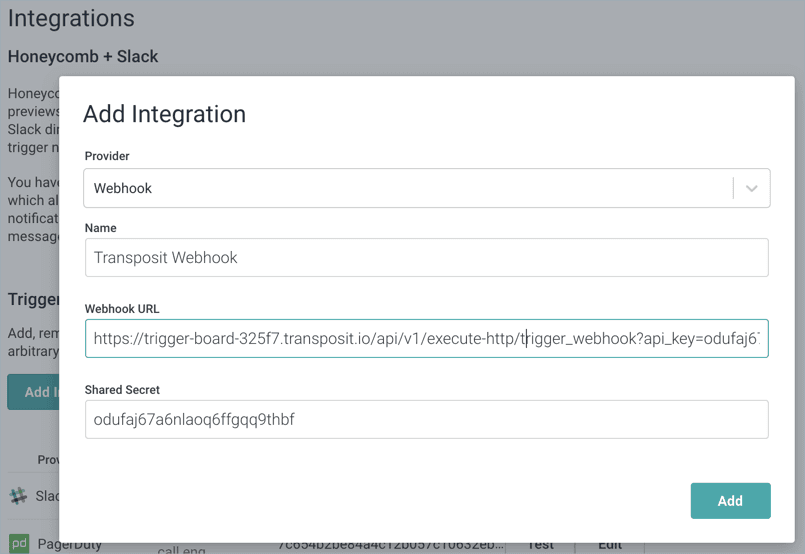
Give the webhook a name and copy and paste the webhook URL information from Transposit into the Webhook URL field.
(For example, the URL for my webhook is https://trigger-board-325f7.transposit.io/api/v1/execute-http/trigger_webhook?api_key=uxxxxx.)
Put the webhook API Key in the Shared Secret field.
Click Add.
At this point, you can click the Test button to validate that the Transposit webhook is able to receive a post from Honeycomb. When you click Test, a basic “hello world” message is posted to the webhook.
Within Transposit, you’ll be able to see the details of the post from the Monitor tab. Because I have left the console.log statements in the code, you can see the output from those on this tab.
Note: At this point, we are only confirming that Honeycomb can communicate with Transposit – so don’t worry if the run fails.

This page does not automatically refresh — so make sure to manually refresh it so that you see the latest runs.
Step 4: Set the webhook as the recipient for your trigger
Now that we’ve configured the webhook, let’s set it as our recipient for the trigger.
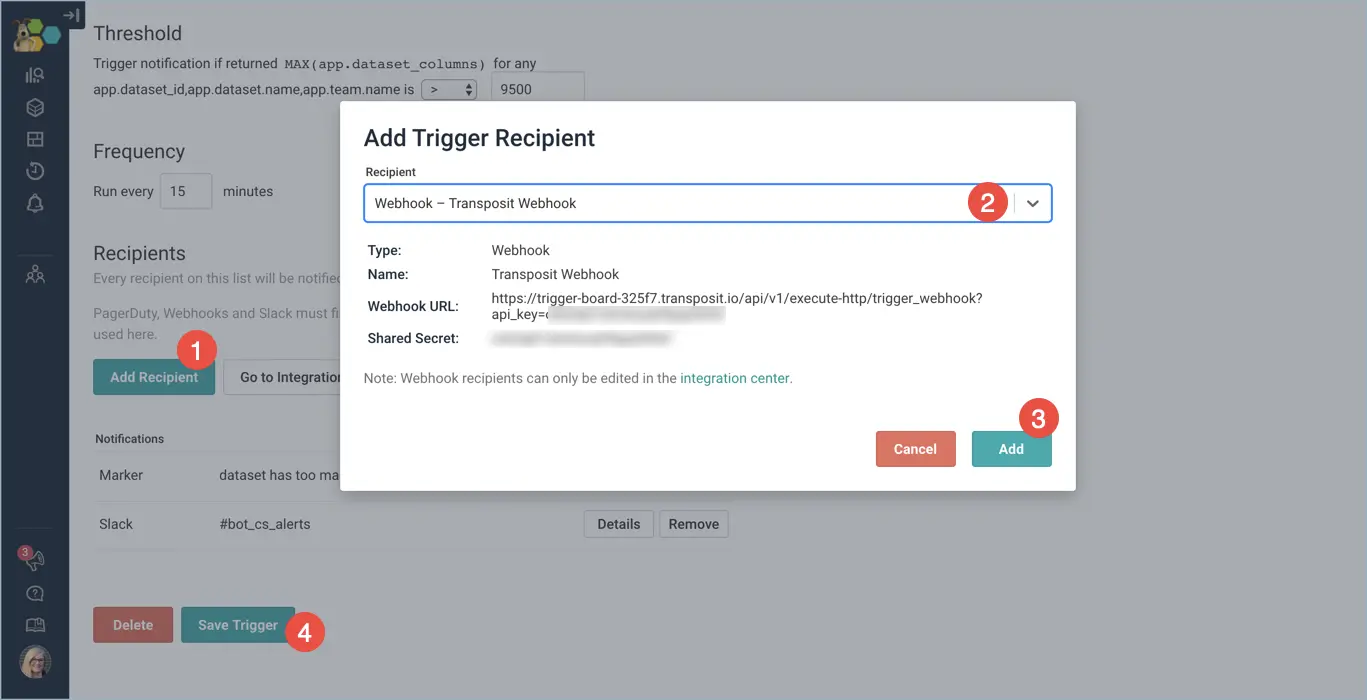
Go back to the previous tab (or if you don’t have the tab open, go back to editing your trigger), and click Add Recipient (1). From the Recipient dropdown, find the webhook you just set up and select it (2).
Note: If you don’t see your webhook, try manually refreshing the Edit Trigger page and click the Add Recipient button again.
Click Add (3). You should now see the Transposit webhook listed as one of the Recipients.
Finally, click Save Trigger (4).
Step 5: Pass the data to the Slack message
Now, let’s come back to Transposit and look at the post_slack_message operation. This is the code to send a custom alert to Slack when the trigger fires.
Transposit has an out of the box integration to Slack. All Transposit integrations are accessed using a SQL interface.
Let’s walk through the post_slack_message operation:
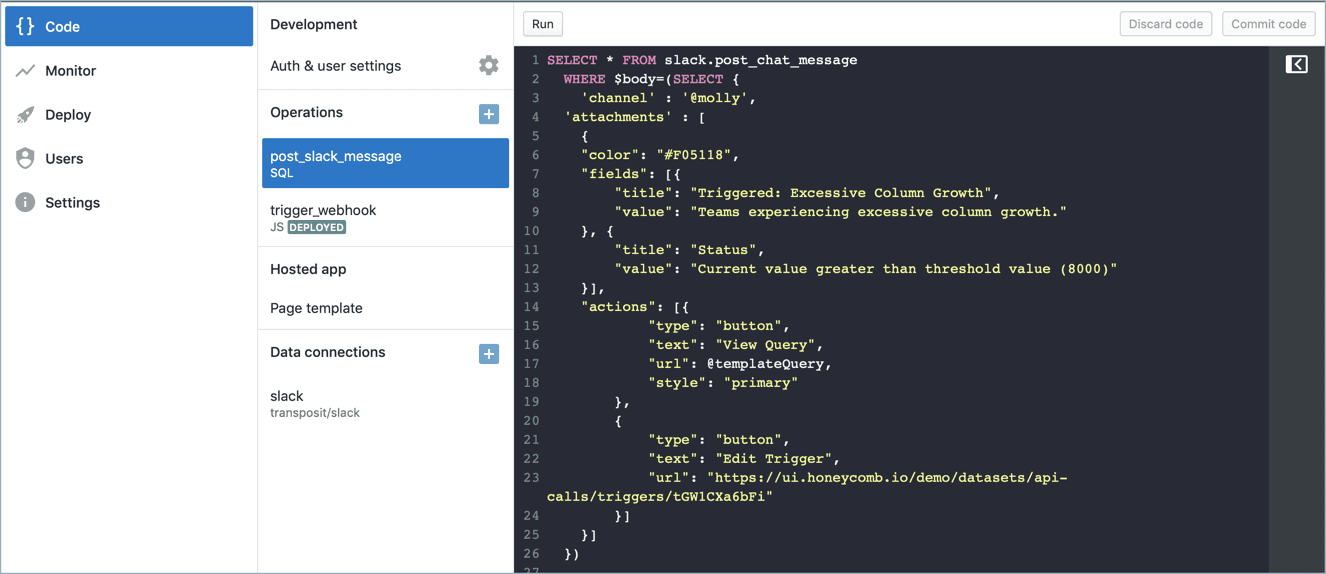
- On line 3, I specify the Slack channel to post to. Replace @molly with your Slack channel or user.
- On line 8, I specify the title I’d like the message to have. Replace with your title.
- On line 9, I specify the description I’d like the message to have. Replace with your description.
- On line 12, I specify the threshold exceeded. Replace with your threshold, or remove the title/value clause all together.
- From lines 14 – 19, I specify a Slack button that, when clicked, will open to our templatized query that shows me the owner email addresses. You should not have to make any changes here.
Note: The Template Query we created in the trigger_webhook is being passed to this operation as @templateQuery.
- From lines 21 – 24, I add the ability to edit the trigger from the Slack alert. Replace the URL with your trigger’s URL, or remove the button clause all together.
You can pass much of the data I hardcode into this operation (such as trigger URL, name, description, etc.) from the trigger_webhook operation. For brevity sake, I did not do that here.
Access the entire Slack API within Transposit here: https://www.transposit.com/docs/references/connectors/slack-documentation/.
Refer to this documentation for details on formatting your Slack message the way you want (e.g. buttons, links, attachments, etc): https://api.slack.com/methods/chat.postMessage
Step 6: Set up Slack credentials for your integration
Now that you’ve familiarized yourself with the post_slack_message operation and code, it’s time to look at the Slack error message we saw on the Deploy tab. When you forked my application, Transposit created a forked version of the application – but it did not copy the authentication credentials. You must set up your own Slack credentials, so that Transposit can authenticate and post to your Slack environment.
Click on the production keys link to add your Slack key (1).

Transposit walks you through configuring Slack authentication/authorization for your app.
By default, the scope of permissions are broad. You can restrict the scope by editing the configuration. Once you’ve set up the initial Slack integration, navigate to the Code tab and select your Slack data connection. Edit the configuration. Under OAuth Config, you will be able to set the Scope and request fewer capabilities. See all the scope options here: https://api.slack.com/docs/oauth-scopes. You’ll need to re-add Slack keys for this scope change to take effect. You can contact support@transposit.com for assistance if you need it.
Step 7: You’re finished! Time to test
That’s it! The setup is complete. Congratulations 🙂

It’s time to test the flow end to end. The Test button for your trigger sends a fake “triggered” message followed immediately by a “resolved” message. It’s an excellent way to validate that your custom integration is working exactly as you expect.

Go to the Triggers page and click Test (1) for your trigger that posts to Transposit.
If all goes well, you’ll get an immediate Slack message with a button that takes you to your templatized query. Try clicking the button in your Slack message – does Honeycomb open to the specific query you specified with the template query? If so, cheers! You’ve completed your first custom trigger notification.
If you receive an error, pop over to the Monitor tab in Transposit and refresh the page to load the latest logs. There should be two new lines, one for the triggered post and one for the resolved post. Explore these logs to see what went wrong.
This was fairly easy for me to set up and definitely saves me time. It’s fun to play with trigger webhooks to automate as much as possible. Hoping you find opportunities to save time with this approach!
Like to solve problems faster and more successfully? Check out Honeycomb Play to see if you can solve a real outage!
Want to know more?
Talk to our team to arrange a custom demo or for help finding the right plan.