
New to Honeycomb? Get your free account today!
CloudWatch metrics can be a very useful source of information for a number of AWS services that don’t produce telemetry as well as instrumented code. There are also a number of useful metrics for non-web-request based functions, like metrics on concurrent database requests. We use them at Honeycomb to get statistics on load balancers and RDS instances. The Amazon Data Firehose is able to export directly to Honeycomb as well, which makes getting the data into Honeycomb straightforward.
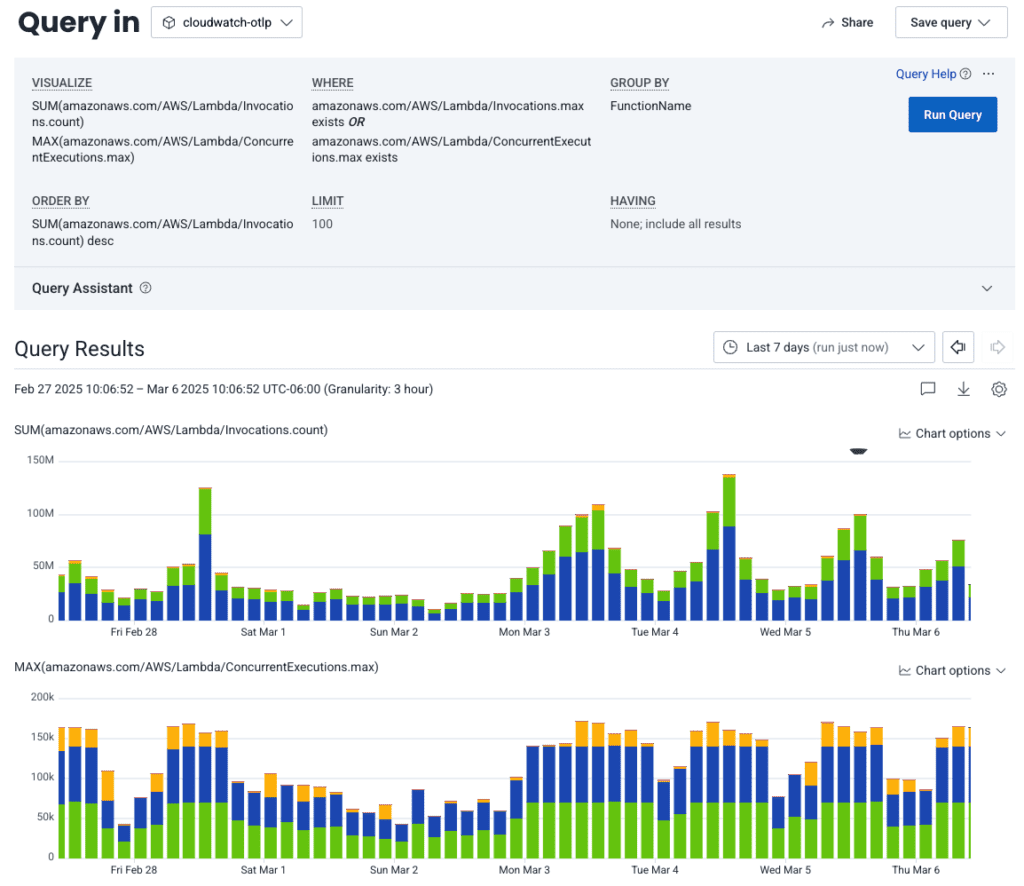
Here’s a query looking at Lambda invocations and concurrent executions by function names. Queries like this allow us to see trends in our AWS Lambda usage over time:
However, CloudWatch metrics’ filtering capabilities are pretty limited. You can filter down to a service type and even a specific metric to export, but you can’t filter based on arbitrary parameters like service name. If you’re exporting Lambda metrics, for example, you export metrics for all the Lambda functions in your AWS account. Depending on how you’ve set up your organization, this might include testing or development instances of Lambdas that you don’t really care to get metrics for.
Also, due to the way that the Amazon Data Firehose sends the data from CloudWatch—and the delays caused by their internal pipeline—this integration doesn’t always take full advantage of Honeycomb’s built-in metrics compaction, resulting in unnecessary extra events that are harder to use.
The OpenTelemetry Collector can fix both of those limitations.
Receive CloudWatch metrics with the Data Firehose receiver
Since we were already using the Data Firehose to send our metrics directly to Honeycomb, I found a receiver that accepts the Data Firehose for CloudWatch metrics: awsfirehose receiver.
There’s a pretty simple config to get it set up:
receivers:
  awsfirehose:
    endpoint: 0.0.0.0:4433
    record_type: cwmetrics
    access_key: "some_access_key"
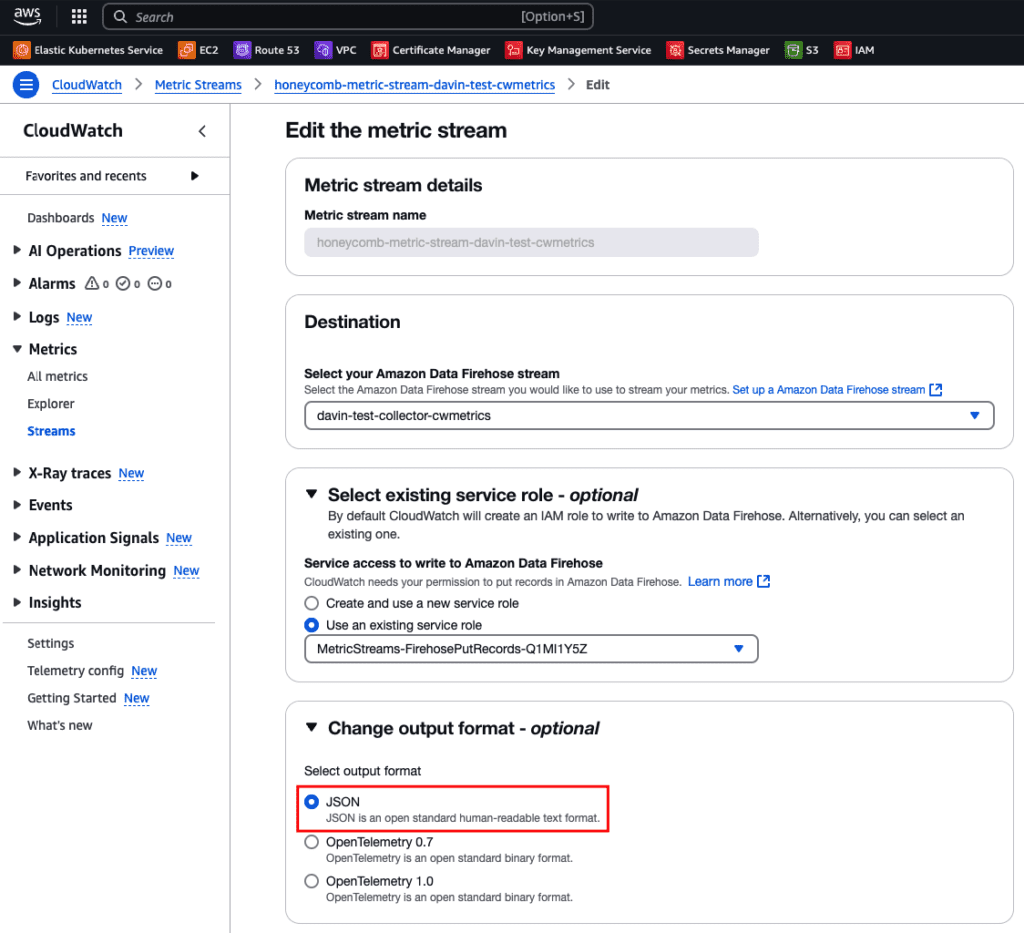
This receiver is configured with the cwmetrics record_type to receive Data Firehose data in JSON format, so be sure to configure your cloudwatch stream with JSON—not OpenTelemetry formatted data.
Note: You might be able to use OpenTelemetry 1.0 with the current version of the receiver, but you would need to set the record_type in the config to otlp_v1.
Once your metrics stream is sending to Amazon Data Firehose, you can configure your Firehose to send to your Collector.
There is one caveat…
There’s one tricky thing that you need to be aware of: you need to make this Collector public to the internet somehow, as the Data Firehose (at the time of this writing) doesn’t send to internal load balancers in a private VPC or security group.
Fortunately, the awsfirehose receiver allows you to define an access key. You can set this string in your Amazon Data Firehose configuration to authenticate the data from your Firehose to your Collector. It’ll block unauthorized data from being sent to your Collector and on to your Honeycomb environment.
In my sandbox environment, I have the aws-load-balancer-controller and external-dns deployments running, which allow me to set up my load balancer with a simple Kubernetes ingress. Below is what my Helm values file for installing the collector looks like. If you don’t use these things in your cluster, the setup should still be pretty straightforward—you can use the annotations in the Helm values as a guide on how to set up your load balancer against your Collector.
mode: deployment

image:
  repository: "otel/opentelemetry-collector-contrib"

config:
  exporters:
    otlp:
      endpoint: api.honeycomb.io:443
      headers:
        X-Honeycomb-Dataset: aws-cloudwatch-metrics
        X-Honeycomb-Team: MY_HONEYCOMB_API_KEY
  receivers:
    jaeger: null
    zipkin: null
    otlp: null
    awsfirehose:
      endpoint: 0.0.0.0:4433
      record_type: cwmetrics
      access_key: "MY_COLLECTOR_ACCESS_KEY"

  service:
    extensions:
      - health_check
    pipelines:
      traces: null
      logs: null
      metrics:
        exporters: [otlp]
        processors: [batch]
        receivers: [awsfirehose]

ports:
  awsfirehose:
    enabled: true
    containerPort: 4433
    servicePort: 4433
    hostPort: 4433
    protocol: TCP
  otlp:
    enabled: false
  otlp-http:
    enabled: false
  jaeger-compact:
    enabled: false
  jaeger-thrift:
    enabled: false
  jaeger-grpc:
    enabled: false
  zipkin:
    enabled: false

ingress:
  enabled: true
  annotations:
    alb.ingress.kubernetes.io/backend-protocol-version: "HTTP1"
    alb.ingress.kubernetes.io/certificate-arn: "MY_SSL_CERTIFICATE_ARN"
    alb.ingress.kubernetes.io/group.name: "aws-cwmetrics-collector"
    alb.ingress.kubernetes.io/group.order: "2"
    alb.ingress.kubernetes.io/listen-ports: '[{"HTTPS":443}]'
    alb.ingress.kubernetes.io/scheme: "internet-facing"
    alb.ingress.kubernetes.io/target-type: "ip"
    alb.ingress.kubernetes.io/unhealthy-threshold-count: "2"
    alb.ingress.kubernetes.io/healthcheck-port: "13133"
    alb.ingress.kubernetes.io/success-codes: "200-299"
    external-dns.alpha.kubernetes.io/hostname: "aws-cwmetrics-collector.my.domain"
    kubernetes.io/ingress.class: "alb"
  hosts:
    - host: aws-cwmetrics-collector.my.domain
      paths:
        - path: /
          pathType: Prefix
          port: 4433
  tls:
    - secretName: collector-tls
      hosts:
        - aws-cwmetrics-collector.my.domain

resources:
  limits:
    cpu: 200m
    memory: 256Mi
  requests:
    cpu: 100m
    memory: 128Mi
Filter the metrics received by the OpenTelemetry Collector
Once you have your configuration, you can start adding filters to the pipeline that will reduce the traffic needed. The below example drops CloudWatch metrics from the API Gateway service where the API Name starts with the string uat-.
processors:
  filter/cwmetrics:
    error_mode: ignore
    metrics:
      datapoint:
        - IsMatch(attributes["ApiName"],"^uat-.*")

service:
  pipelines:
    metrics:
      exporters: [otlp]
      processors: [filters/cwmetrics, batch]
      receivers: [awsfirehose]
You can have multiple filters here, where every item in the array is joined with OR logic, so if any of the items match the OTTL in the array, that event will be dropped.
Better compaction in Honeycomb on top of reduced metrics after filtering
A nice aspect of using the awsfirehose receiver in this way is that it plays better with Honeycomb’s metrics events compaction. This works because of the batch processor in the Collector. You can tune it to be even more efficient, depending on your tolerance for ingest latency on these events.
Compaction in Honeycomb is based on ingestion and event timestamps. If metric events are captured at the same time but not ingested within the same second range, they’ll land in Honeycomb as separate events. With the way CloudWatch and Firehose send those metrics, there’s usually a significant delay between events that causes less compaction in Honeycomb.
Here’s what events looked like before when sent directly to Honeycomb:
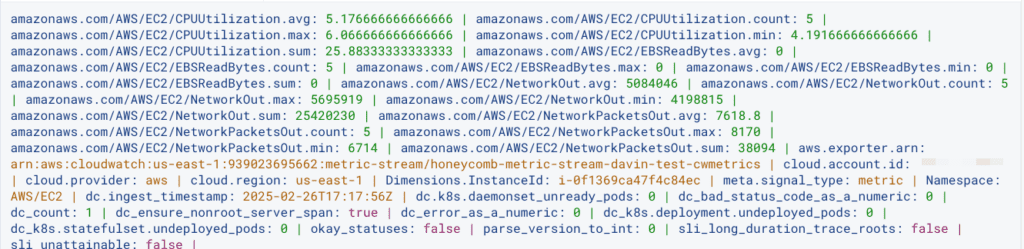
For one EC2 instance’s metrics, I got 288 events over the course of a two hour window. After putting the metrics through the Collector (with default settings on the batch processor) that was down to 201 events over a two hour period:
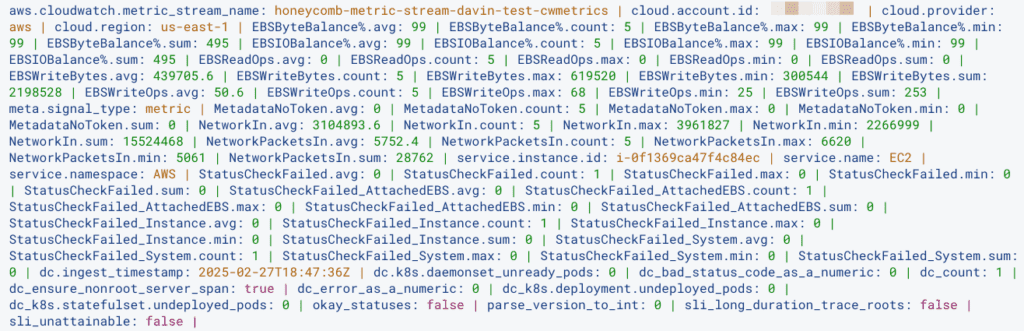
Note: Check out how much more legible those metric attributes are, too!
The great thing about the Collector is the configurability! The batch processor can batch things up in such a way that our ingest compacts the metrics even more. It does mean delaying the sending of data for several minutes sometimes, but the savings on events can be pretty significant. I used the following settings and reduced the number of events in Honeycomb down to 147 over a two hour window, for one EC2 instance:
 processors:
    batch:
      timeout: 300s
      send_batch_size: 100000
But wait, there’s more!
On a final note, the awsfirehose receiver was updated in the last few months and is under active development. It now supports a cwlogs datatype, which should allow you to receive CloudWatch logs to your Collector—and an otlp_v1 format, so you might not have to set things to JSON in your streams. I haven’t tested these myself, but am eager to hear about your experience, if you try that out!