Beyond Backend: Honeycomb for Frontend Observability is Now GA
Observability has traditionally been backend-focused, but the frontend is just as hard—if not harder—to debug and has simply outgrown current monitoring tools. Engineers working with the frontend need the ability to see every user interaction with their system—and all the rich context around it. They need observability for the frontend. Today, we’re proud to announce that Honeycomb for Frontend Observability is now generally available.

By: Winston Hearn


It’s 2025, The Frontend Deserves Observability Too
Learn MoreReal user monitoring (RUM) tools are great if you want to give your developers a very high level view of the health of your frontend. But when it comes to actually debugging issues in your web app, you’re often left piecing together outputs from browser devtools, with details (if you’re lucky) from customer support tickets to replicate issues locally in hopes of identifying the source of the issue.
Debugging Core Web Vitals (CWVs) to improve your scores can be even worse. Literally any asset or third-party service could be affecting the performance of the page, so narrowing in on what’s affecting the metrics is a cycle of guess and check.
Observability has traditionally been backend-focused, but the frontend is just as hard—if not harder—to debug and has simply outgrown current monitoring tools. Engineers working with the frontend need the ability to see every user interaction with their system—and all the rich context around it. They need observability for the frontend. Today, we’re proud to announce that Honeycomb for Frontend Observability is now generally available.
What is Honeycomb for Frontend Observability? Why is it useful?
Honeycomb for Frontend Observability gives you rich observability data out of the box that you can use to debug your CWVs and find the root cause of issues—wherever they occur in your stack—with end-to-end traces and high-cardinality data, including thousands of free custom attributes that are all available and fast to drill into.
It has two primary components: the open-source instrumentation package and the Web Launchpad in Honeycomb.
Honeycomb web instrumentation package
This open-source wrapper around OpenTelemetry’s web instrumentation provides a vendor-neutral way to instrument your web apps in under an hour. It allows you to send, in real-time, every user interaction and all the context around it to Honeycomb.
In addition to the standard OpenTelemetry auto-instrumentation, we’ve added dozens of attributes, including CWV attribution data and user interaction data such as clicks, so you know exactly what’s affecting your user experience and where you need to improve.
Custom attributes are free in Honeycomb. You can add all the custom data that matters to your business like user authentication status, entry page type, or traffic source. You can also consolidate information from other tools, like Fullstory and Amplitude, to get rich insights from correlated data with default retention on all data of 60 days.
Web Launchpad
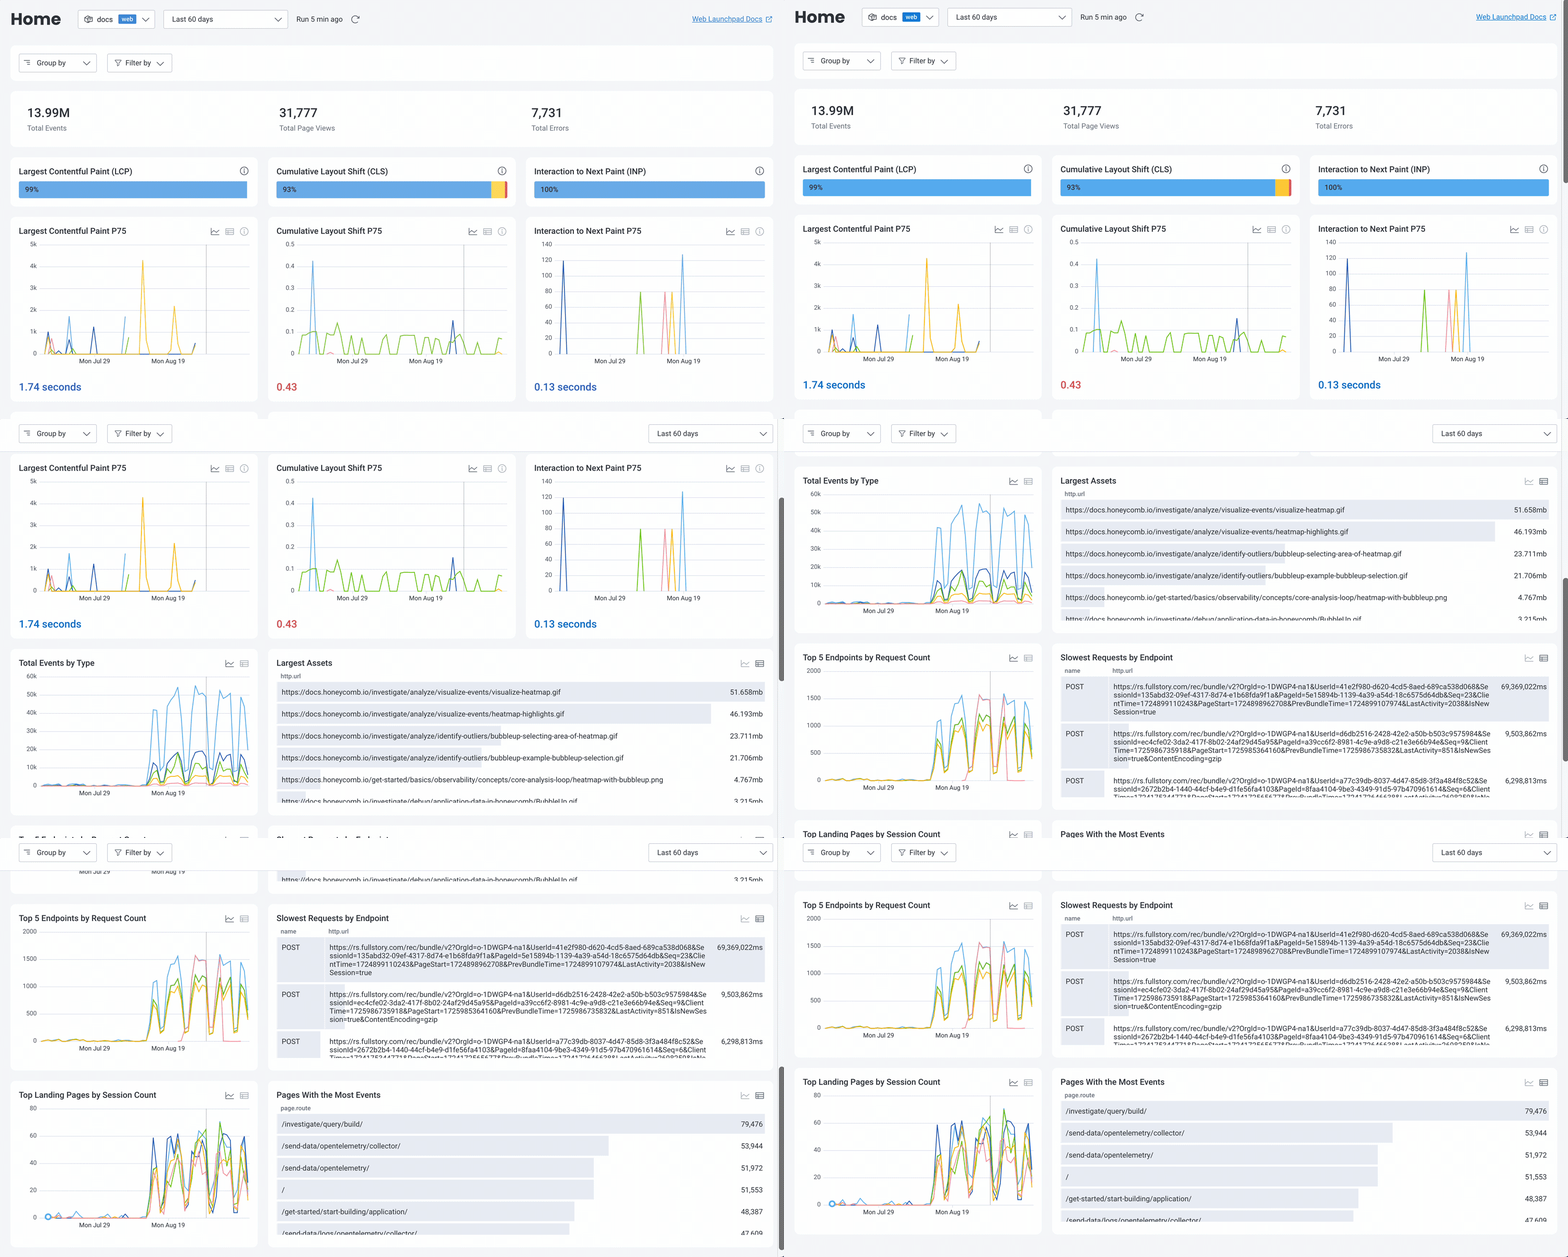
The launchpad, at first glance, resembles popular RUM dashboards, with visualizations of common performance data like CWVs.
Unlike static dashboards in RUM tools though, the Web Launchpad doesn’t pre-aggregate any data, so every visualization is a starting point. However, it’s built for high-cardinality data, which means that it doesn’t make any assumptions about what you might want to know now or in the future. You can click into it to modify the query and get richer insights at the level you need.

See it in action
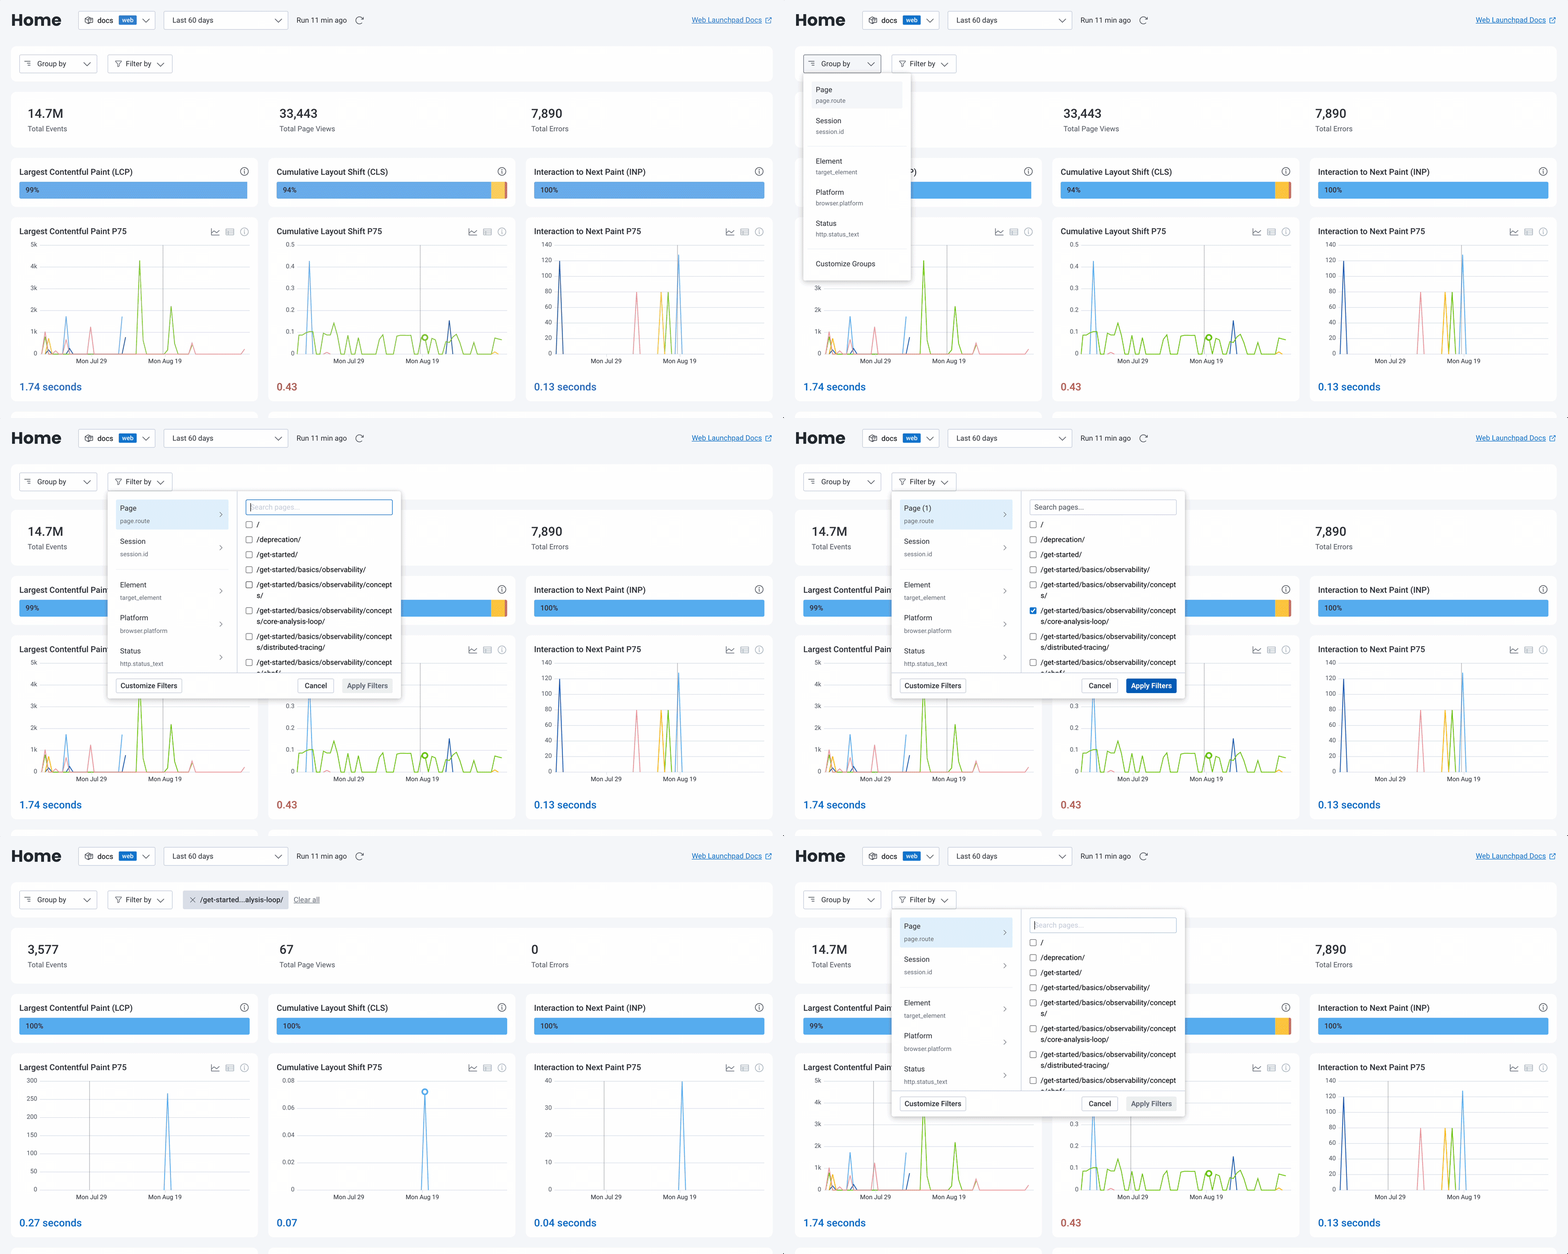
HFO, like most RUM tools, starts you at a global view of your service. Most investigations involve a specific area of your application, so you need to filter down to the level of investigation. With HFO, that’s easy: you can filter the launchpad to a specific page, browser, or any custom field you define, instantly updating all visualizations on the launchpad to just that scope.

Many RUM tools limit your ability to get at that underlying data, pre-aggregating it so it’s only available at the metric or individual session level.
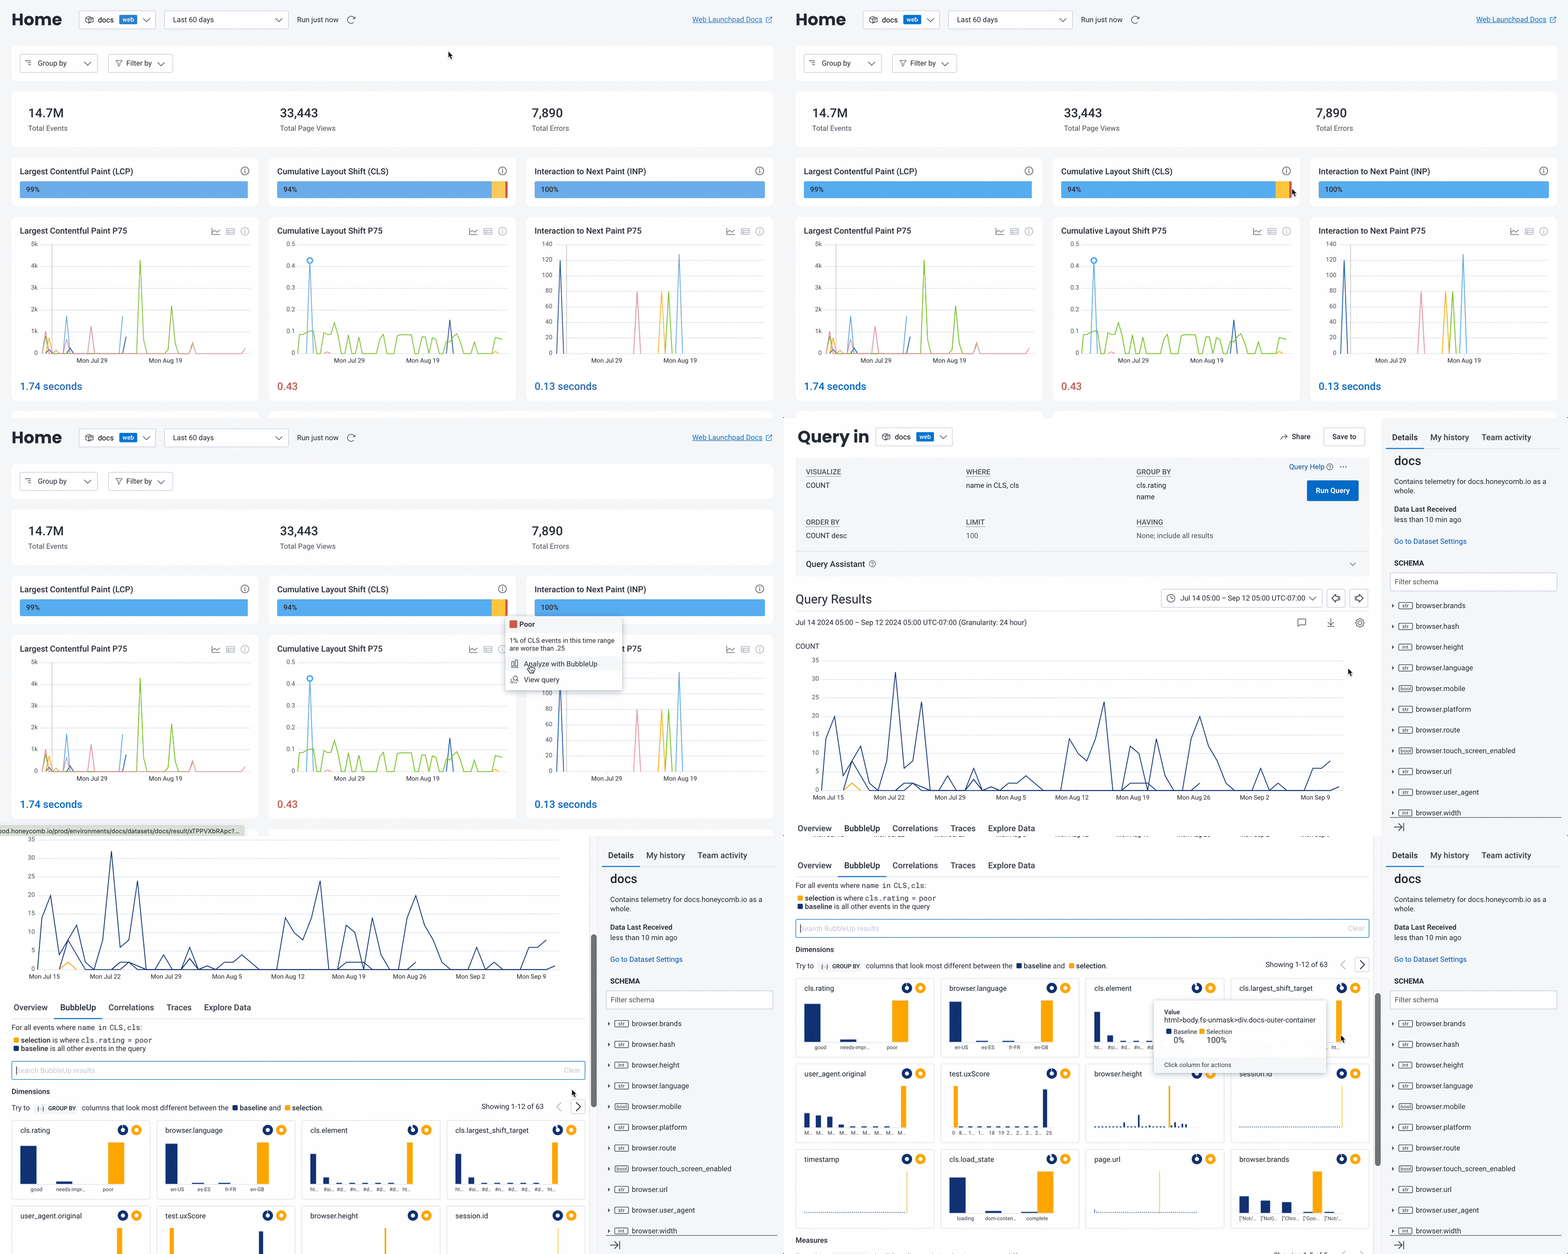
In the Web Launchpad, you can query across sessions by any of thousands of attributes to get insights into your users’ experiences. And unlike RUM tools that leave you to manually look for patterns across those individual sessions, the Web Launchpad has built-in auto-correlation with BubbleUp, our anomaly detection tool.
You can highlight any part of a visualization in BubbleUp to see what attributes are correlated for those particular data points. This makes debugging things like CWVs so much easier. Using BubbleUp, Honeycomb for Frontend Observability can show you exactly which elements and scripts are causing poor CWV scores, helping your engineers know exactly where to spend time on optimizations.

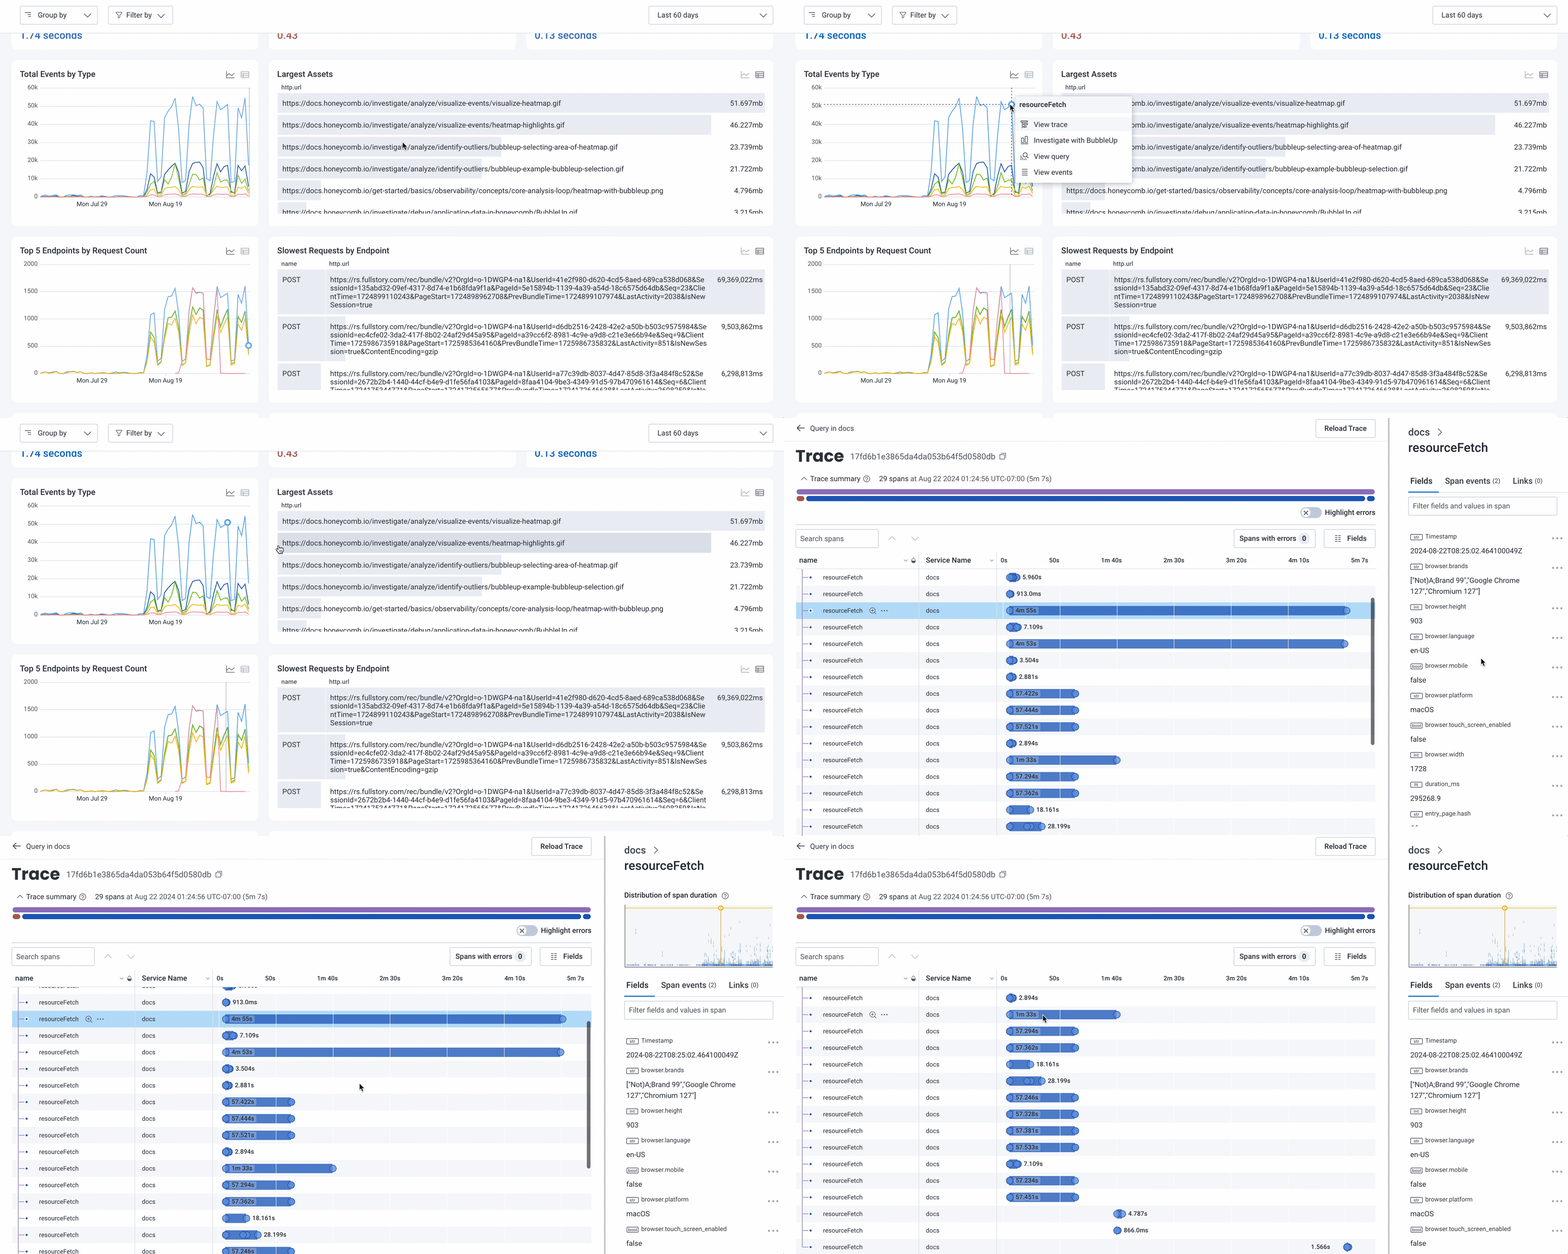
Displayed alongside your web performance data is your tracing data. If you’ve instrumented your backend, you can view end-to-end traces for more efficient investigations and greater visibility into the root cause of issues—wherever they occur. Any interesting attribute you see in a frontend trace span can become a query input in one click.

Frontend datasets in Honeycomb aren’t siloed off to just the Web Launchpad. They are also incorporated into Honeycomb as a whole, which means your entire engineering team can have a unified view of your whole distributed system with Service Map and trace waterfalls. It also allows you to set alerts for Service Level Objectives or performance budgets, so your team can have a shared understanding of how the system is performing in terms of customer impact.
In action with Iron/Out
Challenge: optimizing performance for an ecommerce enterprise
Iron/Out is responsible for optimizing the performance of websites for a leading retailer.
Their client was using Speedcurve for synthetic monitoring and Dynatrace RUM to monitor their frontends’ performance. With these tools, they could see CWV scores and other performance metrics, but finding what was hurting performance and CWV scores often required a lot of manual investigation. On top of that, compiling that data into reports was also a very manual process.
Solution: implementing Honeycomb for Frontend Observability
When Google introduced Interaction to Next Paint (INP) as a new Core Web Vital earlier in the year, most of the tools Iron/Out were using didn’t support INP, making it difficult to track and optimize effectively.
Their client was already using Honeycomb elsewhere in their stack for observability, so they were asked to evaluate Honeycomb for Frontend Observability for its potential to help them consolidate their observability tooling.
Iron/Out was impressed by Honeycomb’s ability to quickly query large amounts of performance data and show how upstream latency affected downstream user behavior. They were also excited that it supported INP, including the detailed attribution data that helps them understand the most likely causes for poor INP scores.
Results: streamlined Core Web Vitals debugging and continuous monitoring
After setting up Honeycomb for Frontend Observability, they gained access to new CWV debugging information that had previously been unavailable. An early investigative win was finding that an issue impacting their client’s INP was triggered by accepting cookies.
“Honeycomb helps us spot which page templates have issues and gives us the ability to easily query the attribution data, allowing us to dig deeper to understand what’s causing the problem and on which device,” said Sander van Surksum, Technical Lead at Iron/Out.
Along with their new CWV debugging abilities, they’re excited to use Honeycomb for Frontend Observability to gain insights into user journeys through custom metrics like ‘time to add to cart,’ which will enable targeted optimizations.
The ability to track detailed performance metrics and get precise CWV debugging information has enabled them to proactively address performance issues before they impact their client’s business.
Get Honeycomb for Frontend Observability now
Honeycomb for Frontend Observability is now generally available to Honeycomb Enterprise customers on Environments. Ready to see how it can help you improve your frontend and consolidate your observability tooling?
Book some time with us. Get your personalized demo!
Want to know more?
Talk to our team to arrange a custom demo or for help finding the right plan.