Building a Simple Synthetic Monitor With OpenTelemetry
In this post, I’ll cover what synthetic monitoring is and show an example of how you can create a simple monitor using OpenTelemetry, .NET, and an Azure function. If you only want to see how it’s built, skip ahead to building a synthetic monitor.

By: Martin Thwaites


It’s 2025, The Frontend Deserves Observability Too
Learn MoreUsing server-side telemetry to understand what’s going on inside your system is incredibly valuable, but what about the responsiveness the user actually sees?
In this post, I’ll cover what synthetic monitoring is and show an example of how you can create a simple monitor using OpenTelemetry, .NET, and an Azure function. If you only want to see how it’s built, skip ahead to building a synthetic monitor.
What is synthetic monitoring?
At a high level, synthetic monitoring means generating artificial interactions with your service or system with the purpose of understanding something about the system. For example, whether your service is up, or if the response times are acceptable.
Typically, you can do this in three ways:
- Generating a new /status or /health endpoint
- Using the existing “main” or “home” page and checking for a valid response
- Using multiple pages chained together to represent a full customer journey
New to Honeycomb? Get your free account today.
Why is synthetic monitoring important?
There are normally two networks that influence a user’s experience of your application:
- The first is your internal network. This includes all response times between your microservices. You can get great visibility by leveraging distributed tracing.
- The second is the general internet, or what is sometimes called “the last mile.” Unfortunately, you won’t see this in your traces—but there’s something else you can use: RUM or frontend observability. These tools show you what actual users see. They provide an amazing level of detail to understand if your system is effective.
The issue with monitoring from real users is that there is almost no consistency of performance between two requests. They’re influenced by everything from browsers your users use to the users’ own connectivity to the internet. As soon as you bring mobile networks into the equation, you have no chance of creating a consistent view. This is where synthetic monitoring comes in.
Uptime vs customer experience
In my opinion, synthetic monitoring falls into two camps. The first is uptime monitoring, where what we care about is if we received a valid response, and how fast it was. The second is whether the system is functioning correctly.
If all we care about is uptime, then generating an endpoint with a small footprint may be enough. But generally, the first thing that happens when an uptime alert fires is that the engineers check whether they can hit the website.
What if we could automate that part?
This is where the second type of synthetic monitoring comes into play: we use the existing calls a user might make that exercise a large part of the system. This could be the homepage, a product page, or maybe just a contact us page. The key is that it’s a page or endpoint that tells you the system is working together—not just that an endpoint works.
This is important because generally, when developers generate a new endpoint for uptime monitoring, they neglect to have that endpoint check for errors like connecting and selecting data from the database—but also other types of connections or configuration issues. This is why a check that involves the interactions that a customer would do is far superior.
Building a synthetic monitor
Building and deploying a synthetic monitor is easy now that we have services like Azure functions and AWS Lambda, and frameworks like OpenTelemetry.
In this example, I’m going to create an Azure function in .NET to do the call.
The repository for this code is on GitHub so you can see the full code example. In this post, I’ll pull out the most relevant parts to give you an idea of what’s interesting and important.
At the core of this solution is generating a new span for each call out to our service:
    public async Task<ActivityContext> MonitorUrlAsync(Uri uri)
    {
        using var activity = DiagnosticConfig.Source.StartActivity($"UrlMonitor {uri.OriginalString}");

        activity?.SetTag("synth.monitored_url.full", uri.OriginalString);
        activity?.SetTag("synth.monitored_url.scheme", uri.Scheme);
        activity?.SetTag("synth.monitored_url.host", uri.Host);
        activity?.SetTag("synth.monitored_url.port", uri.Port.ToString());

        var response = await httpClient.GetAsync(uri);
}You’ll notice that the name part of the span/activity includes data that’s also in the attribute named synth.monitored_url.full. Having an attribute with that data means we can aggregate, filter, and group that data much better, while also being able to see the URL in a trace view.
After we’ve made the call, we then need to augment our span with the response information:
        activity?.SetTag("http.response.code", response.StatusCode.ToString());
        activity?.SetTag("http.response.size", response.Content.Headers.ContentLength?.ToString() ?? "0");
        activity?.SetTag("http.response.type", response.Content.Headers.ContentType?.ToString() ?? "unknown");
        activity?.SetTag("http.response.length", response.Content.Headers.ContentLength?.ToString() ?? "0");
        activity?.SetTag("http.response.last_modified" ,response.Content.Headers.LastModified);


        if (response.IsSuccessStatusCode)
        {
            activity?.SetStatus(ActivityStatusCode.Ok);
        }
        else
        {
            activity?.SetStatus(ActivityStatusCode.Error);
}From here, we need to configure an Azure function on a timer trigger to hit the URL and send out the telemetry data. I won’t go through the details of setting up the OpenTelemetry SDK—there are many tutorials about that.
public class Function(IOptions<MonitorSettings> settings, MonitorManager MonitorManager)
{
    [Function("Function")]
    public async Task Run([TimerTrigger("*/5 * * * * *")] TimerInfo myTimer)
    {
        var url = string.IsNullOrEmpty(settings.Value.Url);

        using var activity = DiagnosticConfig.Source.StartActivity($"UrlMonitor {uri.OriginalString}");

        // Do call, add attributes, etc.
    }
}This will run the function every five seconds. By default, Azure functions’ runtime will flush the data on exist. If that doesn’t work, you can always inject TracerProvider and call a flush since we don’t need to include the time it took for the timer itself to run.
public class Function(
// ..,
TracerProvider tracerProvider)
{
    [Function("Function")]
    public async Task Run([TimerTrigger("*/5 * * * * *")] TimerInfo myTimer)
    {
        // do stuff

        tracerProvider.ForceFlush();
    }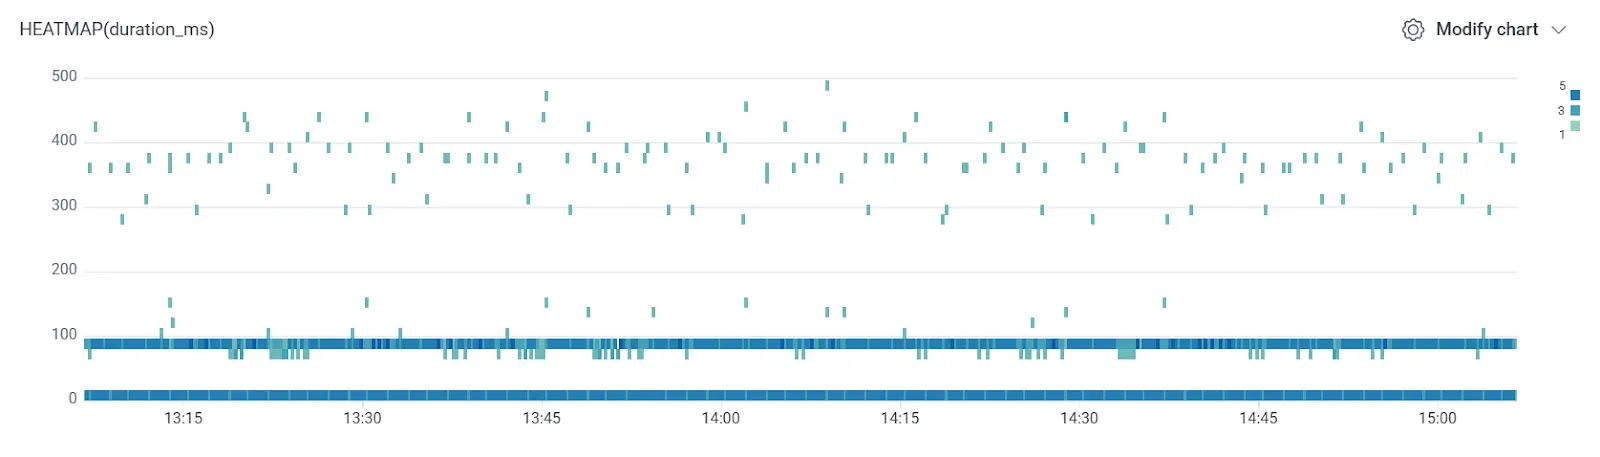
}We now have rich data that we can use to create alerts from triggers, or even SLOs.
There is no limit to where you could run these checks. You could do them from multiple clouds, you could do them every second or every minute—it’s 100% configurable by you.
Conclusion
Functions-as-a-Service solutions like Azure functions and AWS Lambda make for a fantastic solution to monitor the uptime of sites. Coupling that with Honeycomb’s triggers on our free tier, you can make an effective uptime monitoring system. With our pro tier, you can couple these with SLOs to make your alerting more on-call friendly.
A word of caution: if you want to effectively monitor uptime, run your monitoring in a different cloud provider than your application. This will ensure that you’re more closely mimicking what a user would say, rather than doing it from within your provider’s network. For bonus points, you could run the checks from your staff’s home connections!
Want to know more?
Talk to our team to arrange a custom demo or for help finding the right plan.