Configuring a React Application with Honeycomb For Frontend Observability
In this article, I’ll lay out approaches for wiring Honeycomb to client-side only React so you can ingest your telemetry into Honeycomb and take advantage of the Web Launchpad. This telemetry sends semantically-named attributes, and can be used with any OTLP destination.

By: Ken Rimple


It’s 2025, The Frontend Deserves Observability Too
Learn MoreAre you trying to wire your React application to Honeycomb, but running into some challenges understanding how our instrumentation works with React?
In this article, I’ll lay out approaches for wiring Honeycomb to client-side only React so you can ingest your telemetry into Honeycomb and take advantage of the Web Launchpad. This telemetry sends semantically-named attributes, and can be used with any OTLP destination.
These examples use a React application created with Vite. The advice here applies to React apps that are not using server-side rendering. Watch this space for more information about using Next.js.
Let's get started by installing the appropriate libraries.
Step 1 - install Honeycomb SDK and auto-instrumentation libraries
cd [your project name]
npm install @honeycombio/opentelemetry-web
npm install @opentelemetry/auto-instrumentations-webConfiguring OpenTelemetry in the Browser
You'll need to configure OpenTelemetry in your browser when booting React. For Frontend Telemetry, Honeycomb provides the Honeycomb Web SDK, which makes initializing OpenTelemetry easier, setting up sensible defaults, and adding some helpful instrumentation.
There are several places where you can configure the HoneycombWebSDK:
- In the
main.tsfile, as shown in Step 2 below. This has the benefit of automatically running once for your browser session, and is fully configured before any services start. - In a component that is mounted somewhere in the root-level of your component tree and only installs the SDK.
- In the top-level component itself.
The objective is for initialization in the client to happen only once.
Easiest approach: Configure Honeycomb Web SDK before booting React
Let's explore the most direct way to configure the HoneycombWebSDK, just before bootstrapping a React application.
First, we’ll create a file with a function that does the wiring (see our docs and additional samples for more details):
src/otel-config.ts|.js: Step 2 - create defaults for instrumentation libraries
import { HoneycombWebSDK } from '@honeycombio/opentelemetry-web';
import { getWebAutoInstrumentations }
  from '@opentelemetry/auto-instrumentations-web';


// some telemetry instrumentation requires default settings
// so we create a set of sensible defaults.
const defaults = {
    // don't create spans for all of the network traffic, otherwise
    // we'll get 10x the spans we normally care about
    ignoreNetworkEvents: true,


    // Outgoing service calls to servers will contain the
    // traceparent header to pass our trace information inward,
    // so our fetch requests will be part of an end-to-end trace,
    // only if the protocol/host/port is listed below.
    // you may use a wildcard, or list specific hosts.
   propagateTraceHeaderCorsUrls: [
        // Example: add Traceparent to all outgoing fetch/XMLHttpRequest calls
        /.*/g,
        // Add Traceparent to one host - note the escape characters
        // before each slash. If your host communicates with TLS/HTTPS
        // use https instead of http
        /http:\/\/localhost:8081/
    ]
}Note: You must add your backend API endpoints or host and port names as URLs in propagateTraceHeaderCorsUrls entries, so that API calls made from React fetch or XMLHTTPRequest calls contain the proper W3C traceparent headers to any backend services you call. This way you will see full end-to-end traces.
Next, you'll initialize the HoneycombWebSDK. Be sure to create a Honeycomb ingest key and copy it to the code below. Your key will be shipped with your web application. This is generally considered an acceptable risk, since the worst someone could do is send more data.
src/otel-config.ts|.js: Step 3 - initialize the HoneycombWebSDK
...


export default function installOpenTelemetry() {
  try {
    // this SDK installs OpenTelemetry-JS for a web browser, and
    // adds automatic instrumentation for Core Web Vitals and other
    // features.
    const sdk = new HoneycombWebSDK({
	apiKey: '<your honeycomb api key here>',
      serviceName: 'react-frontend',
      instrumentations: [
        getWebAutoInstrumentations({
          '@opentelemetry/instrumentation-xml-http-request': defaults,
          '@opentelemetry/instrumentation-fetch': defaults,
          '@opentelemetry/instrumentation-document-load': defaults
          '@opentelemetry/instrumentation-user-interaction': {
             enabled: true,
             eventNames: ['click', 'submit', 'reset']
          }
        })
     ]
   });

   // start up the SDK, wiring up OpenTelemetry for JS
   sdk.start();
   } catch (e) {
      console.log(`An error occurred wiring up Honeycomb...`);
      console.error(e);
   }
}Finally, call the function in your React bootstrap file to initialize OpenTelemetry before it starts:
main.ts|.js: Step 21 - wire up telemetry before starting React
import { createRoot } from 'react-dom/client'
import './index.css'
import App from './App'
import {StrictMode} from "react";

// highlight next line (if possible)
import installOpenTelemetry from './otel-config';

// highlight next line (if possible)
installOpenTelemetry();

// now, boot React!
createRoot(document.getElementById('root')!).render(
    <StrictMode>
      <App />
    </StrictMode>
)Viewing telemetry for a React application in Honeycomb
If you have a standard Honeycomb account, you can use web telemetry along with your other telemetry data.
Run a Honeycomb query
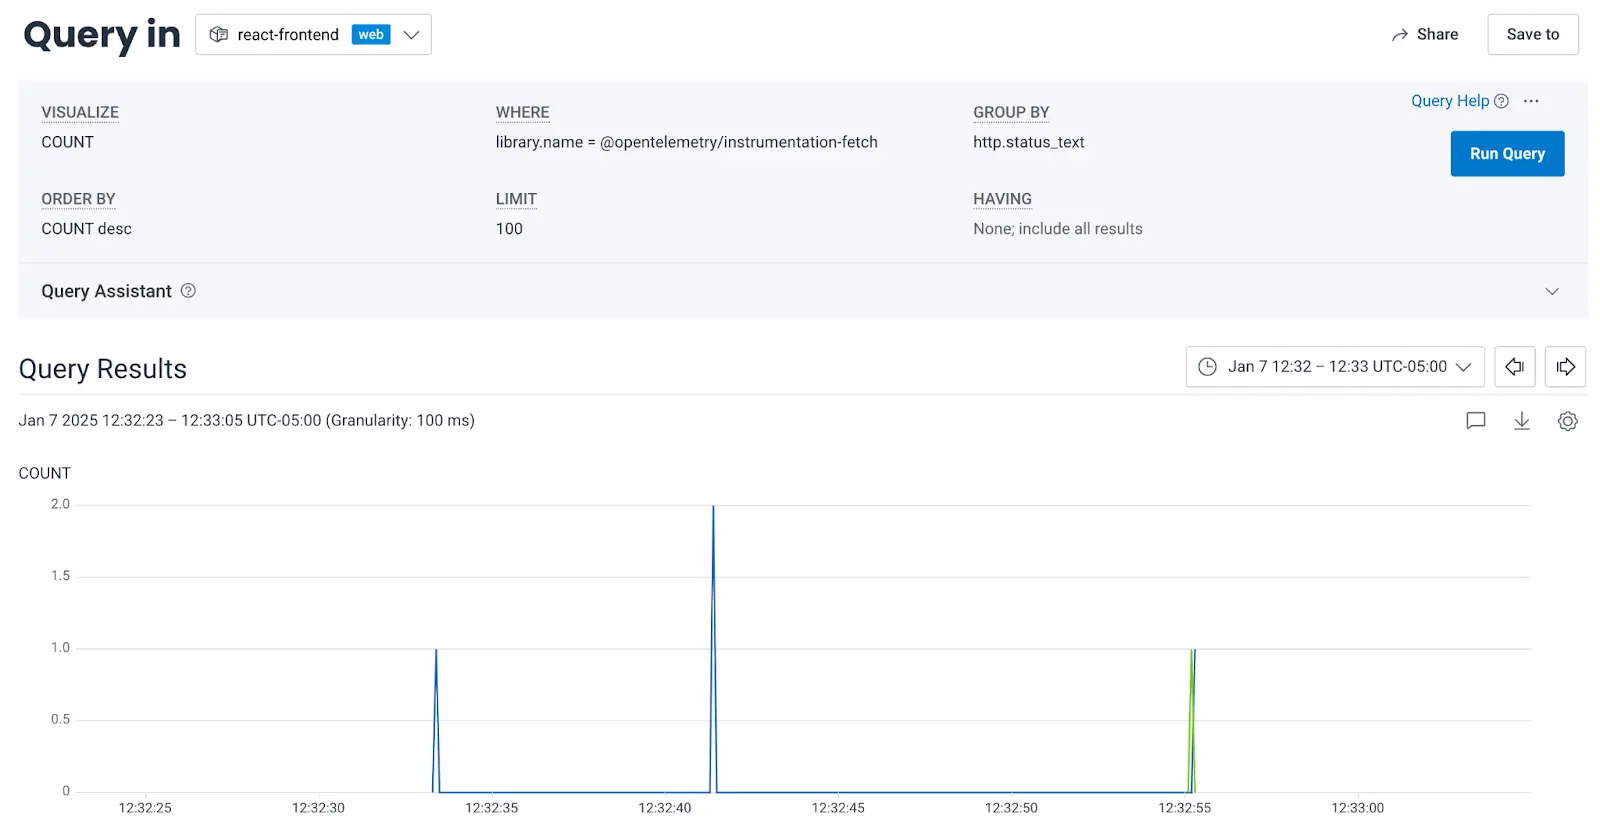
For this example, I’ll use the Query Builder against our datasource react-frontend (which we defined in our instrumentation as our service-name), using:
- Visualization: COUNT (how many in each time period)
- Where: library.name = @opentelemetry/instrumentation-fetch (only shows fetch calls)
- Group By: http.status_text (to view good and bad calls)
This query looks like this:
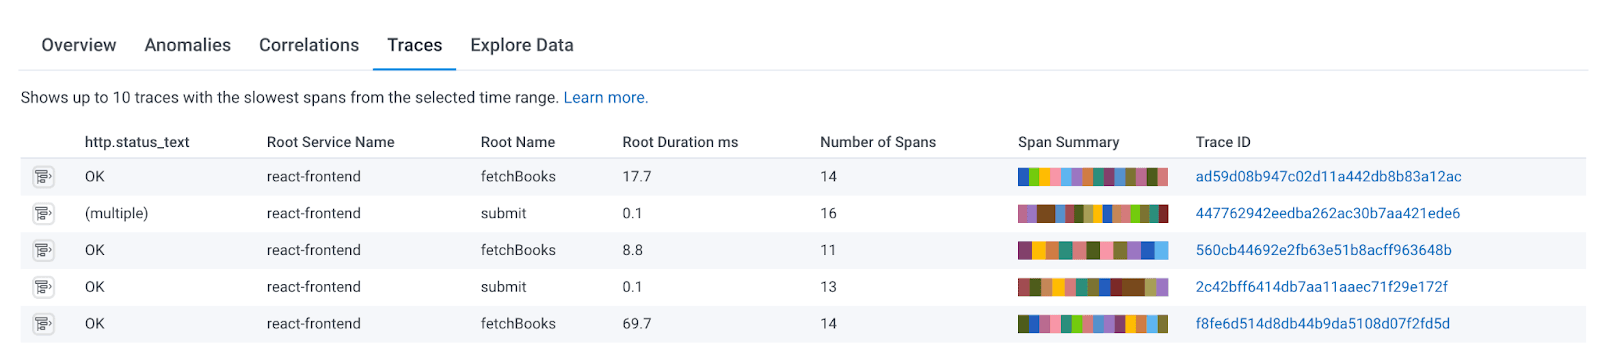
If I scroll down a bit, I see options to view traces. Here they are:
View an OpenTelemetry trace in Honeycomb
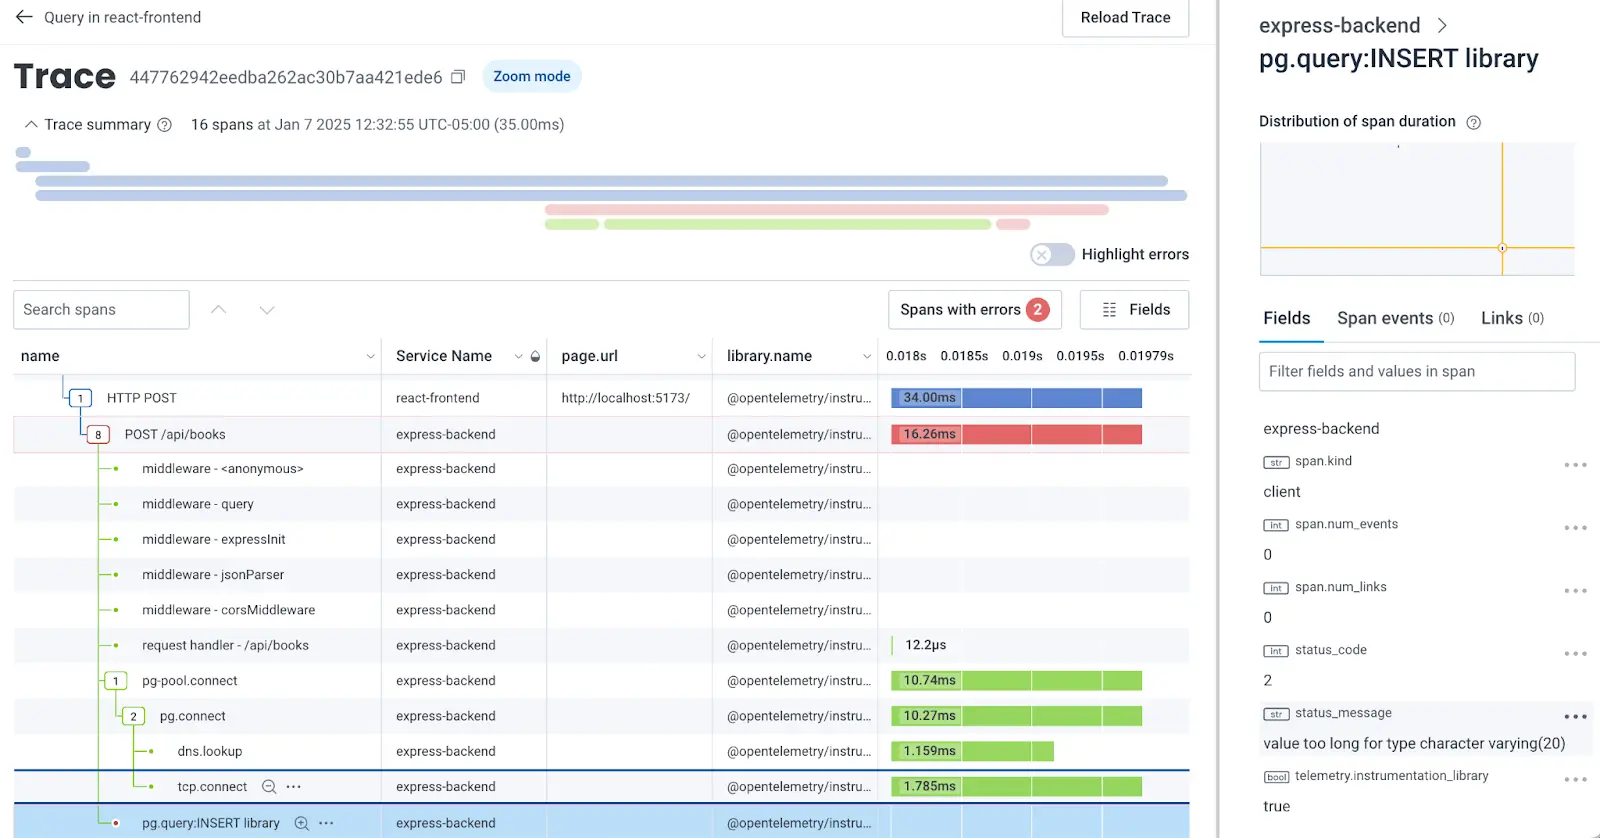
I clicked on one of the trace IDs that had a root name of Submit, which was triggered by clicking a form submit button in a frontend form. Since I’ve configured Honeycomb to include user event tracing, a button click is traced by default.
This trace shows that we encountered a database error that we didn’t plan for, and that error failed our POST. Clicking on the span near the bottom shows the error message as one of the attributes (status.message on the pg.query: INSERT library span):
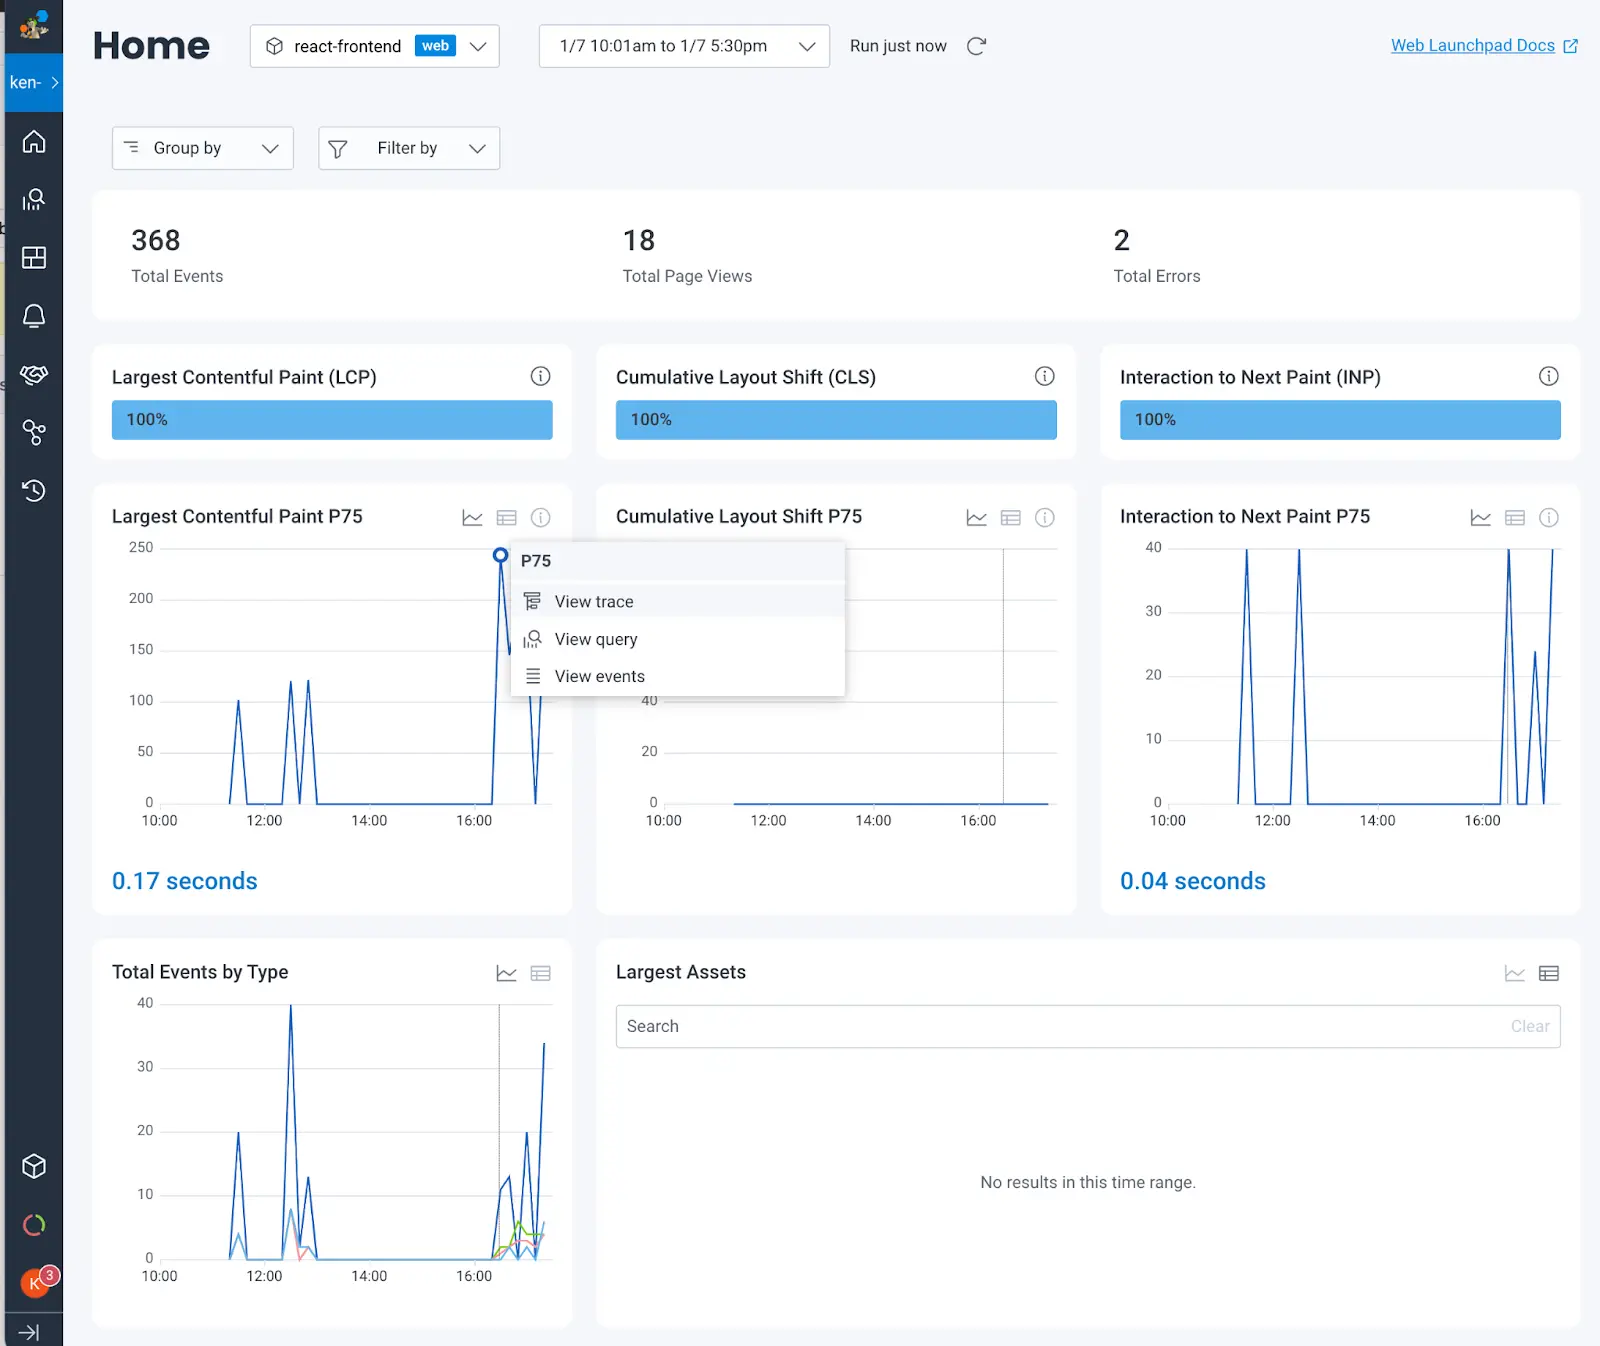
Viewing the application from the Honeycomb for Frontend Observability Web Launchpad
In an account configured with Honeycomb for Frontend Observability, the environment landing page becomes the Web Launchpad. Here, you can see helpful charts and statistics based on the telemetry emitted from the HoneycombWebSDK via opentelemetry-js:
But I want to create a component that does the initialization
Alternatively, you might approach instrumentation by mounting a component. Maybe you want to defer telemetry until a particular parent route opens up (do you?).
While instrumenting after the React application has begun is not necessarily a problem, it is less direct. However, samples exist that show this approach, so let’s review it.
In the component’s render method, you could create an effect to boot React on the mounting of a component. Simply call the Collector setup method in a useEffect hook on the way up. Note that you don’t provide any values in the hook’s dependency array, so the effect never re-runs.
ObservabilityConfigurer.ts: Call the instrumentation script on an initial loading effect
import { installOpenTelemetry } from './otel-config';

export default function ObservabilityConfigurer() {
    useEffect(() => {
        installOpenTelemetry();
   }, []);
   return null;   // render nothing, this is just a component
                  // to facilitate wiring up Honeycomb
}You can then mount the component within your top-level component. The useEffect hook above ensures that this only runs on the initial render of your component.
src/Application.tsx: Now, call your top-level component
import ObservabilityConfigurer from './ObservabilityConfigurer';

export default function App() {
    return (
        <>
          <ObservabilityConfigurer />
          {/* Your top-level components here */}
        </>
    );
}Go with the simplest approach that makes sense for you, and do it as early as you can to avoid missing any key telemetry. Executing the script before loading React is the easiest way to isolate it from the rest of your components.
For more help
You can read Honeycomb's documentation on Frontend Observability to learn more about how to instrument a frontend JavaScript application.
Have questions about instrumenting React, Angular, Vue or server-rendered applications such as Next.js with OpenTelemetry? Need help with troubleshooting your configuration or instrumentation or using Honeycomb? You can request office hours with me, check our detailed documentation, or join the Honeycomb Pollinators Slack. I’ll be happy to help you get going.
Want to know more?
Talk to our team to arrange a custom demo or for help finding the right plan.