Debugging Kubernetes Autoscaling with Honeycomb Log Analytics
Let’s be real, we’ve never been huge fans of conventional unstructured logs at Honeycomb. From the very start, we’ve emitted from our own codestructured wide events and distributed traces with well-formed schemas. Fortunately (because it avoids reinventing the wheel) and unfortunately (because it doesn’t adhere to our standards for observability) for us, not all the software we run is written by us. And Kubernetes is a prime example of such a load-bearing part of our infrastructure.

By: Liz Fong-Jones
Let’s be real, we’ve never been huge fans of conventional unstructured logs at Honeycomb. From the very start, we’ve emitted from our own codestructured wide events and distributed traces with well-formed schemas. Fortunately (because it avoids reinventing the wheel) and unfortunately (because it doesn’t adhere to our standards for observability) for us, not all the software we run is written by us. And Kubernetes is a prime example of such a load-bearing part of our infrastructure.
Following our recent migration to the new R8g and M8g instance families powered by AWS Graviton4 processors, I needed to debug issues with why the Cluster Autoscaler (CAS) wasn’t shrinking the clusters as far down as we expected. Our complete workload was running on the more efficient processors, but we needed to optimize further to get the full return on investment. However, debugging CAS turned out to be challenging because of the kinds of telemetry it does and does not emit. Before Honeycomb for Log Analytics, I had to use the cumbersome kubectl logs functionality to investigate CAS. After, I was able to achieve significantly better visibility into our logs by slicing and dicing in the new Explore Data view alongside Honeycomb charts, and I immediately pinpointed the problems.
Challenges in understanding Kubernetes
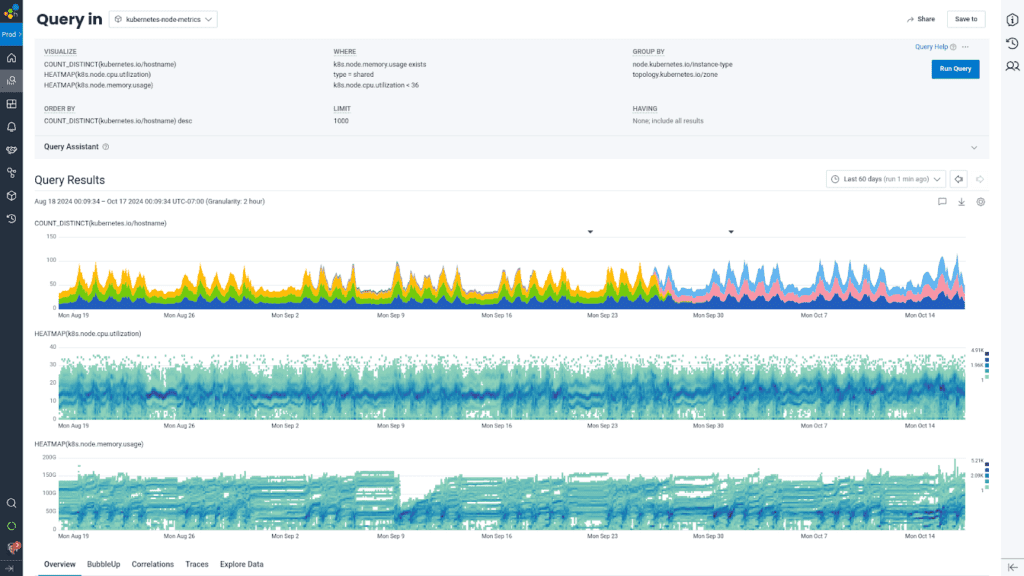
We resisted adopting Kubernetes for many years. But in the end, the ease of orchestrating version upgrades and the ability to bin-pack processes won over any challenges with monitoring and management. With the OpenTelemetry Collector host metrics receiver, we were able to gather important metrics relating to CPU and RAM utilization of each pod and host.
One of the remaining pains of integrating Kubernetes infrastructure monitoring into Honeycomb’s application-focused, tracing-centric world has been ensuring we have sufficient data about internal Kubernetes processes such as the Cluster Autoscaler. The mission-criticality of CAS is that if it breaks, you’re unable to spin up new nodes quickly enough to meet a surge of customer traffic, or you hold onto unused instances for too long over a night, weekend, or holiday and pay too much money on your compute bill.
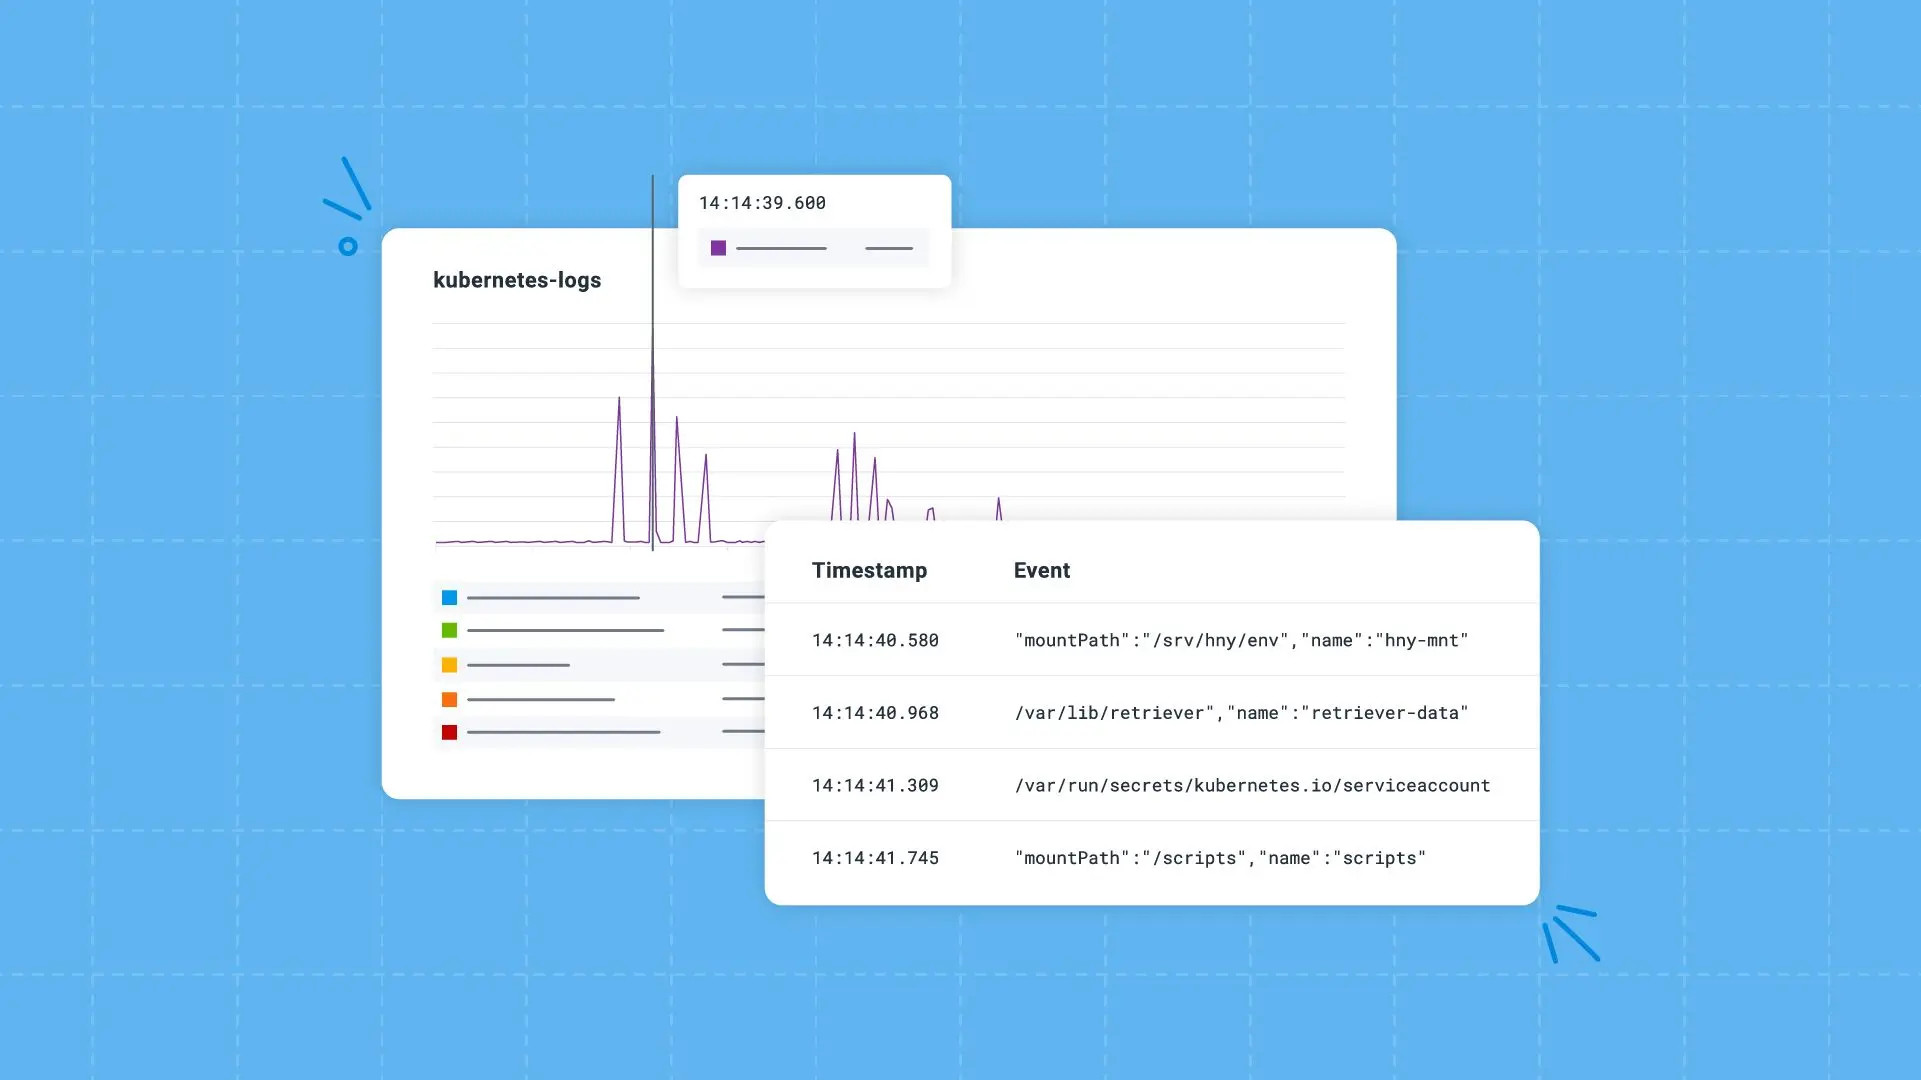
Understanding what CAS—and other internal Kubernetes processes—are doing is crucial to managing your fleet’s reliability and efficiency. These processes do emit lightly structured JSON logs, but the structure only consists of a “log” field containing freeform text, the log level, timestamp, and what file and line number the log was emitted from.
Prior to Honeycomb for Log Analytics, it was cumbersome to page through logs in Honeycomb, involving both the custom Honeycomb Kubernetes Agent and raw data view. I’d often resort to using the kubernetes-logs dataset in Honeycomb to generate a list of 1000 rows to download back into JSON format, kubectl logs -n kube-system to live tail, or directly downloading these logs from Fluentbit/S3 when I needed to look at longer time ranges. When you have to use jq and less to flip through logs while everything else is in Honeycomb, it creates a disjointed experience.
Life after Honeycomb for Log Analytics
With the general availability of the logging signal in the OpenTelemetry Collector and the launch of Honeycomb for Log Analytics, these additional steps in my workflow are no longer necessary. I’m able to not just interact with the logs as I could in the console, but do much more advanced search across gigabytes of data, graphing to pick out trends in the patterns by log source, and even on-the-fly transforms of the data to pick out structure from the noise.
For collecting data and getting rid of the Honeycomb Kubernetes Agent and Fluentbit, we were able to emit OTLP logs with this snippet added to the config of the OpenTelemetry Collector we already run as a daemonset on our cluster:
  presets:
    logsCollection:
enabled: trueWith the data flowing, all I had to do was load it up into Honeycomb for Log Analytics’ Explore Data view, configure my columns to show only the relevant log fields, and exclude the lines unrelated to the scaling functionality. I could see some improvements I wanted to make to telemetry quality, so I wrote a few derived columns to post-facto extract the values from the logs with regex. Then, I was able to identify a population of instances that were safe to scale in by raising our utilization threshold and tweaking some job reservation sizes.
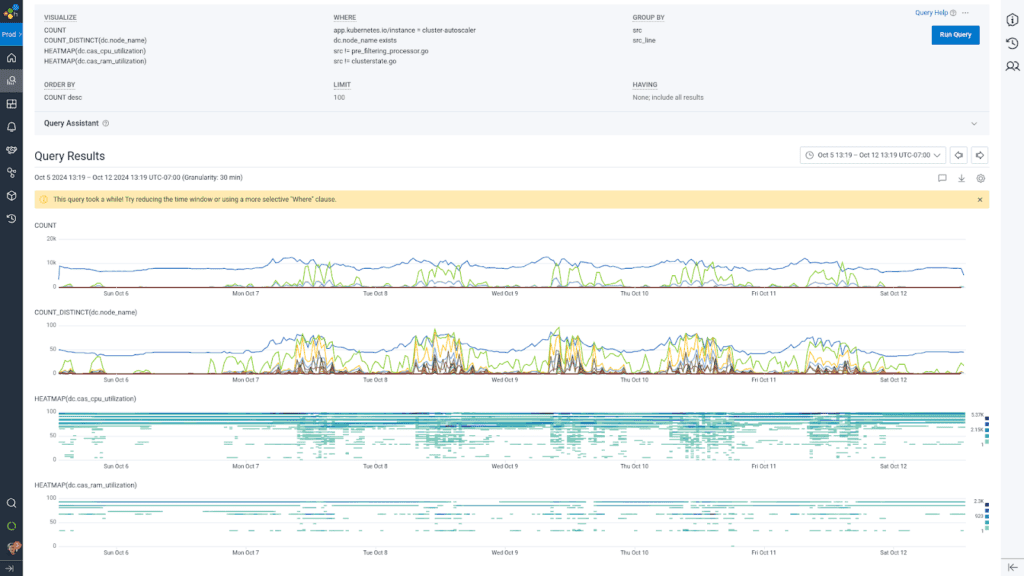
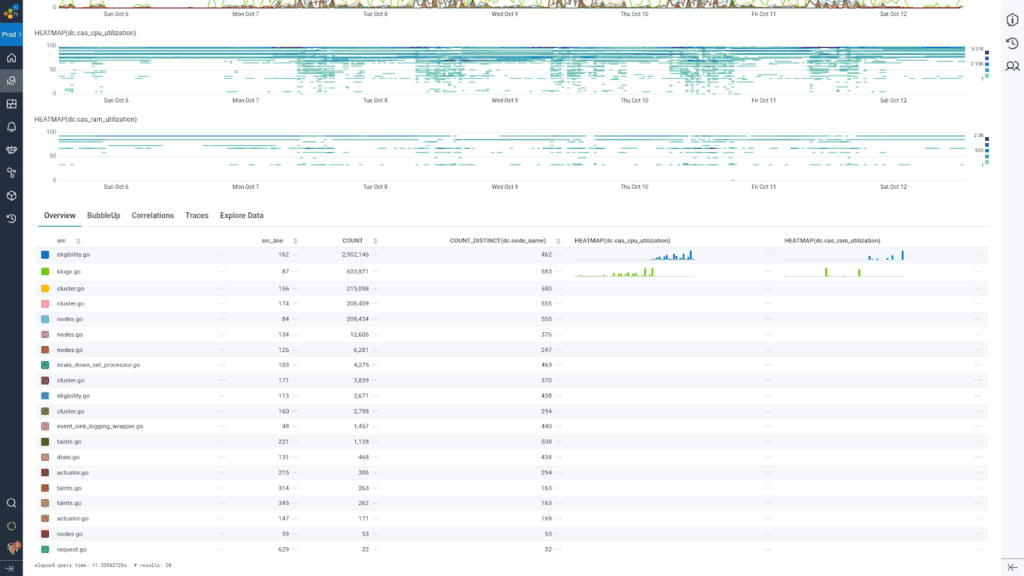
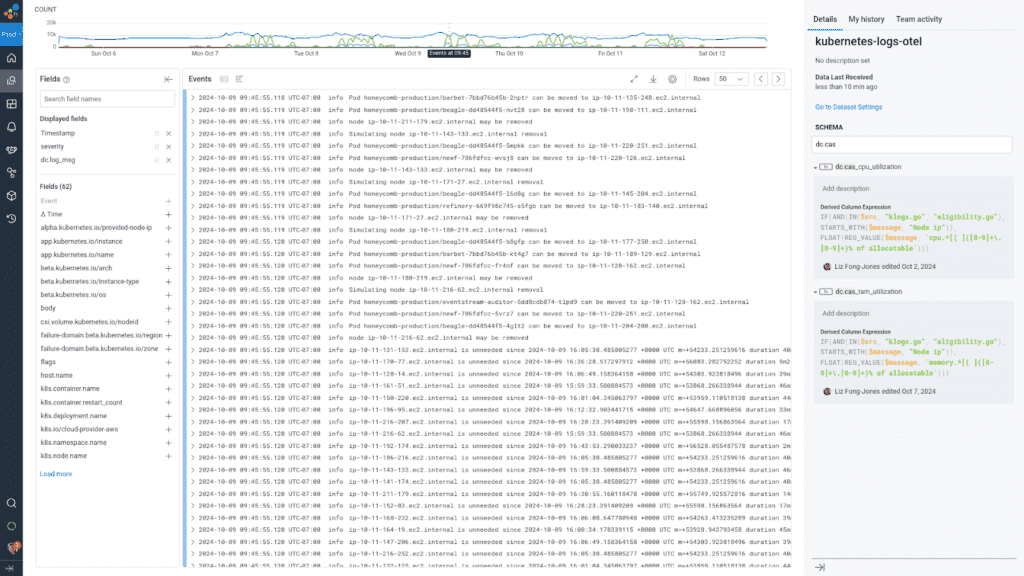
My analysis journey with Honeycomb for Log Analytics helped me find how many nodes were candidates eligible for removal, why certain nodes appeared to be underutilized yet were not eligible for removal, and the overall health of the cluster auto-scaler. I could drill down line by line into not just the first 1000 rows of the result set, but jump to a specific time within the results to further determine what was going on during a particular scale-up or scale-down event.
We get the best of all the worlds: being able to examine line-by-line what happened, and see the forest for the trees with the Honeycomb interactive querying experience. BubbleUp anomaly detection allowed us to draw a box around the heatmap lines indicating low utilization, and highlighted for us which hosts were the outliers to investigate and follow specifically through the instance lifecycle.
Conclusion
What’s awesome about this is that it provides an on-ramp into the full structured logging experience by being able to gradually pull data out of the unstructured fields into structured fields. Even if you’re not comfortable writing the Honeycomb derived column expressions yourself, you can use our derived column management APIs to calculate fields that suit your needs for making data understandable. Of course, it’s best to structure the data further upstream, but it’s harder to tweak once the data is formatted. Once you’re happy with your transform rules, you can use the Honeycomb Telemetry Pipeline’s logs processing capabilities to pull the fields out at produce time rather than on-demand by Honeycomb at query time.
Start sending Kubernetes logs to Honeycomb today.
Want to know more?
Talk to our team to arrange a custom demo or for help finding the right plan.