Dogfooding for Deploys: How Honeycomb Builds Better Builds with Observability
Observability changes the way you understand and interact with your applications in production. Beyond knowing what’s happening in prod, observability is also a compass that helps you discover what’s happening on the way to…

By: George Miranda

Observability changes the way you understand and interact with your applications in production. Beyond knowing what’s happening in prod, observability is also a compass that helps you discover what’s happening on the way to production. Pierre Tessier joins us on Raw & Real to talk about how Honeycomb uses observability to improve the systems that support our production applications.

Building in the dark
To kick off the conversation around what deploys look like for Honeycomb, Pierre shows real deployment data from Dogfood–the Honeycomb environment that our team uses to look at the behavior of Honeycomb itself in production. By turning on Markers, we see that the last few days of activity contain numerous deployments: several times a day, including Fridays, and (unfortunately!) sometimes even weekends.
Markers are useful ways to spend less time guessing and more time knowing exactly what’s happening with your deployments. Pierre demonstrates two tangible ways to make that happen.
Identifying and fixing bottlenecks
Raw & Real conversations are based on live production data. In the last week’s worth of data, Pierre found an interesting query that occasionally resulted in significantly slow page load times. He shows a heatmap analysis that, at first glance, clearly contains outliers that would explain the slow performance–sometimes taking about 20s to complete. By clicking on one of those outliers, Honeycomb automatically opens up a trace view showing the different spans involved in rendering those results. Just one span, a particularly old query statement, took about 16.5s to complete.
Here’s a video snippet that shows Pierre clicking through from the heatmap to the trace view:
Honeycomb is not immune to technical debt. This particular statement had long since become obsolete and, presently, there were much more efficient ways to get the same data this query presented. This particular query was in an infrequently accessed part of the Admin UI. However, once the investigation started, the problem surfaced quickly. A change was developed, reviewed, approved, and deployed. Using Markers, Pierre shows us the change was verified to work because load times dropped from about 20s to 4s-5s. Importantly, that improvement reduced friction for many of our teammates. When the process of sweeping up tech debt can happen quickly, there’s a noticeable positive impact we feel whenever using our systems. Removing those pesky little tolerations to which we’ve become accustomed doesn’t just have a technical impact, it also just feels good to know we made life better for our team.
Markers help you clearly correlate changes in application performance with changes introduced in your deployments.
Understanding your build pipeline
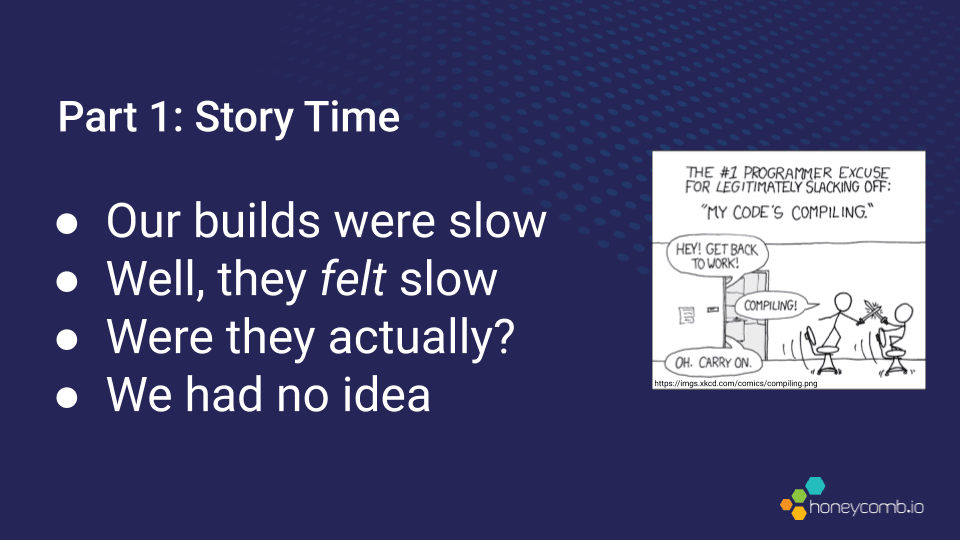
Multiple deployments per day mean that we spend quite a bit of time building releases. Is a two-hour build okay? What about a two-minute build? Oftentimes, we don’t know and gauge results based on the overall consistency of time a build takes. Has it been about 15m every time? As long as the build took about that same amount of time, then it’s probably fine, right? ¯\_(ツ)_/¯
Pierre recounts a tale about Honeycomb noticing long build times, but having no clear visibility into exactly where the bottlenecks were. Our build pipeline would spit out all sorts of logs and statements, but those weren’t the most useful for understanding each event in the build process. Builds are basically a number of different events: initiate a process, run some tests, restart a service, etc. By bookending each build step in a wrapper that starts and stops a span for each event, each build can now be seen as a trace.
Pierre uses trace views to show us a variety of build types and illustrates that while each is different, they often share some of the same components. With tracing, we can see that our test suite was not only taking up a significant portion of the build but that the duration of the test suite during our builds was also gradually increasing over time.
With a clear view of what was happening in each build, our team chose to move away from a serialized build pipeline and adopt one that was more concurrent. With the new approach, we saw an immediate drop in build times. On top of that, we gained way more headroom: the test suite (duration? not sure now) could grow 4X before it affected overall build times.
With observability, our team could make data-driven decisions about where to budget the right investments. Rather than focusing on testing optimizations that would have delivered incrementally better gains, we could see that the shift to more concurrent builds delivered a much higher impact with more breathing room. We now use SLOs to determine if work needs to be focused on optimizing builds because something is taking significantly longer.
Ben Hartshorne shared more details about this story at QCon SF 2019.

About Raw & Real
Raw & Real is informative, short, and to the point. We sit down to have informal chats about one key aspect of using Honeycomb that might help you uncover new ways to use Honeycomb for yourself. It’s not a presentation. It’s not a webinar. There’s no script. It’s just raw and real conversations about how we use Honeycomb to help ourselves, and each other, become better engineers.
Register for Raw & Real episode 5: “All Aboard: Bring Your Team Together,” airing Wednesday July 29, 10am PDT.
Want to know more?
Talk to our team to arrange a custom demo or for help finding the right plan.