This is a guest blog post from Chris Gardner, originally posted on his personal blog.
I’ve recently started working on a new project to build a Discord bot in Go, mostly as a way to learn more Go but also so I can use it to manage various things in Azure and potentially elsewhere. I figured it’d be useful to document some of this project to give some insights as to what I’ve done and why. First up was setting up the CI/CD pipeline for it so that I don’t need to worry about it later and can save myself a bunch of time when testing.
Early Decisions
When starting this project I made a few important decisions early on:
- Don’t use PoshBot – It supports Discord and would make quite a few of the commands easier to write/use but the goal is to learn Go. If I was just wanting to do the automation then PoshBot would be the way to go.
- Use CircleCI – Normally I’d use Azure Pipelines for my CI/CD but I wanted to try CircleCI as a different option and see how it works out.
- Include Honeycomb from the start – I want to get a better view of what was happening both within the bot and within my CI process, Honeycomb is the perfect tool for this as we’ll see in this post. Including it as early in the process as possible will give me a much better insight as to how the code has evolved and how it’s being used.
With those out of the way it was time to get started on the project.
Architecture
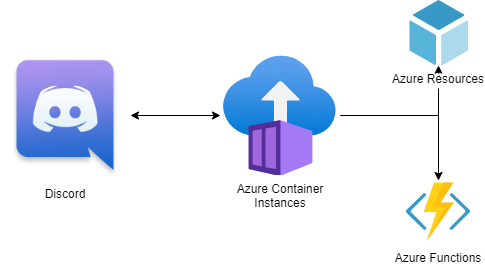
The architecture for the bot is pretty straightforward as the main communication is just between Discord and the bot code, with the bot then taking actions based on the messages it receives. I’m running the bot in a container to make deployment very easy and keep things as simple as possible. It also gives me a few different hosting options, I went with Azure Container Instances for now since I don’t really need a public endpoint or any specific ports opening up but I could also have just used App Services instead (or for total overkill Azure Kubernetes Service).

CI/CD
The first thing I try to do in any project now is set up a CI/CD pipeline (or at least CI) so that I can validate that the code is actually going to work, or at the least pass my unit tests. So for this project I decided to step outside my usual tool of choice, Azure Pipelines, and give CircleCI a try as I’d heard good things about it and it already has support for Honeycomb’s buildevents tool, which will allow me to instrument my pipeline. This will let me see how long various steps and stages take, see data over time, and hopefully spot any weird changes that I might need to investigate further.
So my pipeline for deployment looks something like this:

All my code is in Github, is run through a CI/CD process in CircleCI, the built container is pushed into Azure Container Registry (ACR), and then the Azure Container Instances (ACI) is updated to make use of it.
This process is all managed via the config.yml file in the repository. As can be seen it’s broken down into a number of steps:
- Setup – Will do the initial buildevents config to make sure traces are started and populated with some initial data
- Watch – Runs until the build is finished and is used to actually push the trace into Honeycomb
- Build – Builds the actual Go code, with some extra metadata added to the span for artifact size and build number (and more eventually as I figure out I need/want it)
- Publish – Builds the docker image with the Go executable in it and the publishes it to ACR with a few different tags
- Deploy – Updates ACI with the new image using an ARM Template and then makes sure the container is started using the Azure CLI.
There is a test step defined but commented out of the config file currently as I only have some sample code in at the time of writing so I haven’t got anything to test. The Publish and Deploy steps are set to only run on builds on main to ensure we’re not getting conflicting images pushed from PRs etc and potentially causing instability, I might review this process later when I start looking at Optimizely for feature flagging.
This process may seem like a somewhat long winded approach when all I’ve got is a small executable that’ll be running some bot commands, but as the project expands it’ll be useful to have it in place so I can make changes and know I’ll find out very quickly if I’ve broken anything, both from the use of unit tests and from Honeycomb once I’ve wired that up in the application. I’ll also be able to find out very quickly what it is I’ve broken if things stop working for users or not doing what they thought it would (which is often worse).
Why Honeycomb in CI/CD?
One thing that has occurred to me while I’ve been working on this is whether I’d get any value from using Honeycomb as part of my CI/CD process. It’s a really cool tool for observability in my application but CI/CD should be reasonably simple and straightforward, so why do I need to add this extra tooling in there?
To answer that I found an interesting presentation by Ben Hartshorne from Honeycomb about how they’ve used Buildevents themselves to find where their build process has started taking longer over time (as expected) but not in ways they’d expected. And it’s also allowed them to experiment with different things they can do to improve performance of the build process and have the data to prove or disprove that experimentation (which is very very important to the whole process). So I figured it was worth adding in, it’s got very low overhead on the actual build process so was at least worth a shot.
One downside of this approach is that everything needs to run through the buildevents executable, which isn’t a huge issue in this project as all the commands being used are simple CLI tools. In more complex build processes that I’ve seen in the past in Azure Pipelines, when using the Visual Studio tasks or similar, there is a lot of complexity that’s hidden away behind the interface of the task that would need to replicated in your own scripts or inline commands to interact with the buildevents process correctly. This isn’t a particularly big issue but something that I’ll definitely have to investigate when I start using buildevents from Azure Pipelines (which I almost certainly will).
So what do we see in Honeycomb for this CI/CD process?

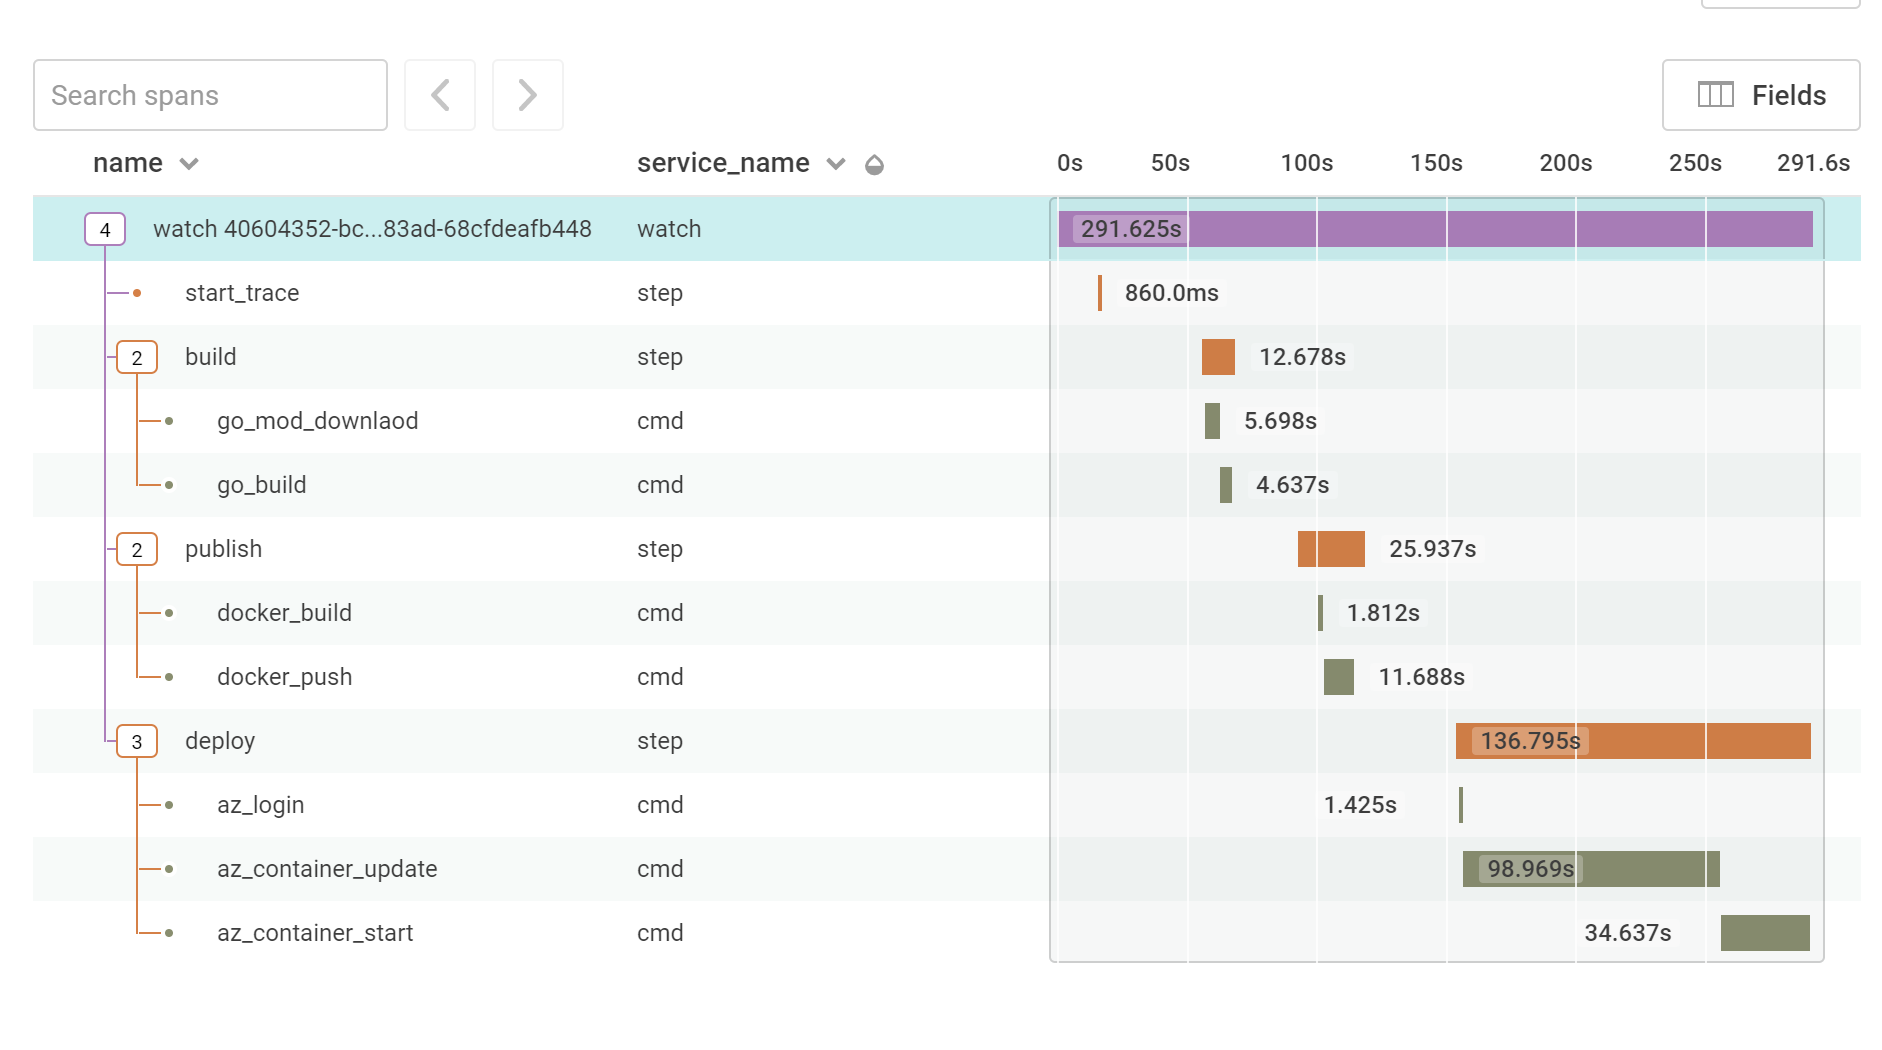
Here we can see a breakdown of how long each command took to run, there’s also some extra metadata added to each one of these spans that can help provide more context for what is happening. The key things that can be seen here are that the deployment is the longest part of the deployment, with the ARM template being the majority of that. This suggests that maybe there’s something that can be done here to improve that step, possibly using the Azure CLI or Azure PowerShell instead, but now that I have a baseline I can use that as a guide for how much faster this can be made.
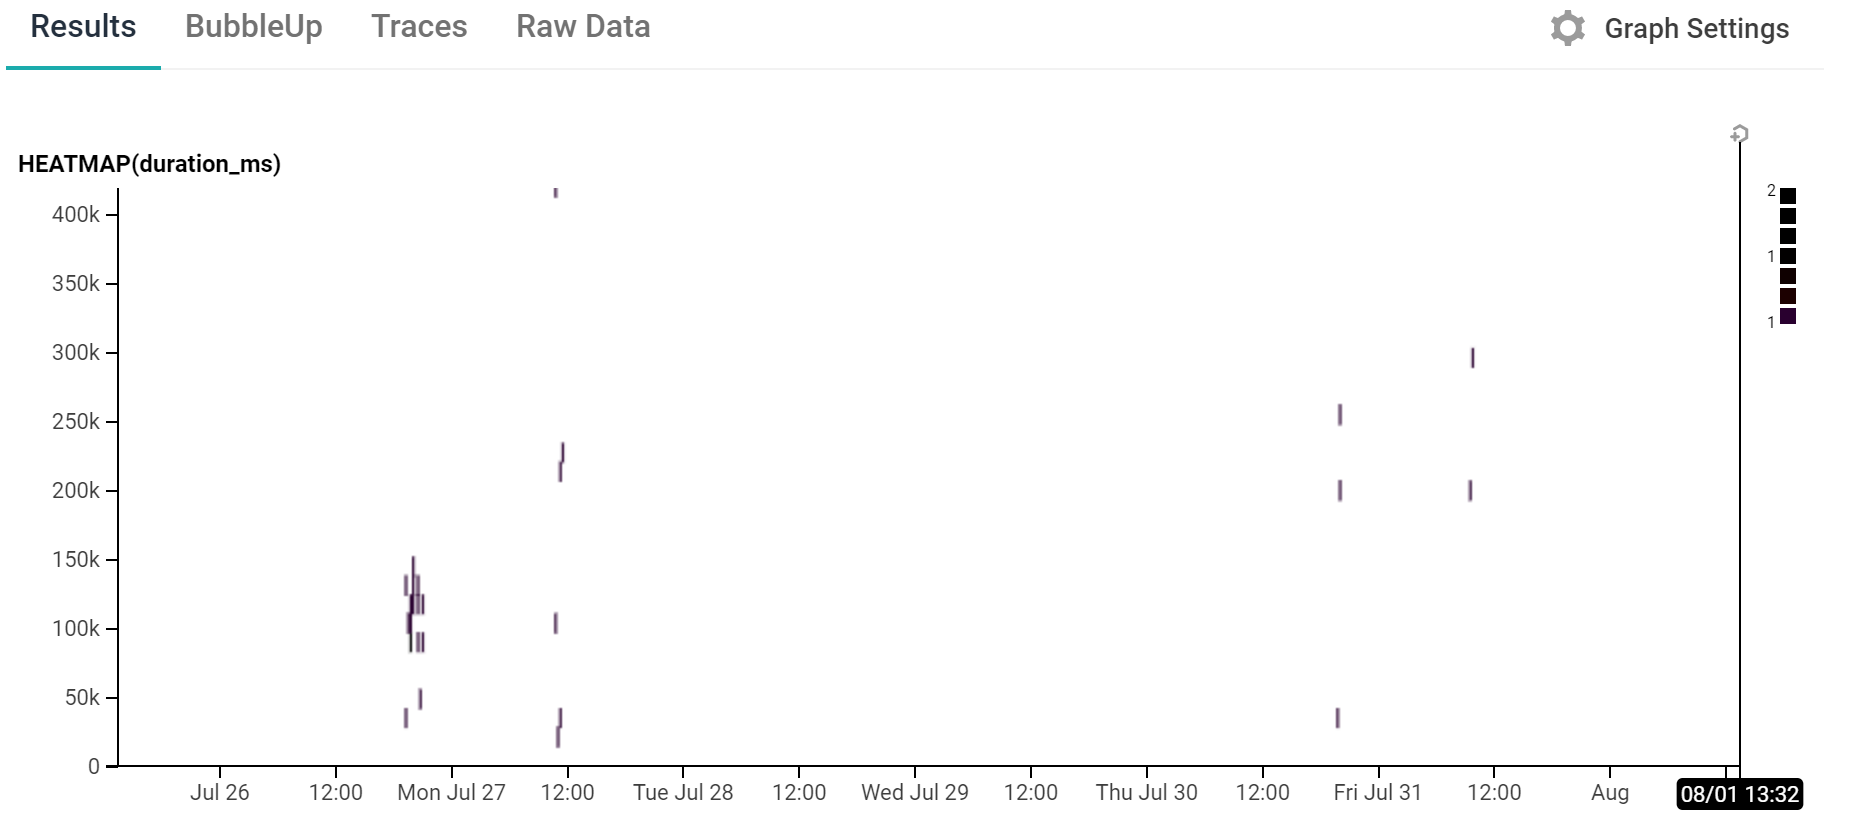
On a broader scale we also get a view like this:

This shows a heatmap of the duration of the various builds that have happened in the last 7 days. There’s not a huge amount of data here yet as there’s only been a small number of builds but it gives a good indication of how useful this can be, especially when combined with the BubbleUp feature to help identify what differentiates some events from others when investigating issues or just seeing something which looks interesting.
What next?
From here I can start writing actual code for the bot and wiring up Honeycomb to that. As the code evolves I’ll be able to track how the CI/CD pipeline changes, which bits take longer (I’d expect the build step to take longer) and what extra data I can add to the spans.
Want to learn more about Honeycomb? Sign up for our weekly live demo!


