RUM can leave questions unanswered.
Honeycomb for Frontend Observability doesn’t.
As the Product Manager for Honeycomb’s new frontend product, Honeycomb for Frontend Observability, I’ve had the joy this past year of speaking to dozens of frontend engineering teams about observability. Many frontend teams come from worlds where they either rely on QA and customer reports to identify issues in production, or they use real use monitoring (RUM) and error monitoring tools to catch the most egregious issues.
Honeycomb for Frontend Observability is an expansion of observability practices that Honeycomb has been influential in defining the past few years. As defined in this blog, observability 2.0 is the practice of instrumenting your code with telemetry that collects wide events, so you can derive other types of data (such as metrics). These wide events become the data you can analyze to understand myriad questions you and your colleagues may have about the code you’re shipping to production.
In speaking with frontend engineers this past year, I realized that understanding the power of wide events is a big mental shift. We’re used to having metrics—think the P70 of your Core Web Vitals, or the average Time To First Byte (TTFB). These are high-level numbers that give us some insight into the average user experience on your apps—but wide events help us do so much more than metrics can ever dream of.
Asking new questions with wide events
Here’s the simplest way I can describe the difference between a metrics-informed question and a wide-event informed question.
With metrics, I can ask and answer: what is the average INP for this page type?
With wide events, I can ask and answer: which page had the highest INP score in the last week, what script is responsible for it, and which customers are most impacted by poor scores?
Honeycomb for Frontend Observability’s SDKs provide instrumentation that answers so many questions like this out of the box (here’s a post outlining debugging INP in Honeycomb). But you can do even more!
More data costs the same as less data in Honeycomb
To get to the detailed answers you want for your business, answers that will help you drive more revenue or increase retention, or whatever it is that is important to your business, you need to collect the necessary data. In order to answer “Which buttons are my most valuable customers clicking?” you need to be able to correlate button clicks with customers, or pricing plan, or team name, or whatever it is that might be useful for you.
Collecting more data in Honeycomb is easy: we charge the same for each event, whether it has two or 1500 attributes attached. Furthermore, every single attribute is instantly queryable—no need for pre-indexing.
Let’s talk through the data model and explore ways to make your events wider.
Defining wide events in Honeycomb
Before we talk about options for wide events on the frontend, I would like to define my terms.

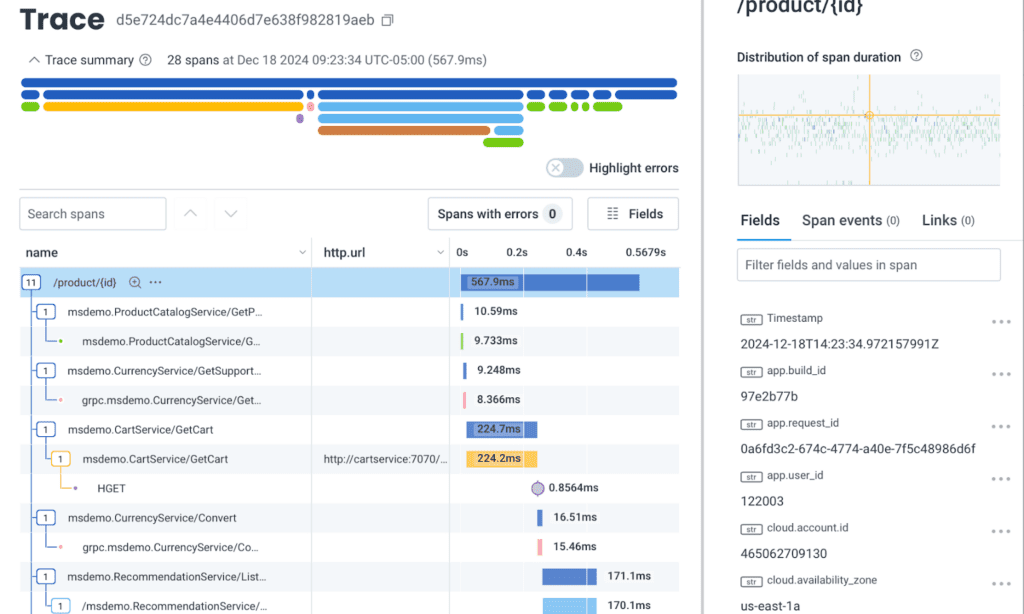
In the above screenshot, we have a visualized OpenTelemetry trace. An OpenTelemetry trace is a single set of connected work, like a document load waterfall, or a request through varying distributed services.
On the left of the image, each row in the trace table is a span. A span is a discrete action in the overall set of work. A single trace can have many spans, at varying nested levels.
The span that is highlighted, /product/(id), is opened in detail on the right of the screen. Here, you can see that the Fields column is selected. These fields include span attributes (or just attributes). A single span can have up to 2000 attributes in Honeycomb.
Those attributes can be a mixture of stable data that is attached to every single event in a single session, or they can be dynamic, changing on every event based on external data—it can even be unique data attached only to that span inline when it is created.
The rest of this post covers how to create each type of attribute in your code.
Attaching session-level data to spans
Some of the data you want to attach to your events as attributes does not change as a user interacts with your website or app. In our Web SDK, this is data like the user’s browser, browser version, and other device attributes. When you are adding custom instrumentation, this might be things like your app version, customer info (pricing plan, team ID, etc.) if known and anything else you don’t believe will change in the time the user is on your site or app. You can also pass in internal routing information, like teams that own the active view, or other data that might be useful for investigations.
Data of this sort can be passed to the Web SDK at instantiation as resource attributes. Resource attributes are an OpenTelemetry concept and are defined when the SDK is instantiated, after which they are immutable but will be available on every single span your application emits during that session.
Resource attributes allow you to do analysis across stable dimensions; number of users by device, or browser; number of errors per release. By capturing this high-level data, you get better insight into customer segments that may need extra attention.
Attaching dynamic data to spans
Much of the data you need to do advanced analysis is not stable across a session—instead, it will change as a user interacts with your application. This is information like authentication status (perhaps a user arrives unauthenticated and then logs in), items in a cart, completion of key journeys, and more.
Even data that seems stable (customer id, team name, pricing plan) may not be available when you instantiate the SDK, so you want to be able to attach it to spans once available. For this, Honeycomb’s Web SDK supports OpenTelemetry span processors. A span processor is a custom function that is called on every single span. Inside the function, you can read the entire span (to see all attributes already attached) and you can modify existing attributes (this is a bad idea!) or add new ones.
Span processors are a very powerful tool. Here’s an idea for you to explore: let’s say you know of certain conditions that, if met, are a very useful signal—for example, if a user logs in and opens a specific view, or if a certain item is added to the cart. You can use span processors to check for these conditions, then attach a specific attribute to all events after the conditions are met. This type of dynamic data allows you to immediately understand what differs between users who succeed at the conditions versus those who don’t. This is the foundation of most product-optimization data analyses.
Attaching span-specific data to spans
Lastly, there may be data you care to attach to spans that are generated by existing instrumentation. All of the OpenTelemetry instrumentation libraries expose functions like the applyCustomAttributesOnSpan() exposed by the DocumentLoad functionality. You can see the Read Mes of each package to see available options.
Similar to a span processor, these options let you write a custom function that can modify the span before it is emitted to Honeycomb. These functions help you attach your business logic to performance data so that you can slice common performance metrics and understand business impact.
Collecting wide events
Observability is a new set of practices for frontend developers, but the great news is we aren’t starting from scratch. With Honeycomb’s OpenTelemetry-based SDK, you can collect wide events from your service with very little setup needed. From there, you can start passing in the data you need, and unlock the ability to ask questions about your websites and applications that aren’t possible in any other tool.
If you run into questions, jump into Pollinators, our Slack community, to ask away—we’re always happy to help.
Happy instrumenting!


