HoneyByte: Get a Taste for Sampling
Honeycomb’s event-based pricing model is pretty simple: we only care about how many events you send. For teams running workloads at scale, the question becomes: are all of my events worth keeping? How can you reduce overall event volume while maintaining fidelity? This HoneyByte is all about sampling strategies you can use to lower costs without sacrificing the value of your data.

By: Shelby Spees

Honeycomb’s event-based pricing model is pretty simple: we only care about how many events you send. For teams running workloads at scale, the question becomes: are all of my events worth keeping? How can you reduce overall event volume while maintaining fidelity? This HoneyByte is all about sampling strategies you can use to lower costs without sacrificing the value of your data.
We’ll look at several approaches you can use, help you avoid common pitfalls, and walk through real sampling code running in production (thanks to our friends at dev.to).
What is sampling?
Sampling is a way to reduce the amount of data you send to Honeycomb without a significant reduction in the quality of your data. It’s like getting samples of food: you can taste all the important bits without getting full.
Sampling requires making decisions ahead of time about what we’re going to include and what we’re going to leave out. If you’re new to the concept of sampling, you may want to start with Irving Popovetsky’s post on various downsampling strategies. For a deeper dive into why sampling is a good approach, you should start with this fantastic talk from Liz Fong-Jones: Refining Systems Data without Losing Fidelity.
You don’t need to have read or watched those resources to understand the sampling concepts in this post, although I do presume enough familiarity with tracing that we can focus on implementing trace-aware custom sampling.
How does sampling work with Honeycomb?
Honeycomb does not downsample your data: we keep every event you send. However, Honeycomb can also receive your downsampled data and use each event’s sample rate to fill in the gaps and make your graphs look approximately as they would with the full data set. We keep your data, however you want to send it to us—it’s up to you.
Before we cover why samplers are implemented in particular ways, it’s important to be clear on how events are sent from your apps to Honeycomb. Previously, we’ve broken down how Honeycomb events are classified somewhat differently than how you might think about what a meaningful event means for your service. For example, with HTTP requests (which are usually represented as traces in the Honeycomb UI), each request creates one trace. Each trace (typically) is comprised of many spans. Each trace span typically represents an underlying unit of work (e.g. an additional system call that was made to fulfill the request, etc). To Honeycomb, each individual span you send is counted as one event. 1 span == 1 event.
An important thing to know is that your data isn’t batched at the trace level. Rather, spans are sent as individual events, and they’re only compiled into a trace by Honeycomb’s backend services once all of your data arrives.
Using a sample rate
The simplest way to downsample your events is by using a blanket sample_rate. The event volume you generate will be 1/sample_rate. In other words, a sample rate of 1 sends 1/1, or 100%, of your events to Honeycomb. A sample rate of 5 sends 1/5, or 20%, of your events. (Note: the sample rate must be an integer.)
For clarity, the default value for an event’s sample_rate is 1. A sample rate of 1 means that none of your data is downsampled in any of our Beelines or in Libhoney, by default.
Here’s an example Libhoney configuration borrowed from the Ruby Beeline docs, using a blanket sample_rate:
Honeycomb.configure do |config|
  config.client = Libhoney::Client.new(
    writekey: 'YOUR_API_KEY',
    dataset: 'ruby',
    sample_rate: 5
  )
endHow this plays out:
- Libhoney sends 1 in every sample_rate events and drops the rest
- In this case, it sends 1 in every 5 events and drops the other 4
- Honeycomb receives the event, including its sample_rate field
- Honeycomb’s backend uses the sample_rate to calculate what your overall dataset would look like
- In this case, Honeycomb presumes that the 1 in 5 events sent is representative of the other 4 that were not
That last bullet point is important to note. What if the 1 event that was sent isn’t representative of the other 4? Dropping 80% of events across the board can be risky. It’s likely that errors or other interesting events aren’t going to be evenly distributed across your production traffic. For most scenarios, we recommend using custom sampling logic instead.
Overriding the sample hook
If you’re using the Ruby Beeline, you can implement custom sampling logic by overriding config.sample_hook in your Honeycomb Beeline configuration—where you include your API key.
Before worrying about various sample rates, let’s just look at how overriding the sample hook works with a toy example:
Honeycomb.configure do |config|
  # ... (other config settings, like write_key and dataset name)
  config.sample_hook do |fields|
    if fields["drop_me"]
      [false, 1]
    else
      [true, 1]
    end
  end
endThe config.sample_hook needs to return a list with two pieces of data for every event:
- should I include this? (boolean)
- sample_rate (integer)
So in the example, if I’ve added a field called drop_me to any span in my code, we’re returning [false, 1] for those events. In this case, false is answering the question, “should I include this event?” This type of approach can be useful for particularly noisy events with low-value data.
In my else clause, we’re returning [true, 1]. Here, true is saying, “yes, send this” and the sample rate of 1 tells Honeycomb that this event represents only itself, there’s no need to re-calculate missing events. (This toy example presumes we care not at all about the events we’re dropping! That’s rarely the case.)
The example implements our custom sampling logic directly in the config.sample_hook. But typically, we would want to write more sophisticated logic to decide which types of events we’ll be sampling. Let’s look at how to do that.
DEV sampler walk-through
In previous HoneyBytes, we looked at how the DEV team set up Honeycomb and how they gained observability by adding more context fields. Now, let’s look at how the DEV team implemented custom sampling in their code (recently renamed to forem/forem! Read their story.).
Starting from config/initializers/honeycomb.rb, where they have their Honeycomb configuration set up, they override config.sample_hook like we did in the above example:
Honeycomb.configure do |config|
  # ... (config stuff)
  # ...
  # Sample away highly redundant events
  config.sample_hook do |fields|
    Honeycomb::NoiseCancellingSampler.sample(fields)
  end
endThis time, though, they’re calling out to a custom sample method in their own Honeycomb::NoiseCancellingSampler class. First I’ll share the class implementation in full, and then I’ll walk through what each chunk of code is doing.
module Honeycomb
  class NoiseCancellingSampler
    extend Honeycomb::DeterministicSampler

    NOISY_REDIS_COMMANDS = [
      "GET rails-settings-cached/v1",
      "TIME",
    ].freeze

    NOISY_SQL_COMMANDS = [
      "BEGIN",
      "COMMIT",
    ].freeze

    NOISY_REDIS_PREFIXES = [
      "INCRBY",
      "TTL",
      "GET rack:",
      "SET rack:",
      "GET views/shell",
    ].freeze

    def self.sample(fields)
      rate = 1 # include everything by default
      # should_sample is a no-op if the rate is 1

      if fields["redis.command"].in? NOISY_REDIS_COMMANDS
        rate = 100
      elsif fields["sql.active_record.sql"].in? NOISY_SQL_COMMANDS
        rate = 100
      elsif fields["redis.command"]&.start_with?("BRPOP")
        # BRPOP is disproportionately noisy and not really interesting
        rate = 1000
      elsif fields["redis.command"]&.start_with?(*NOISY_REDIS_PREFIXES)
        rate = 100
      end
      [should_sample(rate, fields["trace.trace_id"]), rate]
    end
  end
endTo start, we need to extend the Honeycomb::DeterministicSampler module in the Ruby Beeline. The important thing to know about this module is that we’re using it in order to call its should_sample method down in line 37, which decides whether to keep or drop each event based on the sample rate provided. I’ll explain that a bit more later, when we get to that line.
The DEV team had found that Redis and SQL queries were generating a lot of noisy events that weren’t very useful. So they made a few lists of noisy commands to filter by. Here’s the list for Redis:
NOISY_REDIS_COMMANDS = [
  "GET rails-settings-cached/v1",
  "TIME",
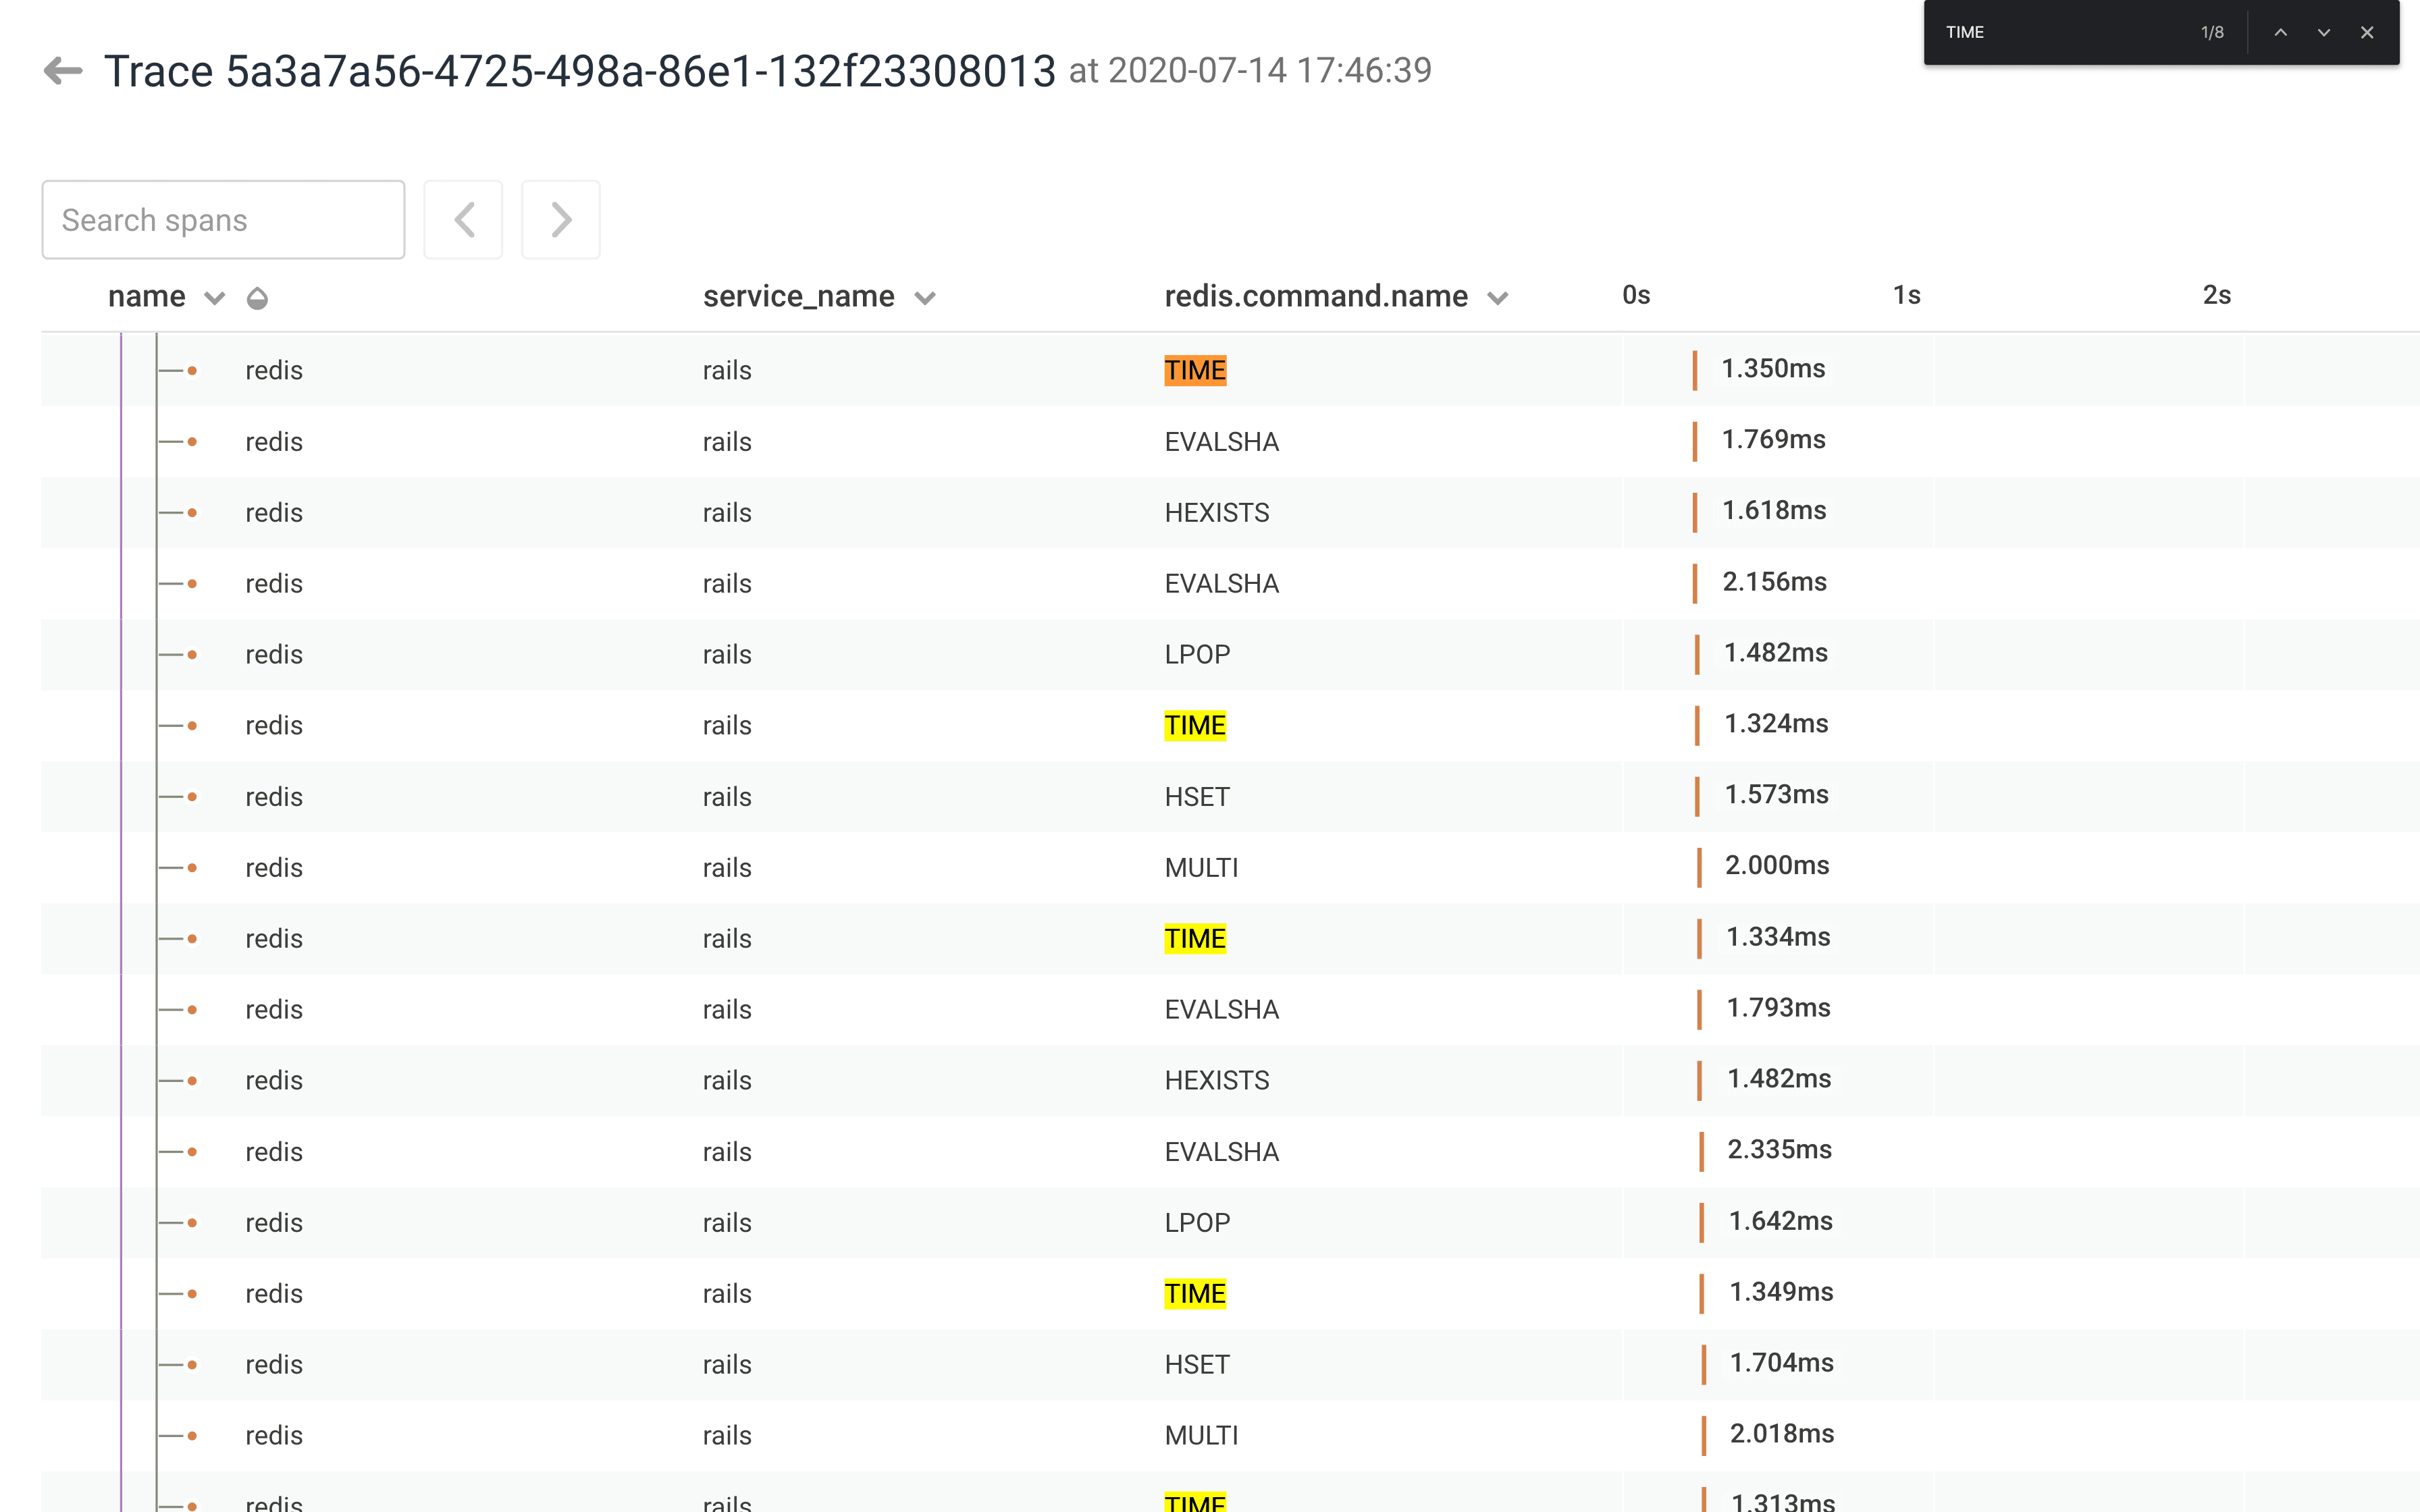
].freezeWe can see in Honeycomb’s trace view that the TIME command shows up a lot:

TIME is not very interesting, so it makes sense that they would want to downsample it. It’s the same idea for the other commands they’re downsampling.
Now let’s walk through the sample method, copied here:
def self.sample(fields)
  rate = 1 # include everything by default
  # should_sample is a no-op if the rate is 1

  if fields["redis.command"].in? NOISY_REDIS_COMMANDS
    rate = 100
  elsif fields["sql.active_record.sql"].in? NOISY_SQL_COMMANDS
    rate = 100
  elsif fields["redis.command"]&.start_with?("BRPOP")
    # BRPOP is disproportionately noisy and not really interesting
    rate = 1000
  elsif fields["redis.command"]&.start_with?(*NOISY_REDIS_PREFIXES)
    rate = 100
  end
  [should_sample(rate, fields["trace.trace_id"]), rate]
endWe set the default rate to 1, which means including 100% of events.
From there we set the rate to different values depending on the events fields:
- send 1% of noisy Redis commands
- send 1% of noisy SQL commands
- send 0.1% of BRPOP, which is especially noisy in Redis
- send 1% of Redis commands with noisy prefixes
As I explained in earlier sections, the sample hook calling the custom NoiseCancellingSampler.sample method here is expecting a tuple, where the first element answers “is this sampled?” and the second element is the sample_rate. In this case the tuple in our return statement is answering the first question by calling should_sample(rate, fields["trace.trace_id"]). This is the should_sample I mentioned earlier—it’s what we’re leaning on to make consistent sampling decisions, and it’s why the NoiseCancelingSampler class extends the Beeline’s DeterministicSampler module at the beginning.
The should_sample method expects a rate and a value, and returns a boolean. Note: a rate of 1 always returns true (i.e., “keep this event”). Beyond that, should_sample will give a consistent return value with consistent inputs. This is why we pass in the trace.trace_id field—so that we get the same result for all spans within a trace. That’s the key to trace-aware sampling!
Returning the tuple completes the implementation of the DEV team’s custom sample_hook. The Beeline then takes the resulting boolean value and the rate, sending events with true over to Honeycomb along with the corresponding sample rate, and dropping all the events with false.
To step back a bit: you can implement whatever logic you want for your custom sample hook, as long as it returns that tuple: [boolean, rate]. And your boolean value here is generated from calling should_sample, which is made trace-aware by passing in the trace.trace_id. The rest is up to you!
Another nice thing about using the Beeline’s DeterministicSampler is that it’s just code, which means that you can write tests for it! Check out the RSpec tests for the DEV custom sampler.
A template custom sample hook
To recap, I’ve written out a complete example that you can use as a template for your own custom sampling logic. First I overwrite config.sample_hook by calling out to MyCustomSampler.sample:
Honeycomb.configure do |config|
  # ... (config stuff)
  # ...
  config.sample_hook do |fields|
    MyCustomSampler.sample(fields)
  end
endAnd here’s my custom module that extends the Beeline’s DeterministicSampler, implements my sampling logic, and then calls should_sample using the trace ID to keep things consistent, returning our expected tuple:
module MyCustomSampler
  extend Honeycomb::DeterministicSampler

  # keep 1% of anything with `downsample` set to true
  def sample(fields)
    rate = 1
    if fields["downsample"]
      rate = 100
    end
    [should_sample(rate, fields["trace.trace_id"]), rate]
  end
endOne thing to note is that I’m setting the downsample field elsewhere, in my actual application code. You don’t have to use a special field to decide what to sample on, you can sample on an event’s name field or based on values of specific fields like the DEV team did in their code. Think about what’s important vs. what’s noise—you know your code best!
Common sampling pitfalls
The logic we’ve described so far is great for individual events, and it makes a lot of sense for the DEV team to downsample noisy Redis or SQL commands that don’t provide a lot of information and don’t have any child spans.
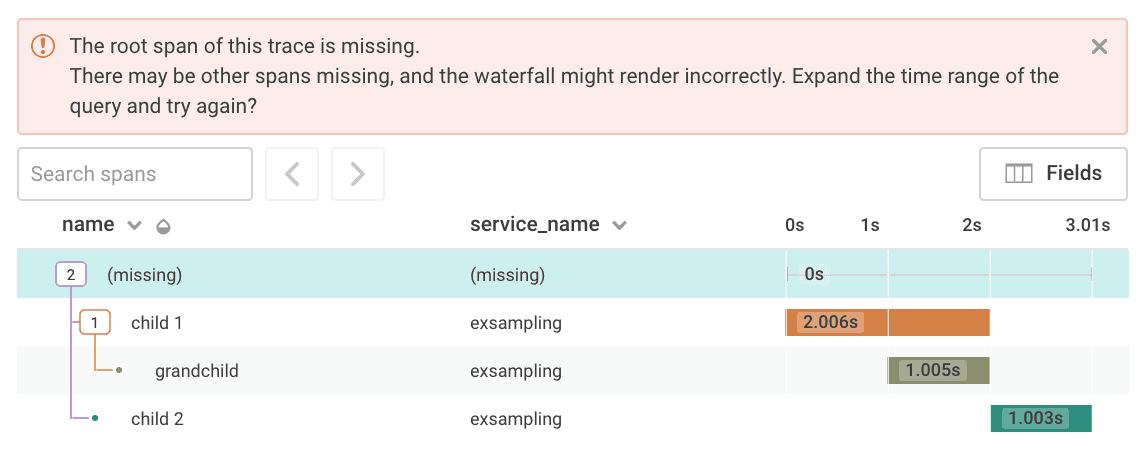
Honeycomb knows to re-calculate query results for individual dropped events based on the sample_rate of their counterpart events that do get sent. But! Honeycomb doesn’t know where those missing events would go in the trace waterfall. The dropped spans aren’t there to establish the parent/child relationship needed to render the spans in the right locations. The DEV team is aware of this trade-off—they are purposely dropping leaf spans (those with no children) in order to reduce event volume. If your sampling code drops spans with children, however, your trace waterfall will show that you’re missing spans in the middle. That’s probably not what you want.
There are a few more considerations to keep in mind when working with traces. Let’s look at what happens when our code makes sampling decisions without being trace-aware. Here we’re trying a head-based sampling approach to drop a trace at the request level:
def index
  if not_interesting
    Honeycomb.add_field('downsample', true)
  end
  # ... (render page, etc.)
endWe’re setting the downsample field based on some condition in the scope of the index method. Unfortunately it’s gone wrong because we’re trying to downsample at the request level, but what happens is that only the root span is dropped while all the child spans still get sent. Here’s what that would look like in the trace view:

The solution for avoiding this is to set a trace-level field as early as possible, before any child spans are started. Our sampling hook will then check the trace-level field on each event to decide whether it gets sent:
def index
  if not_interesting
    Honeycomb.add_field_to_trace('downsample', true) # added to the whole trace
  end
  # ... (render page, etc.)
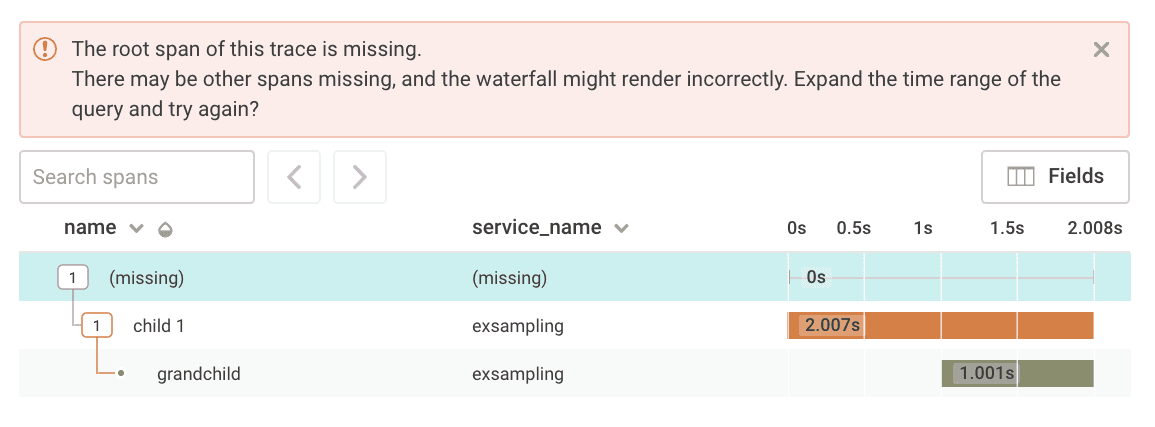
endAnother common pitfall occurs with tail-based sampling. With tail-based sampling, the decision to drop an entire trace is based on some value that is set in the middle of a request. If that happens, the result can lead to orphaned child spans, which get sent to Honeycomb before the entire request completes and the trace-level data is sent.
Note in this screenshot, both the root span and child 2 were dropped. child 1 and grandchild were already sent to Honeycomb by the time the trace-level field for dropping events gets set by child 2.

The logic to complete the sophisticated batching required for tail-based sampling is not built into our Beelines or Libhoney. The best approach to do tail-based sampling without breaking your traces is to run your events through a proxy that can buffer full traces before downsampling them and sending them to Honeycomb. Stay tuned for future news on ways to set up these proxies.
How will you sample events?
We hope this tutorial sheds light on how you can build sampling logic into your code. Check out our docs for more guidance on sampling. You can also check out the source code used to generate these examples, along with more detailed explanations of how things went wrong. Finally, learn more by downloading our white paper, The New Rules of Sampling (direct PDF download).
Have questions? Missing spans? Connect with us at support@highfidelity.io, or via Support → Talk to us within Honeycomb, or join the Pollinators Slack community.
Want to know more?
Talk to our team to arrange a custom demo or for help finding the right plan.