Picture this: It’s 2 p.m. and you’re sipping on coffee, happily chugging away at your daily routine work. The security team shoots you a message saying the latest pentest or security scan found an issue that needs quick remediation. On the surface, that’s not a problem and can be considered somewhat routine, given the pace of new CVEs coming out. But what if you look at your tooling and find it lacking when you start remediating the issue?
We recently found ourselves in this spot—until we realized one of our own integrations could provide us with the data we needed. Let’s dig into what happened.
IMDS v1 and the perils of unauthenticated data access
IMDS is the Instance Metadata Service, which means it’s an endpoint you can hit from your EC2 instance to access its metadata. This provides you with a wealth of information, from things like ‘what VPC is this instance in’ all the way to ‘provide me security credentials for the role attached to this instance.’
You may have already learned about EC2 IMDS v1 remediation from the great writeup by our friends at Slack, but in our post, we’ll focus specifically on the issue of Kubernetes pods reaching out to the service.
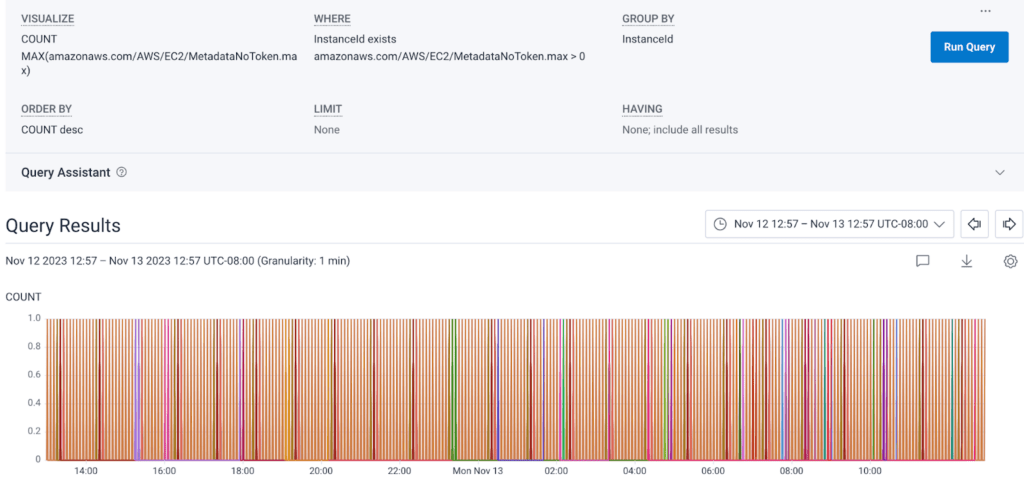
There are two versions of IMDS, known simply as v1 and v2. V1 is a straightforward request and response: you send a request from the EC2 instance and get a response back from IMDS. V2 requires the creation of a session token to be sent along in the headers of your request. AWS surfaces a metric known as MetadataNoToken which specifically tracks calls from instances that lack this token. When we look at this metric, you can see that at some point, we were sending a lot of v1 IMDS requests:
Another key thing to call out is that IMDS v2 has a default “hop” count of one. The hop count is the number of allowed network hops. In the case of our Kubernetes cluster, the call to IMDS from the node is one hop, but from the pod inside the node to IMDS would be two hops. We don’t want pods to have access to anything we haven’t explicitly granted them via the node they’re running on, so it’s crucial that we determine why any of our pods made calls to IMDS.
Here come the tricky bits
One of the tricky parts of remediating this security finding was determining where the calls were coming from and why. Although AWS does offer a packet analyzer, it was tedious and inefficient to install it on a machine and wait for hits to come—especially as we saw many hits were only happening at startup and shutdown of an instance. We also didn’t want to modify our instance spin-up scripts specifically to capture this information.
Besides, this only gave us per instance information, not per pod, which was our ideal. We’re an observability company—surely there was a way we could observe this without directly modifying our EC2s? How could we reliably and unobtrusively capture all the calls being made from pods in our cluster?
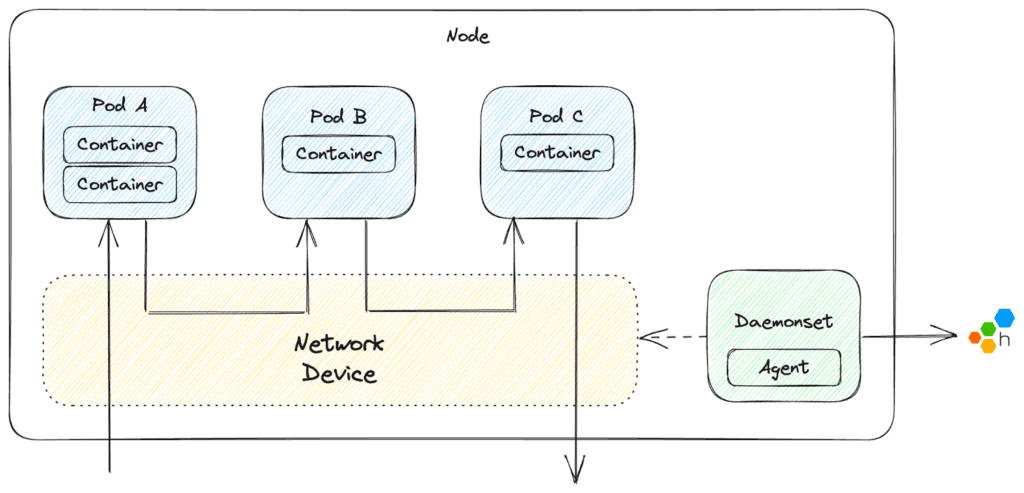
Welcome to the stage, Honeycomb Network Agent—an open source project we developed to give better visibility into the network-level ongoings of your Kubernetes cluster. On a high level, the agent runs as a DaemonSet on each node in the cluster, capturing the network packets from the network interface shared by all resources on that node. This information is then structured into digestible payloads which can be sent as events to Honeycomb.
For more information and to learn how to get started, we recommend checking out the docs for the Honeycomb Network Agent.
How we used the Honeycomb Network Agent to find the remaining calls
We wanted to figure out why a pod would hit the endpoint, and from there, either determine if we needed to provide it information to prevent the call (such as the id of the instance) or block it safely as an unnecessary call. The below screenshot shows the results from one of our environments. We can see which pods made calls, on which paths, and how often. From there, we were able to infer what they were looking for—or if needed, dig deeper.
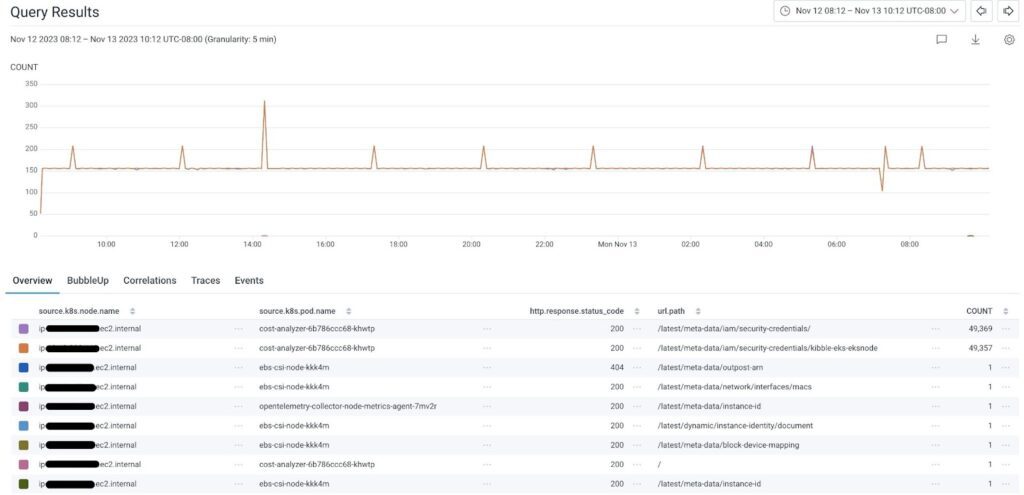
You can see in the screenshot that we have some obvious fixes (like the call to /latest/meta-data/instance-id), some which required more digging (why did cost-analyzer need credentials so frequently?), and others which we were able to disregard as harmless to block (like the call from ebs-csi nodes to /latest/meta-data/outpost-arn, as we don’t use Amazon Outposts).
Our fixes took us through app code where we directly queried the service, to Helm charts where we lacked passable values like the ID of the VPC. Once we felt we had addressed all necessary IMDS v1 calls, we modified the autoscaling group launch templates for our cluster to require v2. We then cycled some instances to check the lifecycle (recall our calls were largely happening at startup and shutdown), and finally, flipped all of our instances to IMDS v2 using this script:
import boto3
import botocore

# use this if accessing something other than your default account
boto3.setup_default_session(profile_name='alt-profile-name')

ec2 = boto3.client('ec2', region_name='us-east-1')
filters = [{'Name': 'metadata-options.http-tokens', 'Values': ['optional']}, {'Name': 'tag:Environment', 'Values': ['env-name-here']}]
response = ec2.describe_instances(Filters=filters)
instance_ids = []

for r in response['Reservations']:
    for i in r['Instances']:
        instance_ids.append(i['InstanceId'])

for instance in instance_ids:
    try:
        modification_response = ec2.modify_instance_metadata_options(
            InstanceId=instance,
            HttpTokens='required',
            HttpEndpoint='enabled'
        )
    except botocore.exceptions.ClientError as e:
        print(f"{e}")
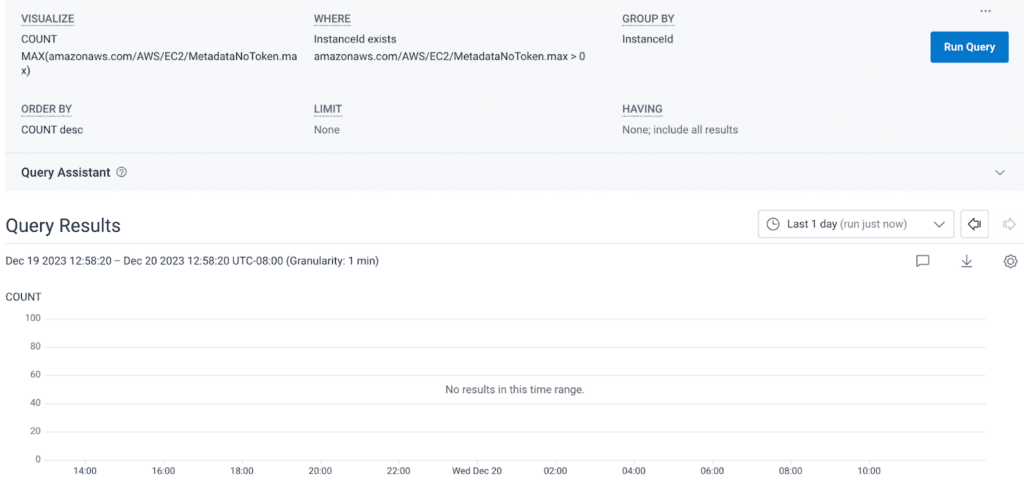
Now, running the same query as before, we see a beautifully blank graph:
Get the Honeycomb Network Agent today
That’s the long and short of how we fixed our IMDS security issue. Hopefully you learned something new today, and we hope you’ll check out our Network Agent—it’s already been super useful for us internally. Maybe it could be useful to you as well!


