From September to early October, Honeycomb declared five public incidents. Internally, the whole month was part of a broader operational burden, where over 20 different issues interrupted normal work. A fraction of them had noticeable public impact, but most of the operational work was invisible. Because we’re all about helping everyone learn from our experiences, we decided to share the behind-the-scenes look of what happened.
Most of the challenges come from a pattern of accelerated growth and scale (the amount of data ingested by Honeycomb grew by 40% over a few weeks), when multiple components hit inflection points, at the same time, on multiple dimensions.
For brevity’s sake, I’ll give an overview of trickier incidents in this blog for context and then jump to the lessons learned. If you want a more in-depth view, see our long form report.
Incidents and near misses
A grab bag of issues
We encountered a lot of small issues that sometimes crossed paths with underlying scale issues. In all cases, they ended up playing a role by being part of a heavy operational burden:
- Our Kafka cluster’s auto-balancer kept getting stuck and causing imbalances, which required time to figure out and then to monitor and manually restart.
- The Linux version we were using had a bug causing EXT4 file system corruptions and crashes on our retriever instances (our main column store and query engine).
- Terraform deleted one of our Lambda deploy artifacts for no known reason.
We are moving services to containers running in EKS. We were first migrating our dogfood environment—internal instances of Honeycomb—to monitor production. These caused multiple disruptions.
- Our main RDS instance got too small for our workload and needed to be scaled up.
Most of our significant issues, however, were related to increased load.
Overloading our dogfood environment
Through the summer, various optimizations were added and limits raised in our stack, which increased our capacity for queries. Since then, we had a few cases where multiple components would alert across environments, but with no clear reason.
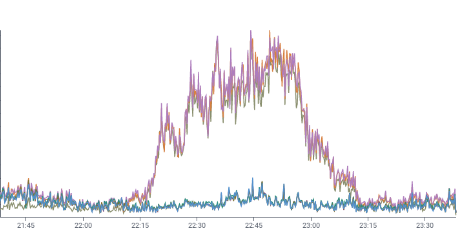
On September 16, some large customer issued multiple costly queries, which read billions of files (petabytes) in a short time. Each of these in turn generated S3 access logs.
Our dogfood ingestion pipeline was under-provisioned for this spike. The back-pressure caused ingestion delays and crashed production Kafka metrics reporters, making it look like a production outage to our redundant alerting systems.
Beagle processing delays
Beagle analyzes input streams for SLO data and auto-scales based on CPU usage. Partition imbalance, service-level objective (SLO) definitions imbalance, and network throughput are all different things that can contribute to CPU being a poor proxy metric for its workload.
Previously, when beagle would warn of falling behind, we’d manually scale it up, which fixed the problem with minimal effort. Through the month, we ended up scaling up more aggressively than usual, and it kept improving at a rate below our expectations.
Kafka scale-up
Some of the beagle processing delays were due to the rebalancer failing without us noticing, but others were hard to explain. We discovered that our Kafka brokers were being throttled over network allowances by AWS:

We needed to scale our cluster vertically to get more network capacity. As beagle delays kept happening, we fast-tracked the migration of the most impacted partitions by shifting them to bigger instances and then move the rest slowly over days.
We had a small hiccup over the long transition, where the data Honeycomb users see was delayed. We posted a public status for this since it was customer-impacting, but kept the delay at around 5 minutes for the worst of it.
Understanding beagle processing delays
Despite our Kafka scale-up, beagle delays happened again. These weren’t caused by Kafka being overloaded since we had added 50% extra capacity.
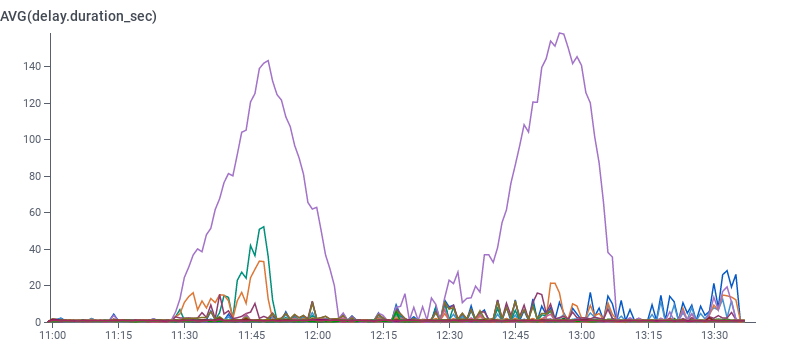
We tried some manual balancing—consumers started to catch up, but surprise! Delays got worse again.
We eventually found out that the choice of partitions beagle would consume could cause problems. Whenever the same leading broker got some of its partitions assigned to a single beagle two or three times, its consuming performance faltered. This explained why scaling up would often fix problems—but would also sometimes make things worse.
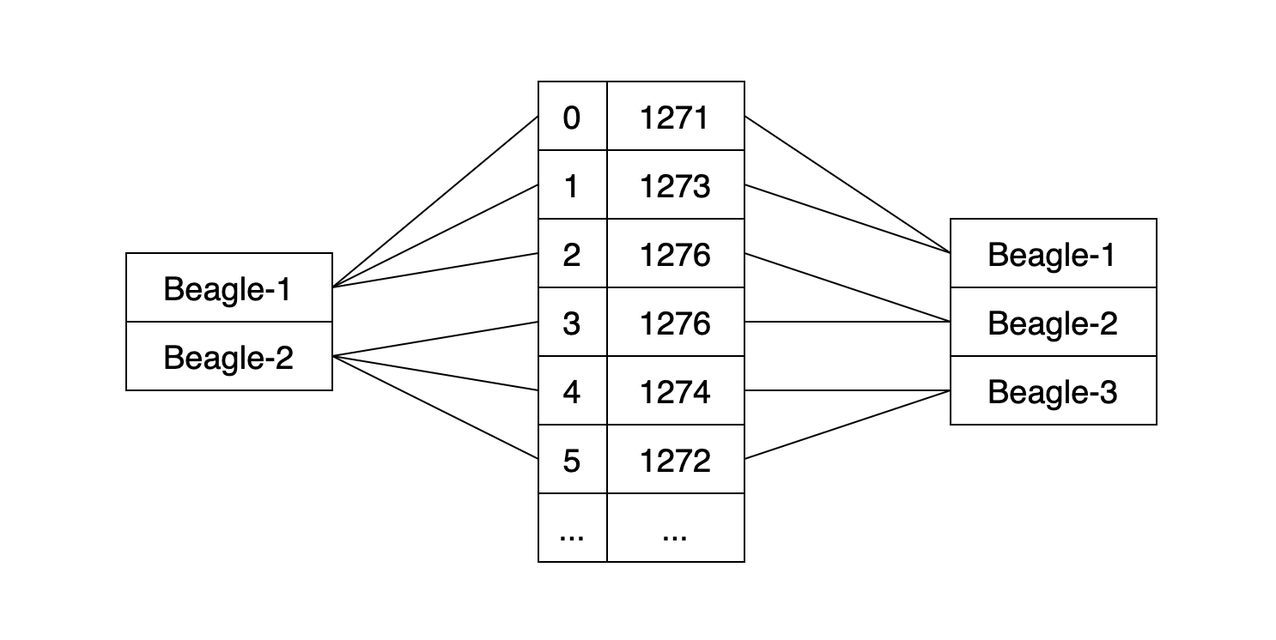
In the Sarama library, Kafka consumer groups open only a single connection to any leader, regardless of how many partitions are going to be fed from it. This can create contention where the connection buffers bottleneck traffic. We tried various settings to increase buffers and throughput over a few days, which at this point seemed to hold up.
Scaling up retrievers
We found retrievers themselves were also having scaling problems due to new extra traffic going through Kafka. We planned a scale-up, adding roughly a quarter extra capacity by scaling horizontally.
We followed a runbook written when beagle did not exist. The steps for it were added later and never tried in production. We saw crashes and delays. We guessed this was because the new partitions were empty and, consequently, rushed things. We made mistakes, one of which was that the runbook was telling us to introduce records in the beagle SLO database:
(“beagle”, “honeycomb-prod.retriever_mutation”, <N>, 0, “manual”)
The actual topic was “honeycomb-prod.retriever-mutation” with a –, not a _. We didn’t notice this when writing the runbook, crafting the queries, reviewing them, applying them, and when doing the first audits of the table after things were going bad.
Beagle struggled and crashed in a loop, causing an SLO processing delay outage.
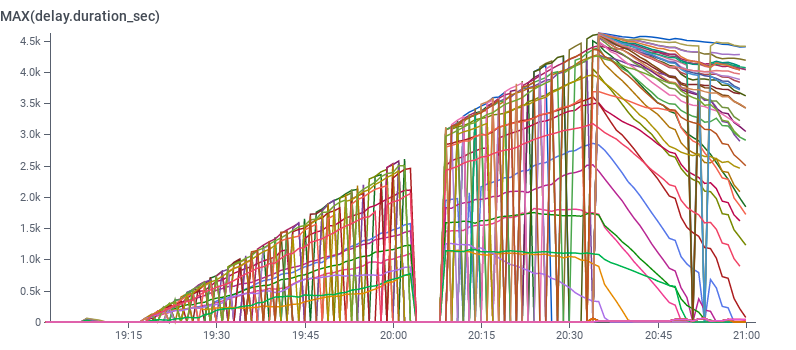
Once we caught up, we backfilled the SLO data and all customers’ service were reestablished properly.
About a week later, we scaled up retrievers again to buy extra room as ingest volume kept growing. That time, it went fine.
Lessons learned and things to keep in mind
Scaling of individual components
We had major ingest growth in a short time. It felt like we hadn’t been proactive enough, but while some of us had ideas about what some of our limits were, nobody had a clear, well-defined understanding of them all.
We ran into scale issues around:
- Network limits that were previously unknown and invisible to us
- Limitations in the abilities and stability of automation
- Surprising capacity of our production cluster to overload our dogfood cluster and vice versa
- Bottlenecks in various components
- Manual and tool-assisted rebalancing of partitions reaching toil acceptability levels
We got in a situation where various types of pressures just showed up at once and disguised themselves as each other.

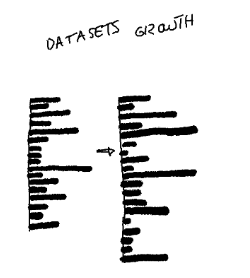
Traffic does not scale uniformly across customers—their datasets aren’t evenly distributed. Implications vary per service. Beagle consumes all messages of all datasets, but the count and costs of SLOs means the scaling shape is distinct from what retriever needs from the same feeds.
Distinct scaling patterns are needed for various components. It’s sometimes unclear if bottlenecks would be better solved by scaling vertically or horizontally (or some other dimension). Our scaling profile over the last months looks a bit like this:
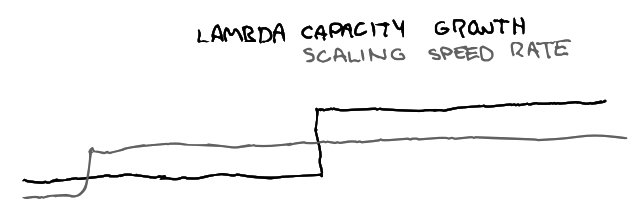

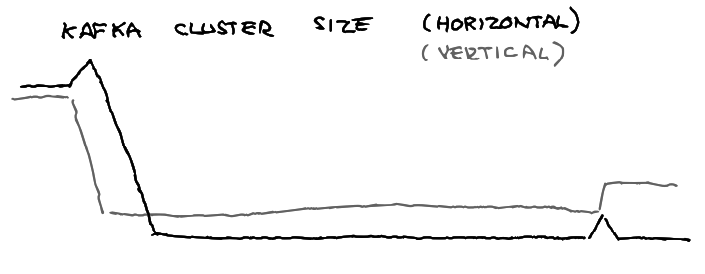

Growth depends on costs, awareness of bottlenecks, scaling models, and expectations. Lambda capacity grew step-wise over time, which changed traffic downstream in different environments, and retriever’s boundaries were fuzzy so we needed to experiment to find effective approaches.
Additionally, our Kafka cluster grows vertically due to licensing structures. Beagle is now fixed in size because that seems stable, but could be smaller vertically and wider horizontally.
Combinatorial scaling
The upcoming challenge we’re about to face is having to consider when our future scaling plans run into each other and reach limits. For example:
- Scaling retrievers horizontally for writes make reads more likely to hit high 99th percentile values
- Vertically scaling retrievers does not address load issues that beagle could see, and scaling horizontally dilutes beagle’s auto-scaling metrics.
- Increasing scale in one environment can cause ripple effects in other ones
- Our own tooling is running into new hurdles as GROUP BY limits in Honeycomb queries mean we can’t see the work of all our partitions or all hosts at once.
September and early October have sent us the clearest signals yet about where a lot of our limits lie and where we need to plan growth adaptation in a combinatorial approach.
Experience and tempo
Often, one of the new incidents highlighted something we did not understand in a previous one or a previous incident held the keys to solving one of the new ones. These examples reinforce the idea that all incidents are learning opportunities.
The ability to adapt to production challenges comes from sustainable pacing—not too active, not too sparse, a bit like exercising to stay healthy. For example, over-scaling to ensure we avoid issues for a long time gives more time to forget about essential operational challenges. It’s useful to keep ourselves familiar with the signals and ways the system bends.
If we operate too far from the edge, we lose sight of it and can’t anticipate when corrective work should be emphasized. If we operate too close to it, we are constantly in high-stakes situations and firefighting. We then lose the capacity, both in terms of time and cognitive space, to be able study, tweak, and adjust the behavior of our system. Keeping that balance is essential to long-term system (and our team’s mental) health.
Do you have any scaling experiences or better practices for operational pacing you’d like to share? We’d love to hear from you! Give us a shout on Twitter or, if you’re already a Honeycomb user, send us a note in our community Slack group, Pollinators.


