In this incident review, we’ll cover the outage from September 8th, 2022, where our ingest system went down repeatedly and caused interruptions for over eight hours. We will first cover the background behind the incident with a high-level view of the relevant architecture, how we tried to investigate and fix the system, and finally, we’ll go over some meaningful elements that surfaced from our incident review process.
This post is an abridged version. Click here to get a detailed version of this review.
The events
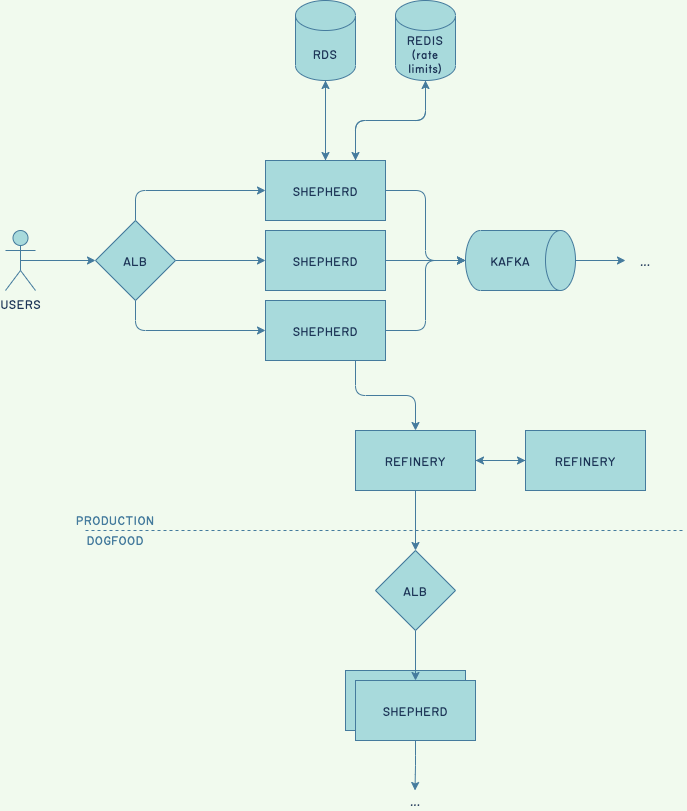
Our ingestion path is a core part of the system where we know there is continuously increasing stress, and that we will soon re-architect to support growth. Most salient bottlenecks have been identified, and we have a list of fixes to apply to extend our runway. One of these scaling limits is the in-memory caching mechanism used by Shepherd hosts, which stand at the edge of the system and accept customer data.
We noticed problems with it recently, and relied on two workarounds: scale the database up vertically so it can take more heat, or scale Shepherds up vertically so they use fewer hosts and the cost of filling the cache is minimized.
We encountered these issues again recently, and our usual fixes were ineffective. This required more research, and to extend our runway, we slowed rollouts down massively. This traded off slow deployments for stability while we scheduled corrective work (reducing contention, pre-warming the cache on boot).
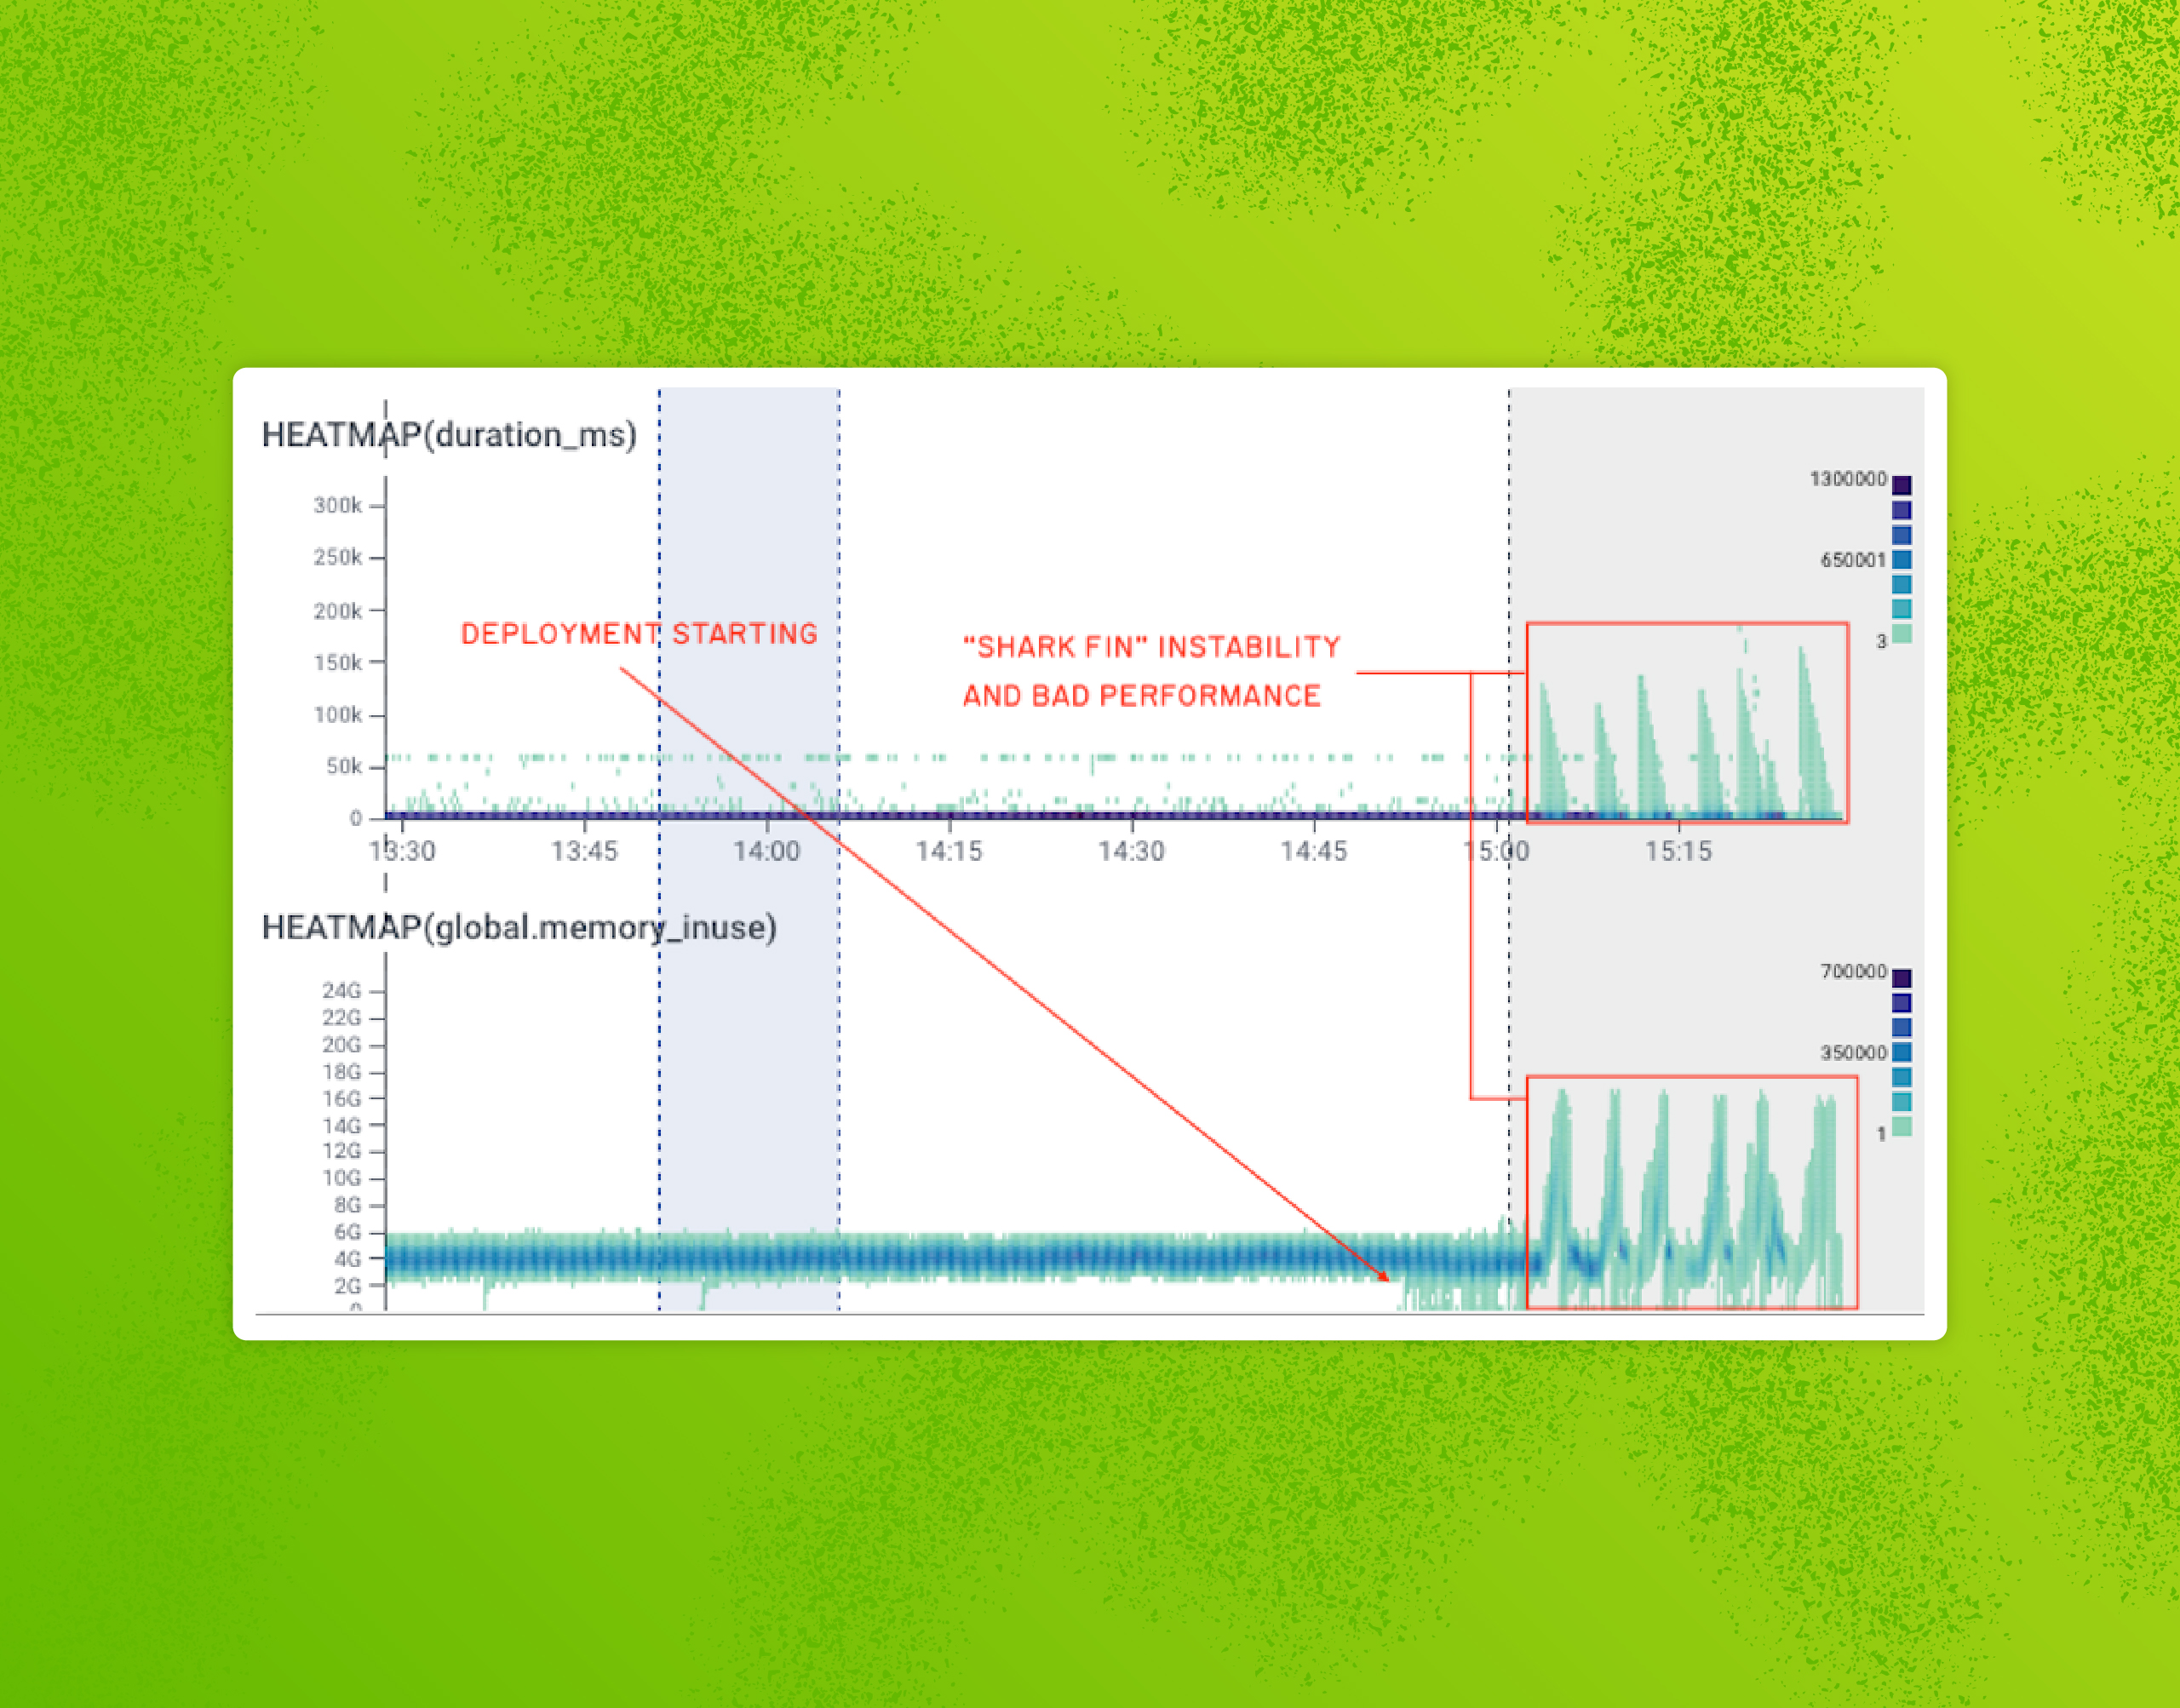
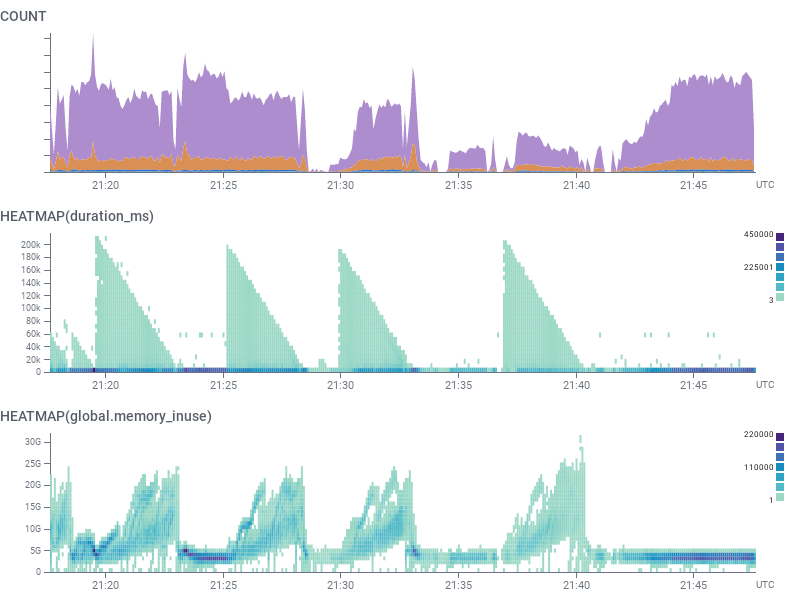
On September 8th, we started running into something we called the “shark fin” pattern:
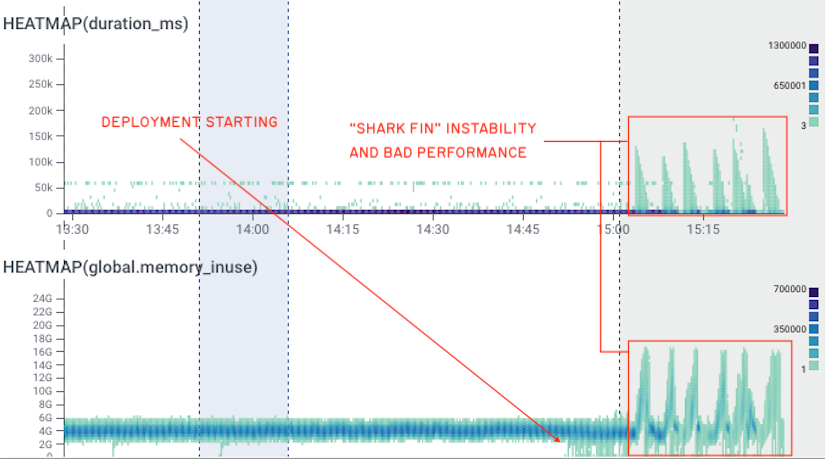
Prior experience had us expecting it to self-resolve within 15 minutes, but this time it was a persistent, metastable failure loop.
Shepherd hosts were running out of memory (OOM) and restarting. This was tied with cascading crashes in our Refinery cluster, which is in charge of sampling our internal Shepherd traces. A new theory emerged: something in Refinery went bad, and Shepherd assumed Refinery would be up. As such, it probably accumulated and queued up data, couldn’t flush it, ran out of space, and got killed.
We decided to do more aggressive sampling in an attempt to stabilize the Refinery cluster by keeping less data. This seemed to work, but sampling aggressively was impacting our ability to observe the system. Not long after, OOM errors recurred in both Shepherd and Refinery.
We could not explain what we were seeing, and we fell back to cache-adjacent hypotheses. We tried to scale Shepherd up vertically to reduce their number, a known recipe. Nothing worked. Everything was messy.
And then, everything magically stabilized.
This gave people a break—several engineers reported being tired—but we had no idea why the system stabilized. We pinned builds to prevent deployments from triggering issues again, and went to rest. A few stayed behind to investigate, and found a critical clue about how Shepherd’s cache works.
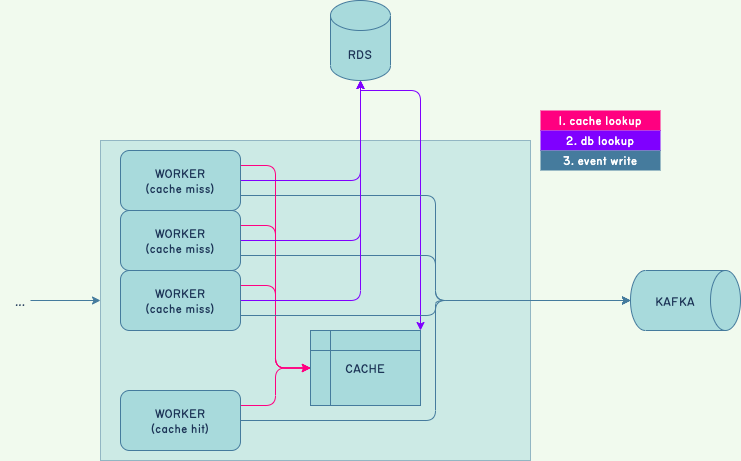
Each Shepherd worker that receives customer data validates it against dataset schemas. For performance reasons, each Shepherd maintains an in-memory cache of schemas. Every time the cache was updated, a lock was acquired. And the lock was table-wide. When a missing entry was backfilled, the cache could cause unrelated requests to pile up.
This could explain “shark fin” graphs, but not what would suddenly trigger this bad state. Past experience always involved the database being overtaxed, which wasn’t the case here.
Despite having pinned versions, a deployment went through and the shark fin pattern resumed. While build artifacts get pinned through a manifest, service definitions are exempt from that mechanism. Tweaks we made to Shepherds’ charts rolled out, and threw us back into the incident.
We then forced a scale-down of Shepherds to disrupt the pattern, but the autoscaler decided we had too few Shepherds—crashlooping demands a lot of CPU—and instead added more of them. We let go of this approach since we didn’t trust in it.
Engineers decided to fix the cache itself. This was our last-ditch option: develop and fix production code under pressure, while tired. Our preferred approach is to stabilize, understand, then fix while rested, but since nothing we did would stabilize the system, we were backed into a corner.
We tried to reduce contention on the cache hot path and also pre-fill the cache before Shepherd hosts accept traffic. Both were ticketed items we already wanted to tackle, but in another context.
Once the fix for the cache pre-fill was applied—after a couple hours—it instantly improved the situation: ingest, connection pools, Shepherds, and Kafka were all better. Only Refinery remained broken.
This incidentally resolved the causal link between Shepherd and Refinery: Shepherd could run just fine without Refinery. We now know that Shepherd going bad threw Refinery in a spiral, not the other way around.
We pinned builds to maintain ingest stability and fixed Refinery by adding more hosts to its pool to sustain the heavier load from Shepherd.
Once everything was stable (though not optimal), everyone went to sleep. We planned to investigate and clean up on the next day, only to be interrupted by another unrelated outage. Once we fixed that, we could clean up this one.
This outage took out a serious portion of our ingest data for over eight hours and a half, not all consecutive, and involved about 10 engineers. We believe most customers sending data at the time may have been impacted at least partially.
Analysis
This incident revealed areas where we had built mental models of components that proved inaccurate during incidents, and could even clash with each other. This was an opportunity to contrast and highlight these elements, but also the importance of shark fin diagrams, how this type of outage is particularly exhausting, and the fix we made.
On shark fin diagrams
The shark fin graph comes up when you’re waiting for something to happen, requests start stacking up, and then they all complete at the same time.
The oldest request will have the longest duration, and the newest request the shortest one. As soon as the blocker is removed, everything completes rapidly.
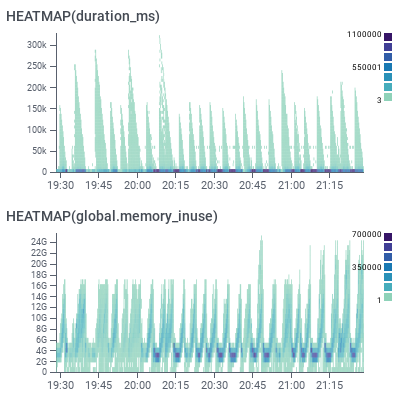
As you watch the graph, it may look like everything is returning to normal, but a few minutes later, the worst offenders’ spans finally make it in and the chart looks wonky again. In this situation, you have to introduce a delay in all your observations before you can confirm any effect.
On causal confusion
At one point, our understanding of the situation looked like the following diagram, where orange denotes places where we observed unusual behavior:
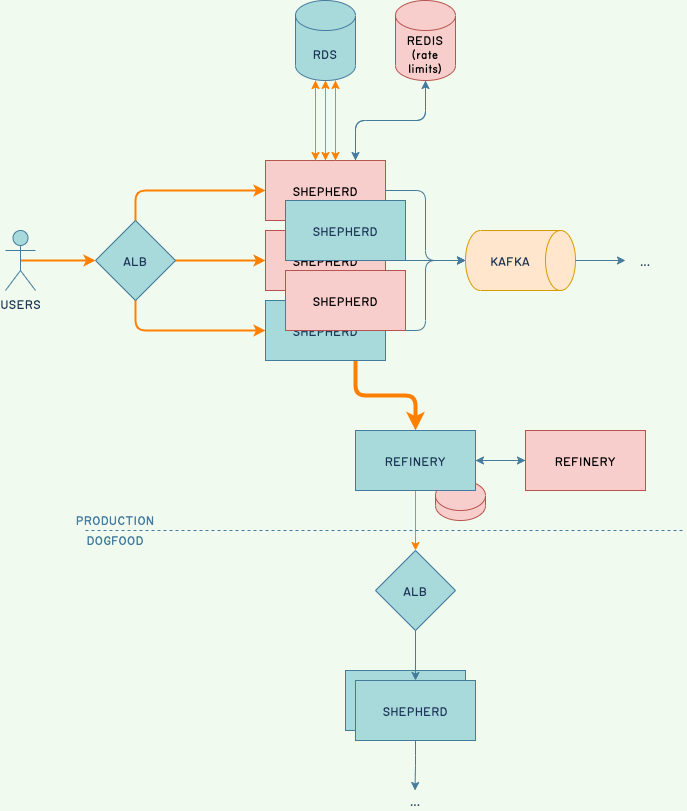
Ingestion volume was higher, connection pools were filling up, Shepherd and refinery hosts were crashing, our rate-limiting host died (unrelated; bad timing), Kafka showed hiccups, a disk was false-alarming, and most of our observability data was in bad shape due to emergency sampling.
Everything felt like it fed back into everything. This sort of situation—where everything seems broken and no one understands why/can’t do much to help—is extremely demanding. Most engineers reported feeling tired, found it hard to think, and were stressed out.
In fact, many pointed out that faster-paced often felt better as long as you knew what you had to do. Sitting around while feeling accountable to fix things—and not succeeding—takes a toll on most people.
Engineers involved in the incident were prompted to take time off to rest. The impact on people tends to outlast the impact on the technical components of the sociotechnical system.
On the solution found
We still don’t know what triggered all of this, we just know that it was fixed by the cache pre-fill. We are confident the fix worked and is effective because it’s been through a lot, and we reverted most of the other temporary fixes.
The incident review pointed out interesting challenges:
- Database contention would require fewer Shepherd hosts to properly lower contention at the database level (fewer instances trying to fill their cache at once).
- Shepherd-internal contention would require more Shepherd hosts to properly lower contention at the cache table level (fewer workers trying to refresh the local cache).
There is also the possibility that both were happening at once, leaving us in a no-win situation where any action can make the problem worse. We can’t eliminate any of them, but pre-filling the cache reduced enough of the blocking to prevent either.
Conclusion
We have accepted that we probably won’t find out how it all came together. The data simply isn’t there, our runway has been extended, and we’re now looking for longer-term fixes that circumvent the overall pattern.
This is part of the normal software development life cycle during rapid growth. While we hope to be ahead of the scaling curve, this sort of incident shows that we’re sometimes going to be a few days late. Surprises are to be expected, and we hope to extract as much value as possible from these events.
We’re hoping that you find useful information in this report as well. Let us know your thoughts in our Pollinators community on Slack, and again, please feel free to download the full PDF of the Shepherd cache incident report to get the full details.


