Welcome to the second week of our blog post series on instrumentation, curated by Julia and Charity. This week will focus more on operational and practical examples; check out previous entries for awesome posts on Finite State Machines, The First Four Things You Measure, and more!
Instrumenting HTTP Services
I spend most of my time at VividCortex working with and building tools for database instrumentation. We’re a SaaS platform with lots of HTTP services, so I spend time thinking about HTTP instrumentation too. Here’s my approach.
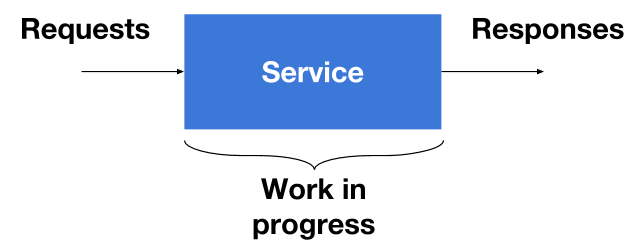
Services have three sections that we need to instrument. There’s the point where requests are coming in, in the middle where work is getting done, and finally where responses leave. For the most part, the results of instrumentation are log events. Log events are simply appended to a log file and are eventually aggregated.

Logging Requests
The first thing we do when we receive a request is uniquely identify it using an ID. In our case, IDs are random hex strings. Here’s how you can create a hex ID in Go:
import "crypto/rand"
import "encoding/hex"

func generateRequestID(length int) string {
        b := make([]byte, length/2)
        _, err := rand.Read(b)
        if err != nil {
                panic(err)
        }
        return hex.EncodeToString(b)
}
Go playground version: https://play.golang.org/p/aVfrWdEcSD
Once we have a request ID, we can log the request details right away. The request ID, method, and URL are a good starting point. I like using logrus as my Go logging package because it allows me to create structured log events, like so:
log.WithFields(log.Fields{
        "request_id": requestData.RequestID,
        "method":     r.Method,
        "url":        r.URL.String(),
}).Infof("[Req %s] %s %s", requestData.RequestID, r.Method, r.URL)
That generates events that are really easy to aggregate because they’re JSON objects:
{
  "level": "info",
  "method": "POST",
  "msg": "[Req 65073a5e] POST /login",
  "request_id": "65073a5e",
  "time": "2017-01-14T00:14:25-05:00",
  "url": "/login"
}
After that, there really isn’t a strong need to log things during the handling of the request unless there’s an error. If there is an error, we simply add another log event with the error details:
log.WithFields(log.Fields{
        "request_id": requestData.RequestID,
        "error":  err.Error(),
}).Warnf("[Req %s] %v", requestData.RequestID, err)
Notice that I’m not including information like the method or URL. We don’t them because we already associated that information with the request ID.
Logging responses
Finally, when the request has been handled, we need to include a final event with the response details. Logging the response information is just like the request, except now we have more information to work with. The latency and status code are good picks because we can use them to trace errors and manage request performance.
log.WithFields(log.Fields{
        "request_id":  requestData.RequestID,
        "method":      r.Method,
        "url":         r.URL.String(),
        "status_code": statusCode,
        "latency":     latencyDur.Seconds(),
}).Infof("[Req %s] %s %s status code %d latency %v",
        requestData.RequestID, r.Method, r.URL, statusCode, latencyDur)
Monitoring work in progress
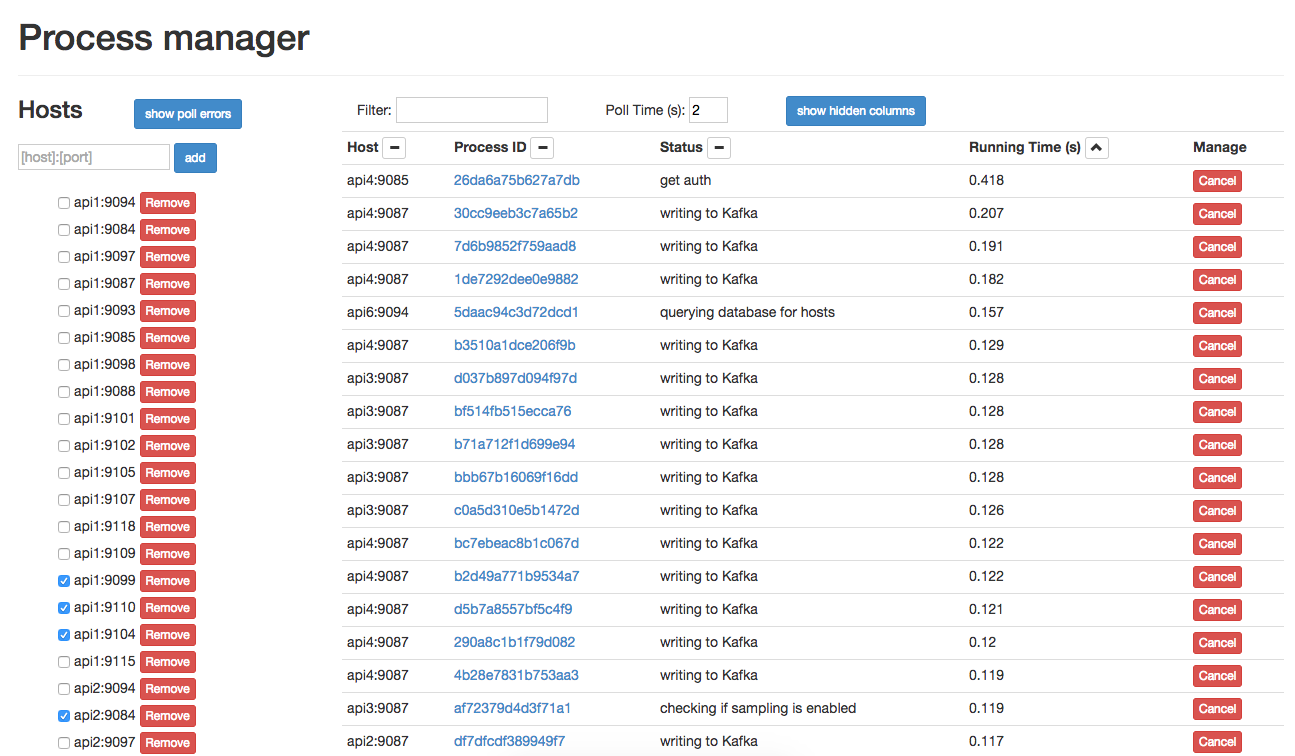
What about stuff in progress? How do you find out what’s happening right now, like you can with top? At VividCortex, we wanted something like that for our web services, so we developed pm. pm is a Go package that lets you integrate process management into an application. In a nutshell, pm allows users to create a process list with an entry for each running request, and have a dynamically-updated status for each of those requests. It’s been really useful when tracking down long-running requests that cause problems.
Once we hook in pm in our applications, we make sure we call pm.Status in strategic locations in our code to update the status of each of our HTTP requests. For example, before parsing request parameters in a request, we call the following
pm.Status(requestID, "parsing request parameters")
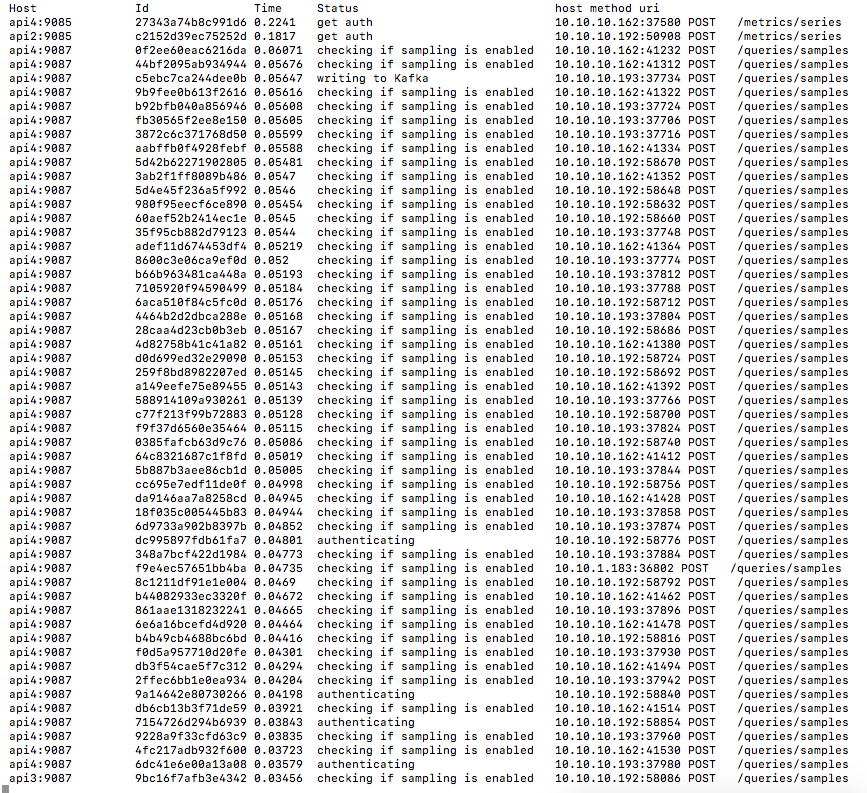
and the status would be set accordingly until the next pm.Status update. Then, whenever we need to see what’s running on a service, we simply use pm’s REST API to get a snapshot of the process list. We have a web UI and a CLI to use with the REST endpoints.


Instrumenting further
Of course, there’s lots of other things you can do to instrument services further. One simple modification that really helps when you have several interacting services is to reuse the same request ID when a request traverses through services. Once you’re at that point, there probably isn’t much left to instrument in your applications. Now you’ve come to the real hard part: making sense of all of the information your instrumentation generates. 🙂
Happy instrumenting!!
Thanks again to Preetam Jinka for their contribution to this instrumentation series!


