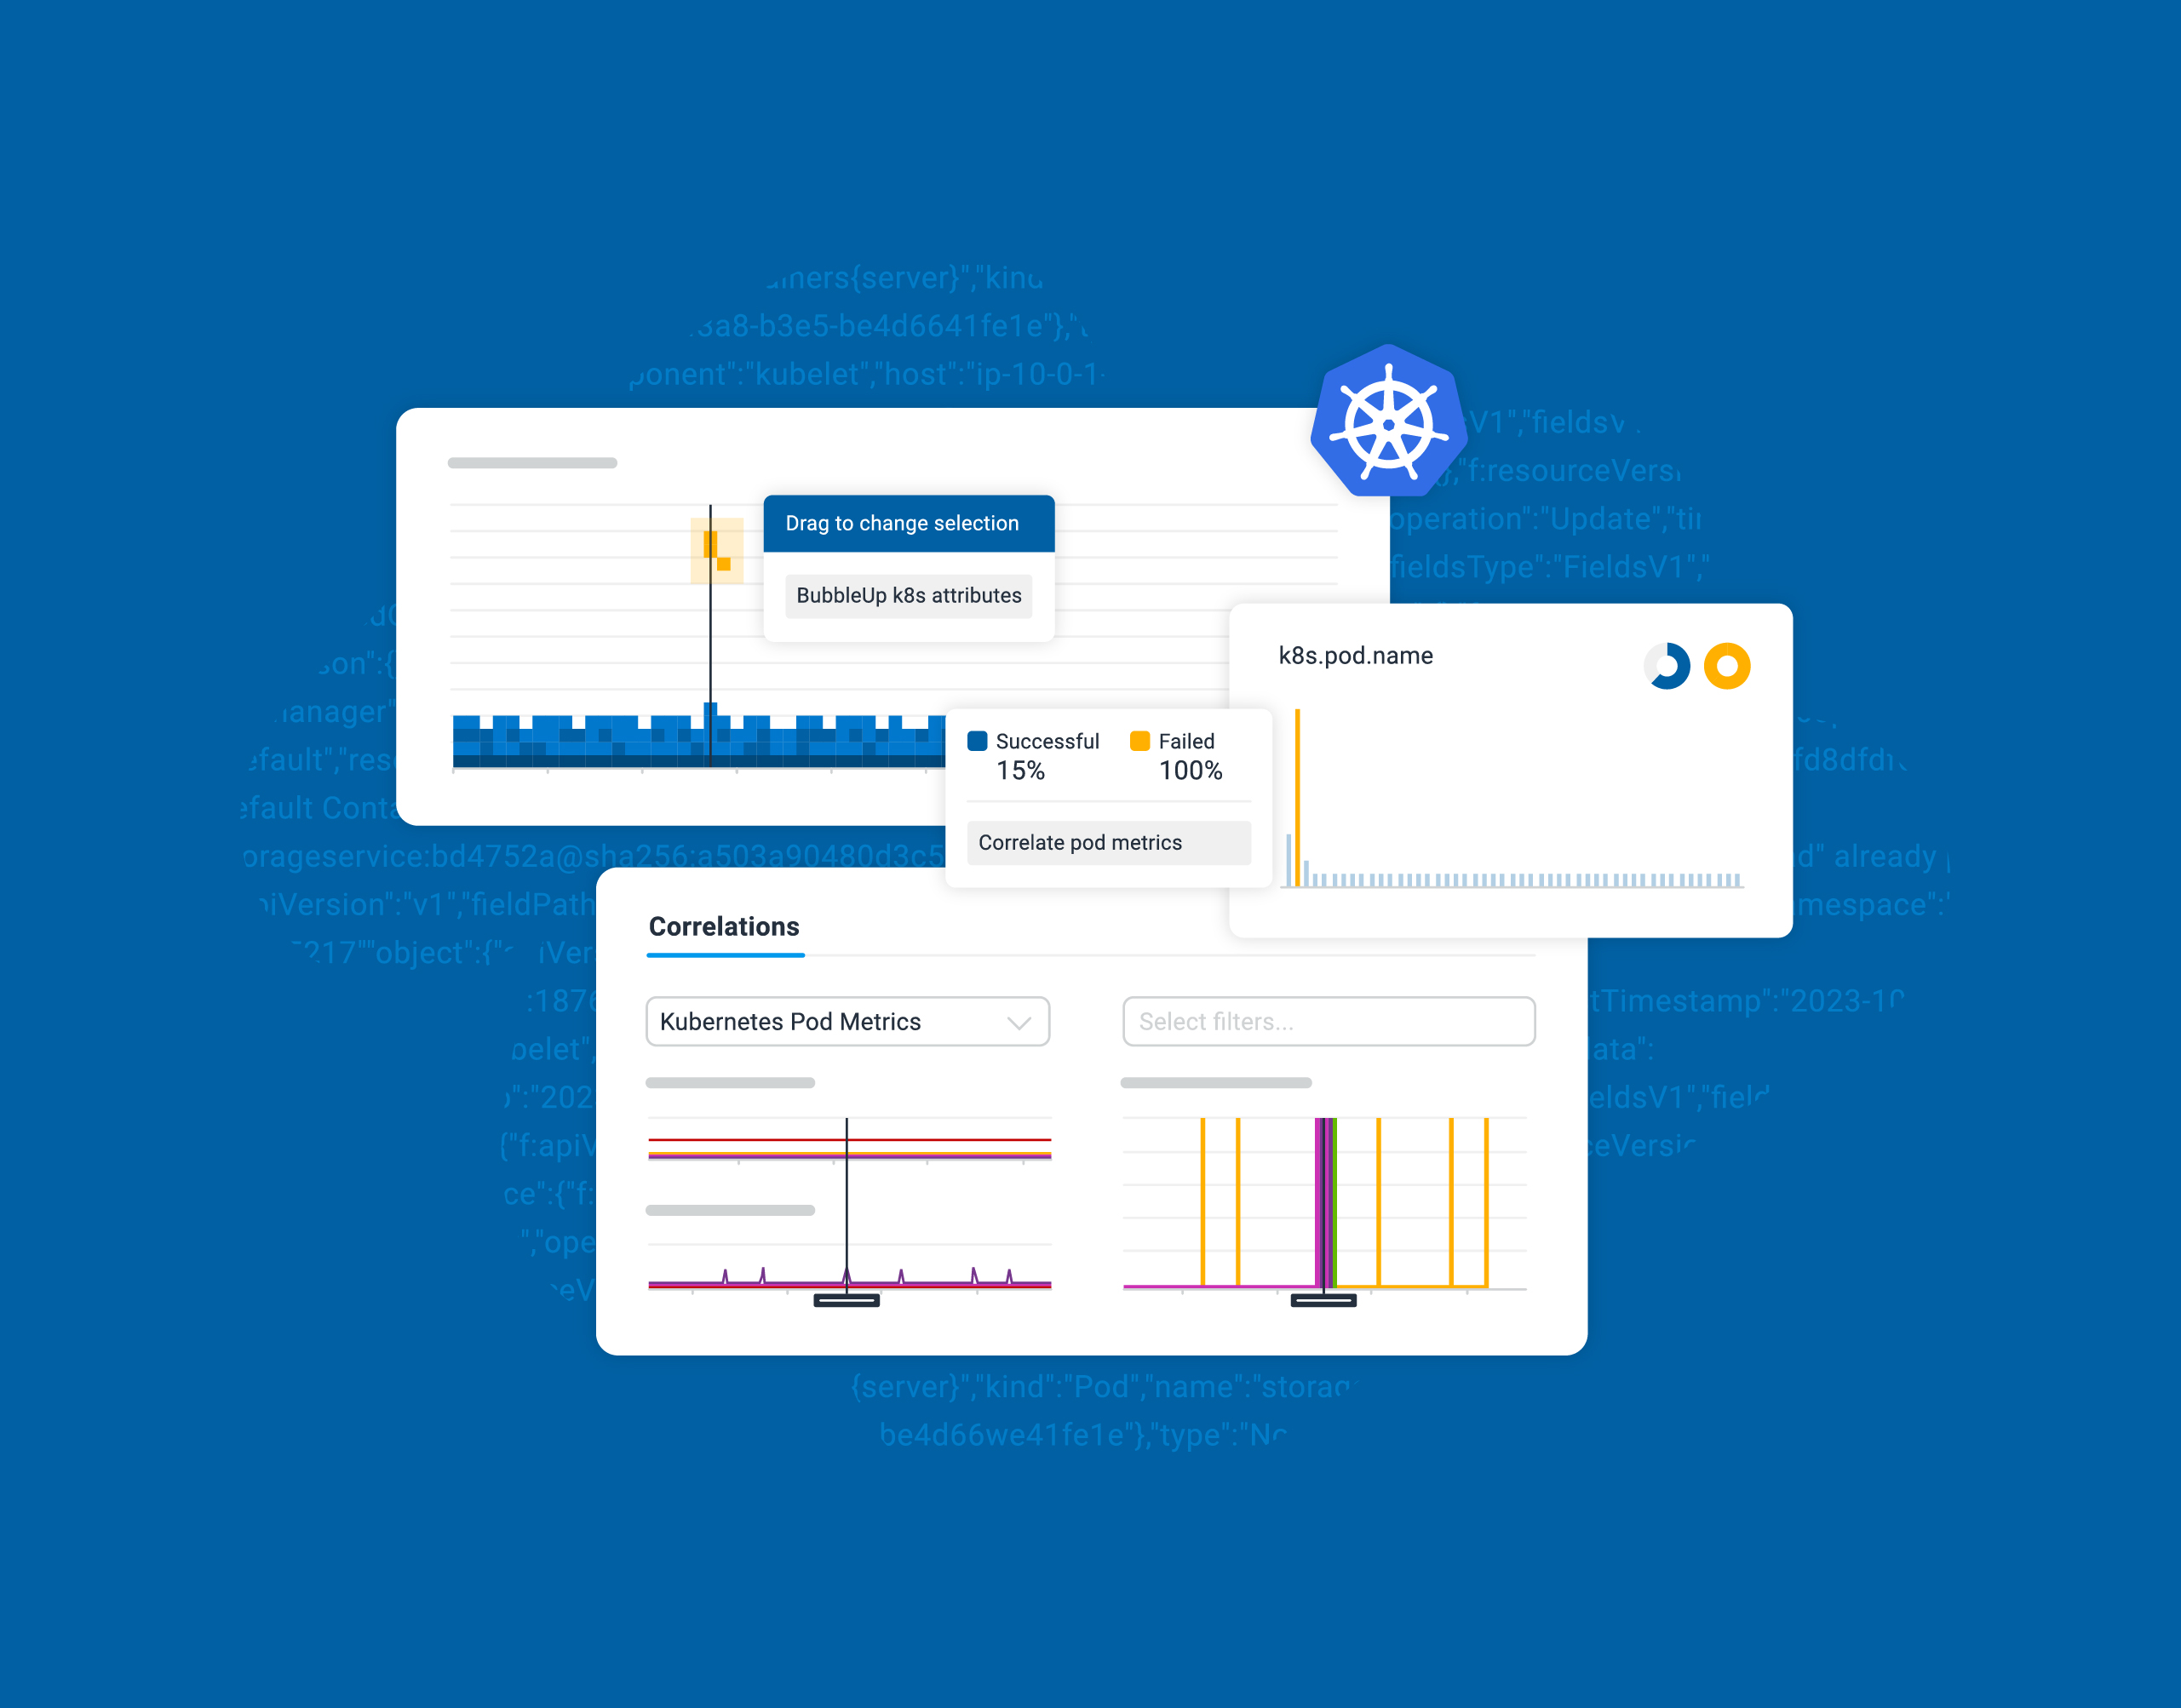
In our continuous journey to support teams grappling with the complexities of Kubernetes environments, we’re thrilled to announce the launch of Honeycomb for Kubernetes, a dedicated solution designed to bridge the growing divide between infrastructure/platform teams and application developers. This is available to all plans (including Free!) at no additional cost.
No more hot potato
Issues in application performance often spark a game of hot potato, bouncing between teams as everyone scrambles to determine whether the root cause resides in the application code or the underlying infrastructure. Traditional monitoring tools keep Kubernetes data separate from application data, forcing teams into a tiresome dance between dashboards, data sources, and tools. This fragmented approach is not only painful but overlooks a crucial reality: infrastructure impacts application performance, and vice versa.
At Honeycomb, we’ve heard real pain from our customers and embraced a profound truth—Kubernetes is far from just ‘boring infrastructure.’ It’s a dynamic, ever-evolving system that demands a holistic view where infrastructure meets observability.
Reinventing observability for Kubernetes
Honeycomb for Kubernetes goes beyond mere metrics, inviting you into a world where in-depth telemetry harmonizes with Kubernetes-aware traces and expansive data visibility. Our approach:
More than just metrics
At Honeycomb, observability isn’t just about collecting data; it’s about making that data actionable in meaningful ways. We provide an instrumentation package explicitly designed for the complexities you face in Kubernetes environments, which includes Kubernetes metrics (compacted for efficiency), logs, events, and, importantly, application traces with precise Kubernetes metadata added.
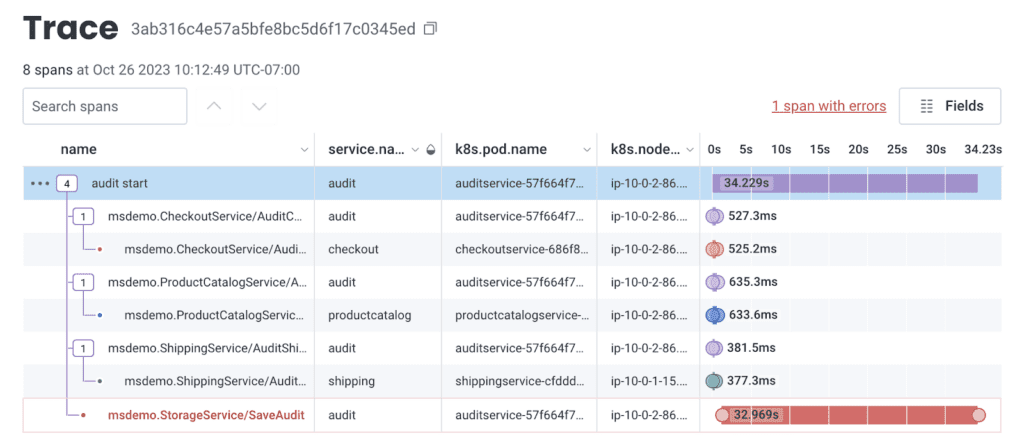
This fusion of Kubernetes-aware application data allows you to fluidly trace the journey of an issue, understand how a hiccup in your infrastructure can ripple into your applications, or pinpoint how application-level decisions reflect onto your infrastructure.
Powered by OpenTelemetry, you can get this package of rich data in Honeycomb in under 10 minutes via our Quick Start, with low-code and no-code options for various needs.
Advanced correlation workflows
With the combination of such rich telemetry and the power of Honeycomb’s query engine, you can pinpoint or rule out infrastructure culprits in record time. Honeycomb’s BubbleUp feature accelerates this process, using statistical analysis to automatically surface which attribute values (among the billions within your data) are unique to any anomalous issue you identify. Is a specific Kubernetes pod slowing you down? Or perhaps a deployment hiccup?
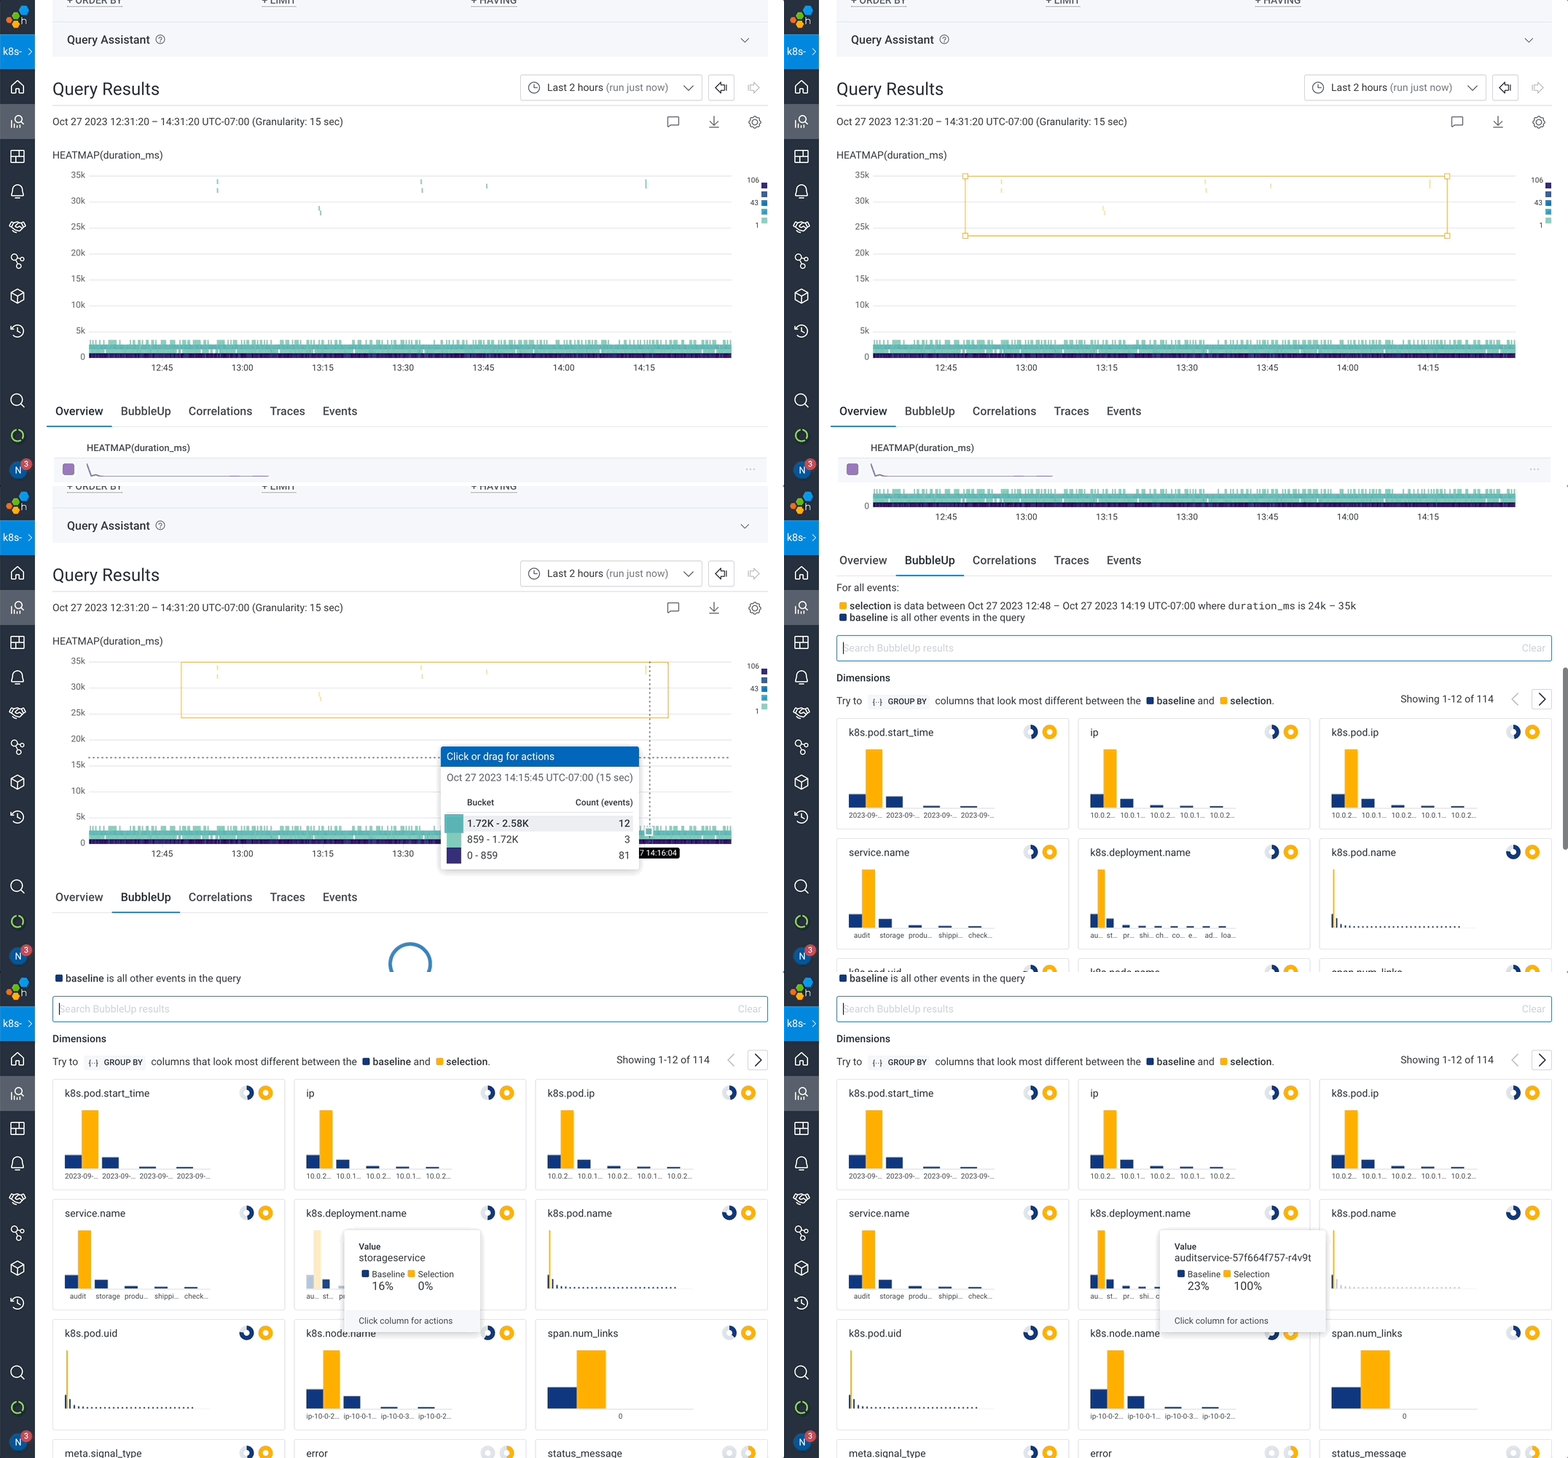
Honeycomb’s flexible correlation views let you look at your application performance through your windshield, next to your infrastructure metrics and events in your rear-view mirror.
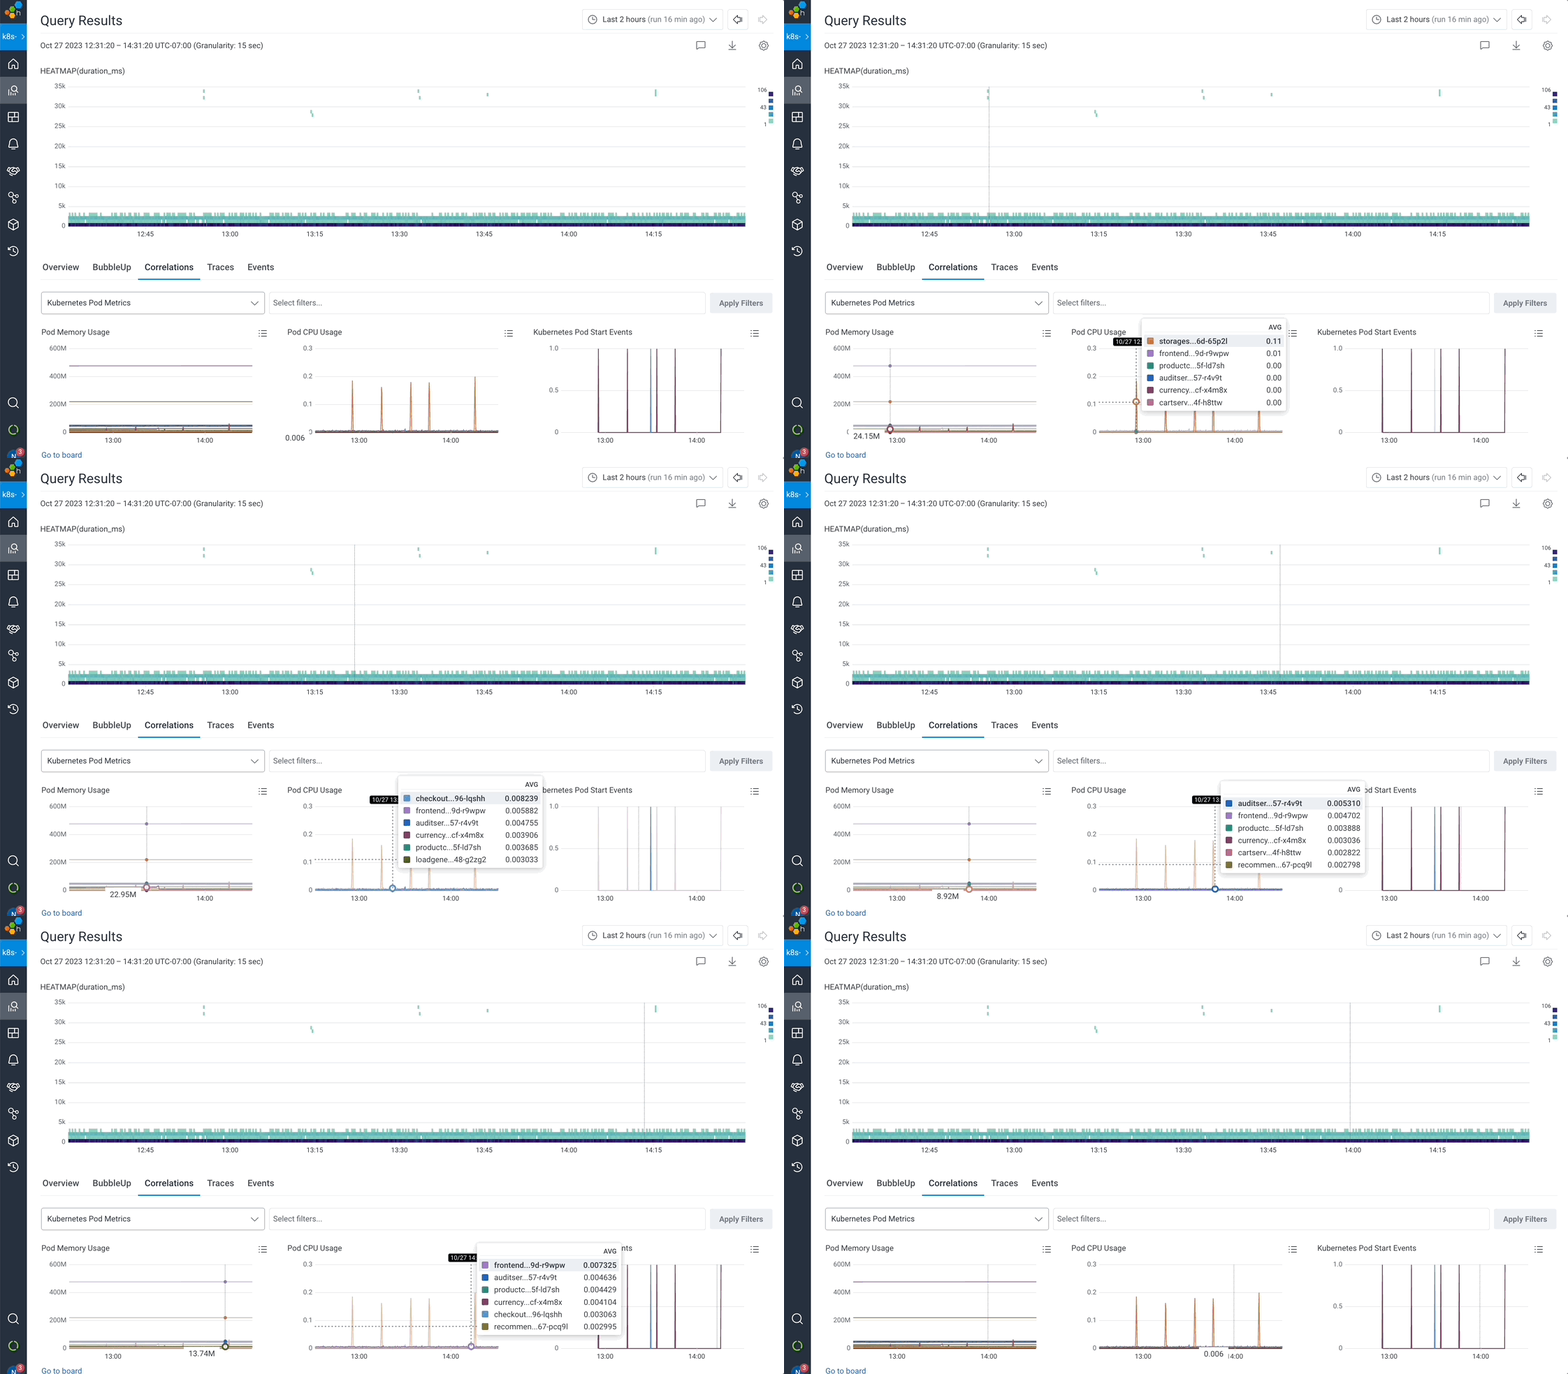
With Kubernetes event markers, you can see at a glance when infrastructure issues coincide with application-level issues. We’ve made sure there’s a custom exporter available to do the legwork for you, showing when Kubernetes issues are at play.
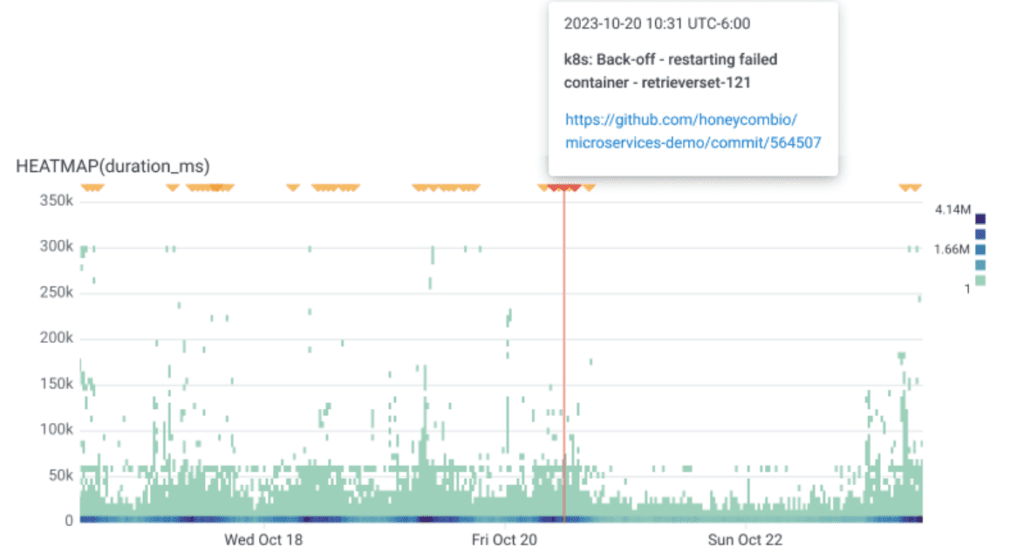
Dive into our sandbox to follow a guided tutorial of these workflows in real time; no signup required.
Curated out-of-the-box dashboards, refined by experience
Forget passive, one-dimensional views of your cluster health. We’ve curated out-of-the-box dashboards that offer a query-driven investigative approach to understand precisely how Kubernetes factors into any issue.
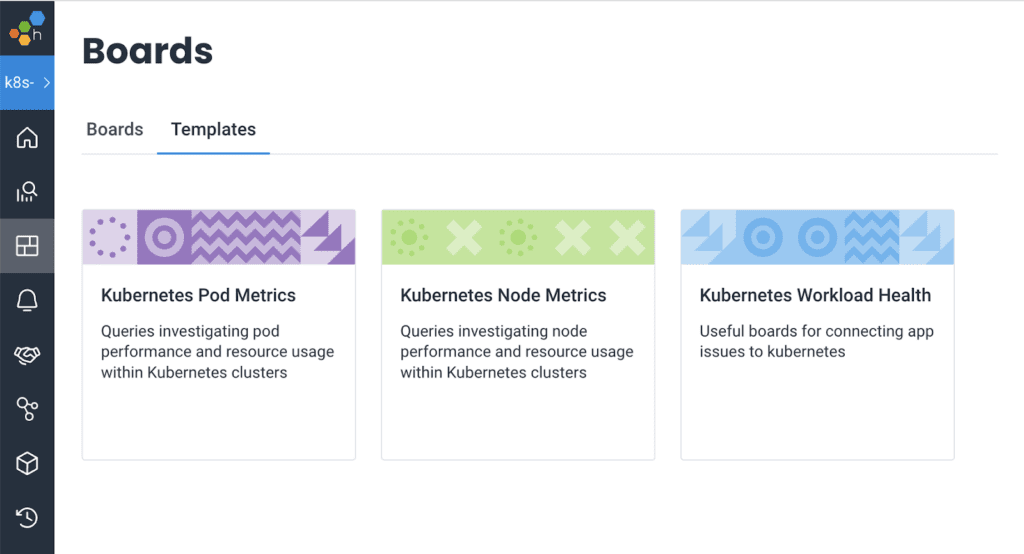
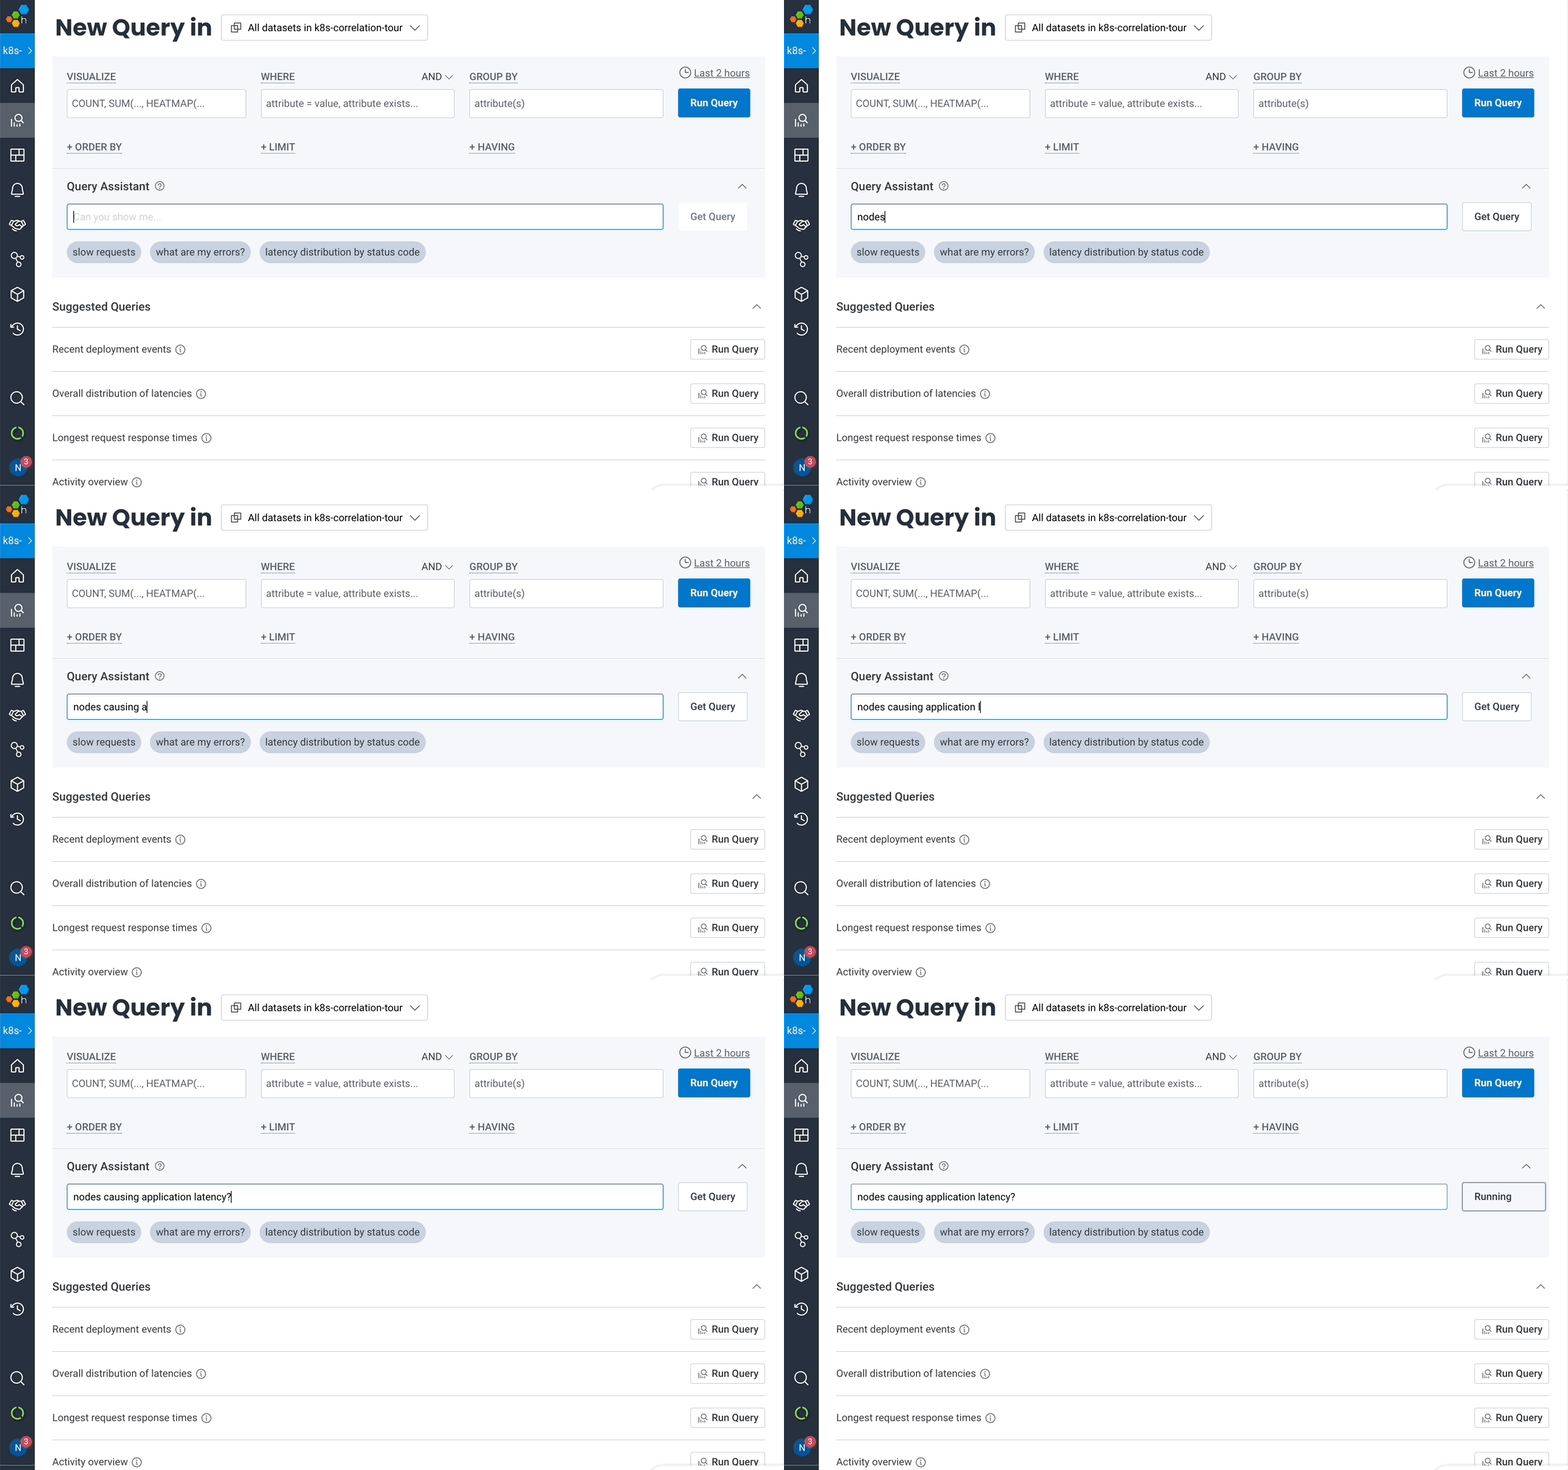
Enhanced with our AI-powered Query Assistant, even Kubernetes newcomers can translate plain English into incisive queries, getting immediate insights without the guesswork.
Simplifying Kubernetes for all teams
Understanding that infrastructure health, application performance, and user experience are deeply interconnected, we developed Honeycomb for Kubernetes to seamlessly guide both application and infrastructure teams through the complexities of system diagnostics and effective collaboration.
Our goal is to give application developers the clarity and freedom they need to investigate issues that affect their applications, down to the infrastructure level.
For infrastructure teams, Honeycomb complements existing tools like Prometheus and Grafana as a critical layer of “why” to enhance the dialogue between infrastructure metrics and application behavior.
For those unable to apply standard OpenTelemetry instrumentation due to constraints like unsupported languages, permissions, or legacy systems, our no-code instrumentation option provides the requisite visibility (even in OTLP format) without the hurdles.
Integrated, informed, and ready to go
By integrating Honeycomb for Kubernetes, you empower your teams to operate from a shared truth, eliminating blind spots that lead to blame games and uncertainty.
Ready to transform how you observe, analyze, and act on your Kubernetes data? Check out this experience in action in our sandbox, dive into our docs, or sign up for free to experience a world where your infrastructure and applications speak the same language. Welcome to the future of Kubernetes observability, shaped by Honeycomb!


