So you’re interested in observability. Perhaps you’ve read an e-guide or attended a conference session or meetup and learned about the benefits related to having observable systems. Are you are feeling a bit stuck and wondering how to get started? We frequently hear this from teams with feedback that goes something like “it’s a bit confusing and we don’t know exactly where to start” or “how should we get data in and what parts of data” or “how do we begin to see some query results” and “how do we know what we are looking for…” You can probably visualize the top of the summit and imagine a world where you can solve production issues in 1/10th the time it previously took but getting started is a lot more challenging.
If you are in an operations role or are responsible for site reliability, you may have been mandated to use a specific metrics and monitoring tool which the team rolled out a few years back. It’s great for keeping an eye on system performance overall but it’s still not the right tool when you experience an incident such as an outage or when you get customer complaints on specific errors or see ongoing performance issues at certain times of the week in a particular region. The truth is that monitoring tools are not designed to debug problems that occur across distributed systems and when you experience any type of scale (CI/CD) or volume, it really starts to break down. We’re here to help:
Honeycomb Learn: A webcast series on steps to achieving Observability-Driven Development
We have designed a series of webcasts or think of them as mini-tutorials designed to break down tasks and activities into smaller bite-size chunks or more manageable units of work. The series kicks off Wed, 2/27 at 10am with our first episode titled: Instrument Better for a Happy Debugging Team brought to you by Nathan LeClaire. In this session you will learn
- instrumentation helps you ship code faster and smarter
- how to start small and get quick wins.
- how to level-up your whole team with shared results
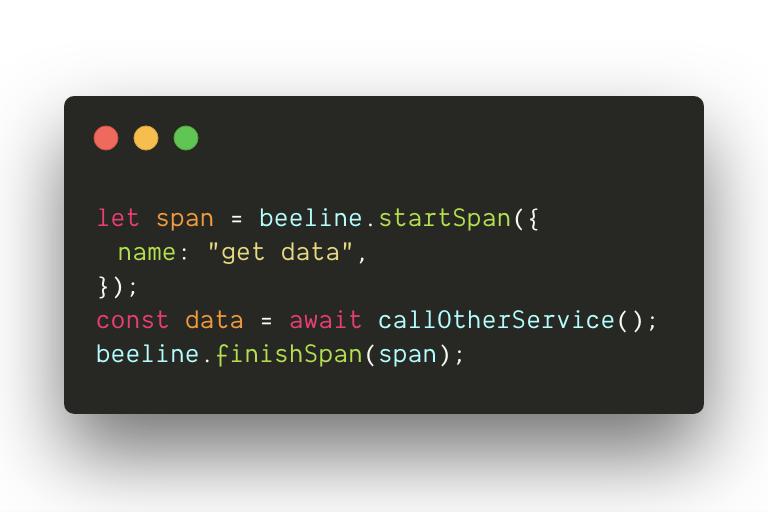
You will better understand the best practice approaches, see Honeycomb in action including a demonstration of how to use Honeycomb’s NodeJS Beeline. This does most of the heavy lifting helping to instrument and ingests system data so you can quickly begin to run queries and visualize what is happening with your system. Instrumenting with Honeycomb is as easy as insert some lines of code. We will show you how working closely with dev team-members will help everyone diagnose problems when they happen and overall spend less painful time on call and asking too many questions which in many cases never get fully resolved.

As a reminder, we support other languages including Go, Python, Ruby, Rails, and are soon to release Java so if you are interested in learning more, send us an email…
Honeycomb Learn brings 5 episodes held monthly ending in June. See below for future dates and topics. All will be recorded so you can share them across your team for on-demand viewing:
Date of webcast |
Working title |
| 2/27/2019 | Instrument Better for a Happy Debugging Team |
| 3/20/2019 | Better understand your production systems – set triggers, feature flags, and watch your top-line KPIs (Fast Query / Analysis) |
| 4/24/2019 | Rapid Incident Response using Distributed Tracing |
| 5/29/2019 | Spot system outliers and anomalies quickly with BubbleUp and Learn how to use Interactive Visuals to discover where issues lie |
| 6/25/2019 | Curate, share and bring team-wide collective intelligence with you when on-call |


