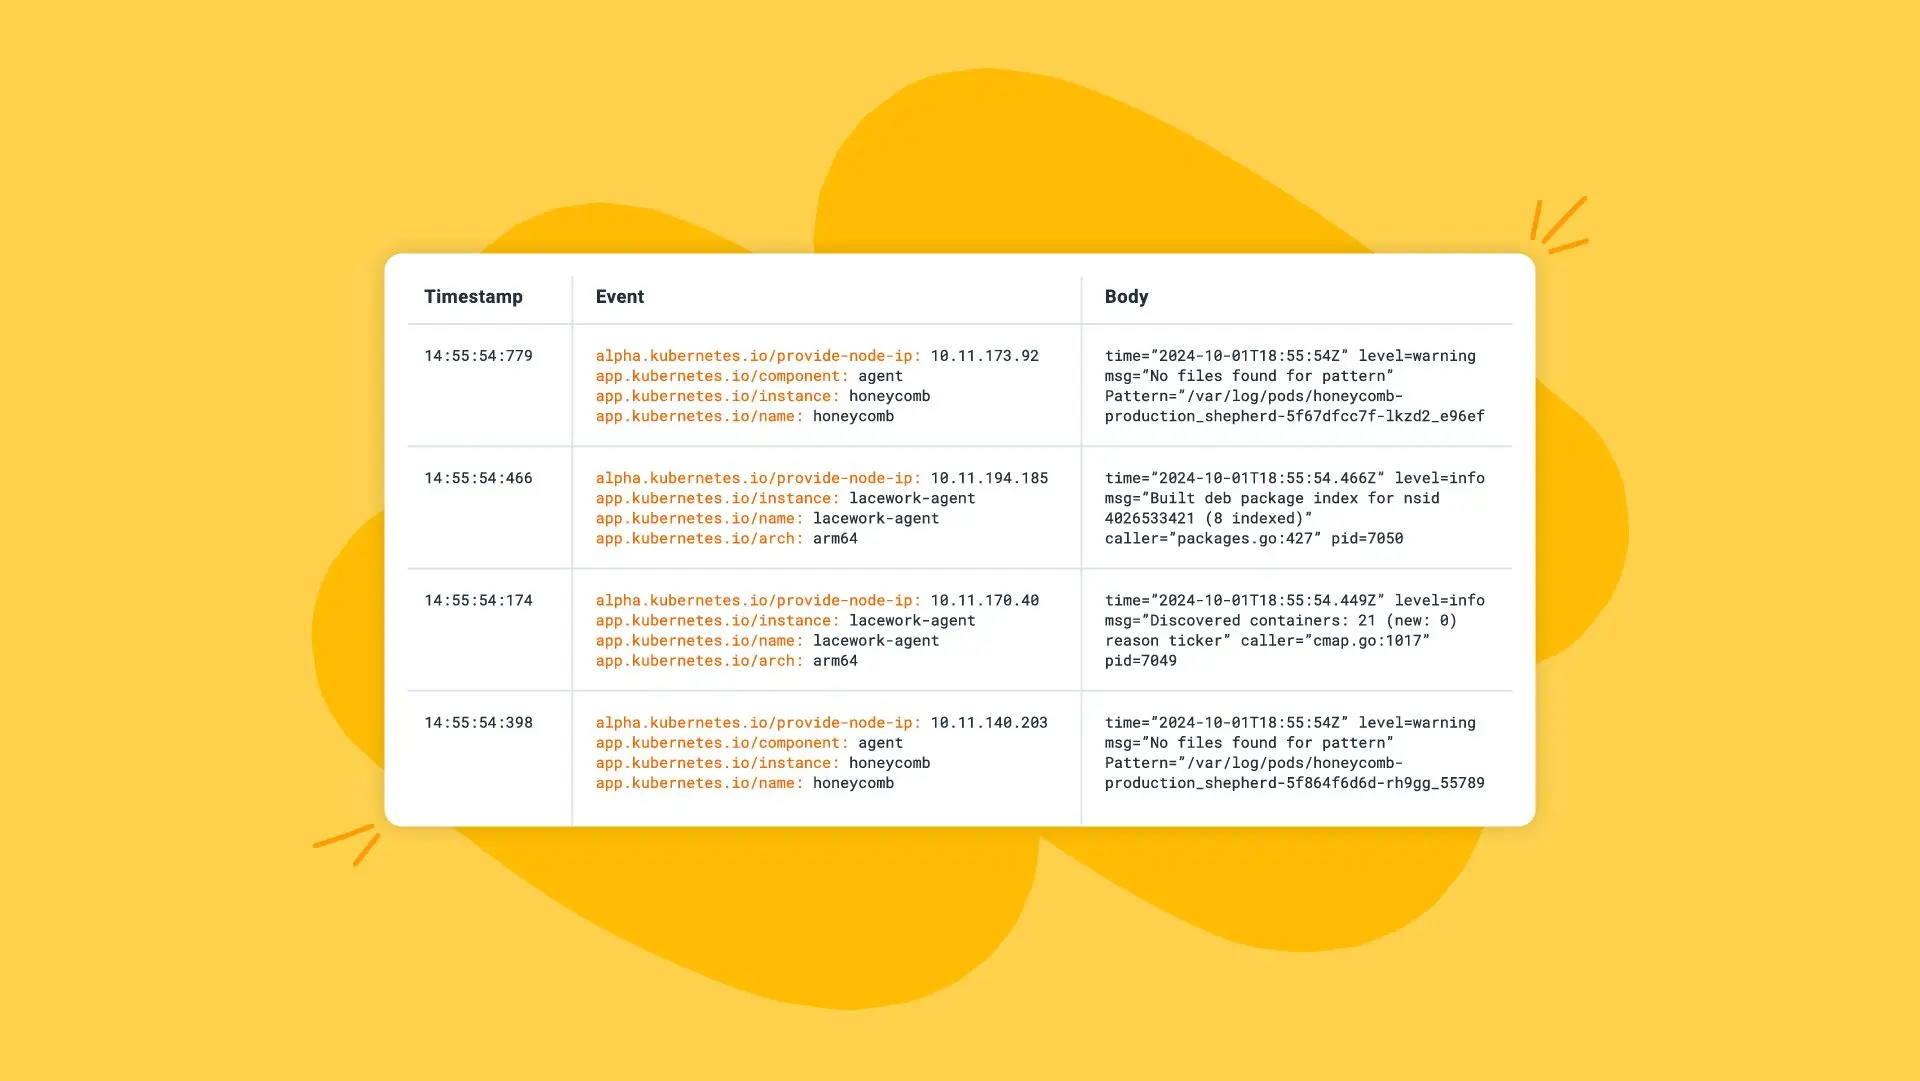
The Log Monitoring Guide for Sweet Insights
Logs are more than just records. With proper log monitoring, they become the honey that sweetens observability. Observability is your ability to understand and optimize your system’s behavior. Turning raw logs into actionable insights requires the right tools, practices, and insights. This blog post is a guide on log monitoring key concepts and best practices for sweetening your observability.

By: Rox Williams


The Bridge From Observability 1.0 to Observability 2.0 Is Made Up of Logs, Not Metrics
Learn MoreLogs are more than just records. With proper log monitoring, they become the honey that sweetens observability. Observability is your ability to understand and optimize your system’s behavior. Turning raw logs into actionable insights requires the right tools, practices, and insights. This blog post is a guide on log monitoring key concepts and best practices for sweetening your observability.
What are logs?
Logs are digital records of events within a system. When applications, servers, or services perform tasks, they often generate logs documenting an action or change in the system state. These logs have the potential to produce valuable insights about system performance, errors, user activities, and security events. Logs are a recordkeeping tool that allow engineers to track every part of a system’s operation.
There are various types of logs, including application logs, which track events within specific applications; system logs, which provide a broader view of an operating system’s health and performance; and security logs, which detail user activities and security-related events. Understanding the different types of logs allows for effective logging and monitoring. To get information about each type of log, we need to monitor them.
What is log monitoring?
Like the worker bees that collect nectar to produce honey, we collect our logs to produce insights into our systems. Log monitoring is the continuous process of collecting, analyzing, and visualizing system logs to track system performance, detect issues, and respond to incidents.

Log monitoring is crucial in modern software development, where complex systems are often distributed. Developers and IT teams need both log monitoring and observability. Teams typically monitor their logs when there is an issue; it helps them resolve and troubleshoot effectively in the case of system failures. Observability allows teams to look at their systems at any time, whether the system is working well or not. Effective log monitoring supports observability, allowing teams to analyze logs and observe their systems.
How does log monitoring work?
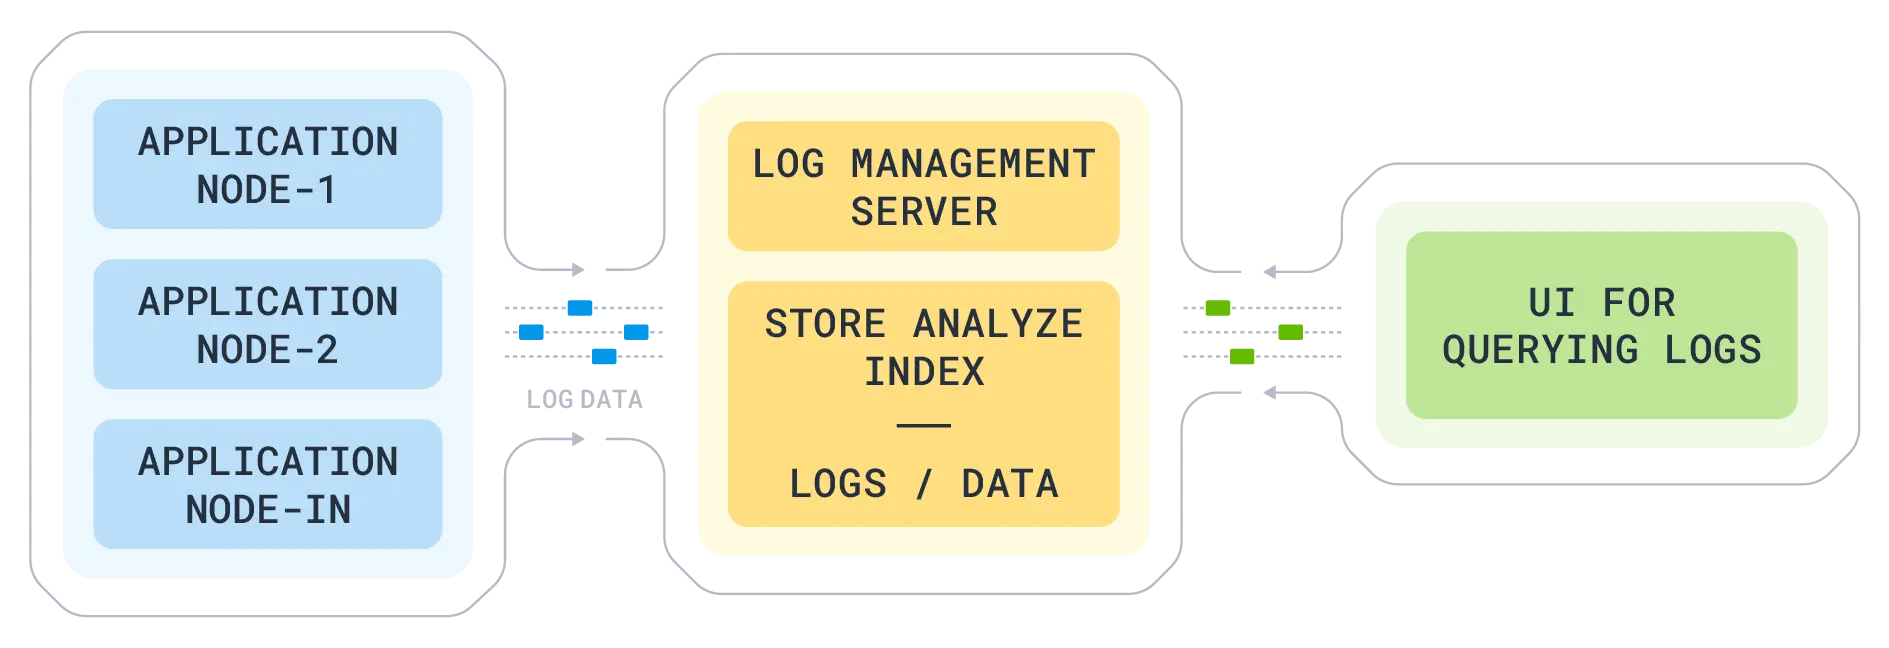
- Log collection: Raw logs are collected from various sources, including applications, servers, and databases.
- Log aggregation: Logs are centralized in a single location.
- Log parsing: Metadata is added to logs and structured formats are applied to logs.
- Storage: Logs are stored in databases and cloud storage, often optimized for searchability.
- Analysis and visualization: Tools allow us to analyze logs dynamically, query them, and surface patterns and anomalies with visual dashboards.
- Alerting and notification: Thresholds and rules trigger real-time alerts for issues or anomalies.
When to use log monitoring
Log monitoring can enhance system resilience and security. It answers the question, “Is my system healthy?” There are many reasons to use log monitoring; we encourage every team to employ some level of logging. Introducing log monitoring can be especially useful for the following use cases:
- Incident response: To detect and diagnose issues when systems go down or slow down.
- Security compliance: To comply with security and regulatory standards by monitoring for unauthorized access and other system behaviors.
- User behavior analysis and performance: We recommend using logs and traces to identify bottlenecks and user behavior patterns.
Log monitoring best practices and what to avoid
Do:
- Use logging best practices: Treat your logs as structured events wherever possible to allow log monitoring tools to process effective insights. You can follow our logging best practices guide for more details on structured logging and other logging best practices.
- Iterate on alert thresholds regularly: Avoid alert fatigue by configuring alerts to detect customer-facing impact, and turn off alerts that don’t require action. Service Level Objectives are especially effective.
- Create log retention policies: Retain logs as long as needed for analysis but only as long as necessary; manage storage efficiently.
Avoid:
- Sensitive data in logs: If logs contain sensitive data, like Personally Identifiable Information (PII), then proper storage is more difficult. Worse, this requires limiting access to log data, and that reduces the value of logs for observability.
- Relying solely on logs: Logs provide valuable event-level details but lack the holistic perspective that metrics and traces can offer. Use OpenTelemetry (OTel) to add distributed tracing.
Following these practices will ensure your log monitoring setup is effective, secure, and informative. For additional information on maturing your organization’s observability, read our observability maturity model.
Choosing the right log monitoring tool
Here are some features to prioritize when choosing a log monitoring tool:
- Scalability and performance: The tool should handle large volumes of log data without lag.
- Analytical intelligence: Features that help identify trends and prevent incidents.
- Ease of integration: Compatibility with your existing tech stack.
Log monitoring tools are critical in turning raw data into actionable insights. For example, Honeycomb’s modern observability platform can derive metrics and insights from logs, simplifying debugging and alert fatigue. A practical example of this is the Fender case study, which describes how Fender improved its software efficiency and reliability.
Logs in the hive: How Honeycomb simplifies log monitoring
Honeycomb provides different features through its developer-first observability platform.
- Honeycomb converts your logs (and traces) into metrics on demand, so you can get the high-level view and also drill into detail.
- The Honeycomb Telemetry Pipeline takes existing logs and OpenTelemetry data and helps you structure it for maximum value.
- Honeycomb SLOs provide alerting in context, with built-in anomaly detection to get you to the source of the problem.
- Honeycomb’s UI provides the fastest, clearest interface for getting information from your logs.
Features like high-speed querying, user-friendly dashboards, and collaborative workflows enable teams to go beyond basic monitoring.
Conclusion
This blog post discussed key concepts for transforming log data into actionable insights. By monitoring real-time logs, teams can optimize their systems, leading to smoother user experiences and reduced downtime. Security log monitoring offers an added layer of protection by detecting suspicious activities early, helping prevent breaches and unauthorized access. Log monitoring solutions can automate alerts and error detection, reducing dashboard fatigue.
Read the whitepaper: The Bridge From Observability 1.0 to Observability 2.0 Is Made Up of Logs, Not Metrics
Want to know more?
Talk to our team to arrange a custom demo or for help finding the right plan.