Redefining RUM: A Comparative Gap Analysis of Existing Tools
Real user monitoring (RUM) began as a straightforward approach to tracking basic web performance metrics. Focused on things like page load times and response rates, RUM relied on server-side logging and simple browser timings. While these tools captured Core Web Vitals (CWVs), they offered limited insights into how users actually interacted with pages, focused mainly on server-side performance.

By: Fahim Zaman


It’s 2025, The Frontend Deserves Observability Too
Learn MoreReal user monitoring (RUM) began as a straightforward approach to tracking basic web performance metrics. Focused on things like page load times and response rates, RUM relied on server-side logging and simple browser timings. While these tools captured Core Web Vitals (CWVs), they offered limited insights into how users actually interacted with pages, focused mainly on server-side performance. As JavaScript-driven dynamic applications with rich client-side interactions became the norm, traditional RUM tools struggled to provide the detail needed for frontend issues. The result: frontend teams were left guessing and experimenting to debug complex, modern web apps effectively.
The gap in client-side context makes it difficult for developers to find issues before customers do. To ask proactive questions about usability and UX, frontend teams rely on analytics products, but are often hindered by a lack of full-stack data, or if the data is present, it’s not high enough fidelity to make sense of what a user is actually doing on the site. Even modern RUM features, like detailed session replays and source maps, lack the ability to show you which unknowns coincide with the slowness you identify.
This break in critical, wide line of sight frontend analysis is what compelled our recent launch of Honeycomb for Frontend Observability. To bridge the gap, Honeycomb combines rich frontend attributes with end-to-end trace context and lightning-fast pattern detection workflows. This approach for frontend teams is designed to fulfill four important goals:
- End-to-end pattern detection and fault localization
- Site performance budgeting and optimization
- Understanding the context behind user interactions
- Cost control without compromising on accuracy
In the following section, we’ll compare the strengths and gaps in an assortment of RUM solutions offered by popular observability vendors and contrast them with our approach to frontend observability. Let’s dive in.
Dynatrace: AI-driven full-stack insights
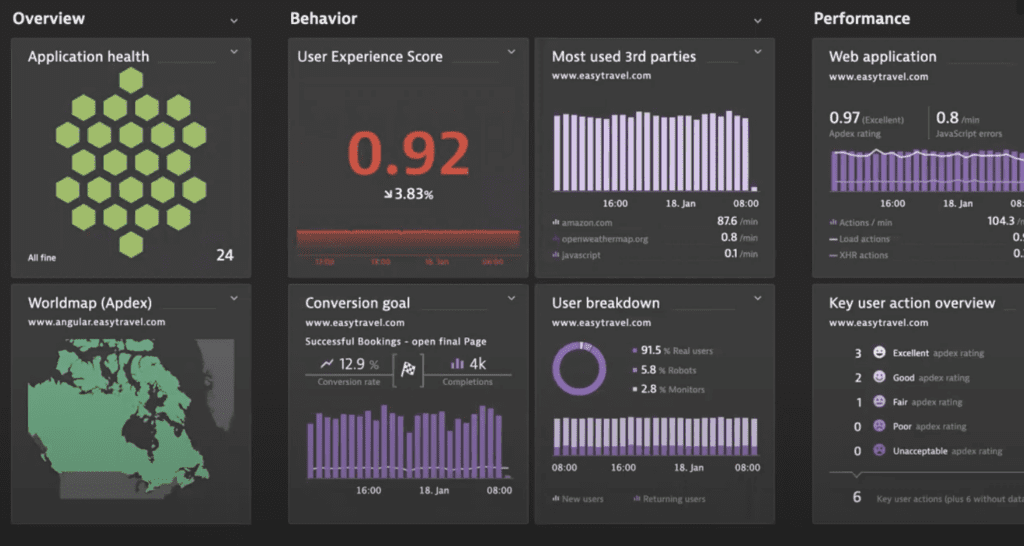
Dynatrace is widely known for its automatic full-stack insights, enhanced by AI-driven analysis and correlation. Similar to big-box observability retailers like Datadog and Splunk, Dynatrace’s RUM debugging process integrates with a host of other observability features.
Strengths:
- Polished end-to-end issue visualization brings together additional context signals from the many tools Dynatrace offers (trace, metric, log, profile, and other associated data for any given frontend snag).
- AI-driven analysis and pre-packaged issue grouping makes it easier to find relevant insight.
Gaps:
- Custom tagging within Dynatrace provides less context than OpenTelemetry (OTel), and drives metadata through operators within Dynatrace.
- Attribute analysis is suggestion-based rather than user-empowering, with engineers relying heavily on AI for field detection of unknown causes.
- Dynatrace filters and monitors require pre-aggregating data, reducing readiness and relying on prior awareness and tenure.
- Lacks built-in context for performance budgets.
- Sampling for RUM is based on blunt, head-based percentages or activates in a black box when traces exceed bandwidth.
New Relic RUM: Great compatibility, but costs run amok
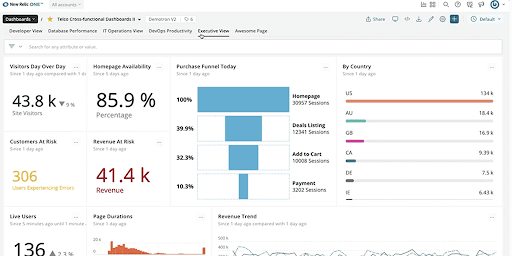
Popular with developers, New Relic RUMoffers a quick integration with a wide range of frontend app libraries, allowing teams to stream metrics and full-stack traces directly into the platform. It also connects trace data with relevant development environments, such as VS Code.
Strengths:
- Broad range of integrations and compatibility with various tools.
- Seamless connection between trace data and developer IDE workflows.
- Integrated platform with AI-driven suggestions to guide users.
Gaps:
- Pricing plans may limit data exploration or restrict the number of users.
- Sampling may result in lost data, reducing visibility.
- No built-in performance budget context to guide developers.
Sentry RUM: Deep context, but less flexibility
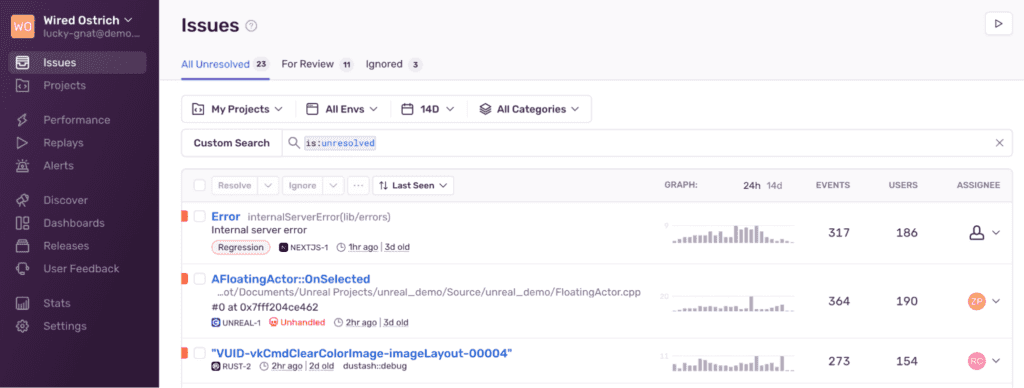
Sentry RUM unifies error tracking, performance monitoring, and issue management in a single interface. It integrates directly with IDEs, is aware of stack traces and source maps, and even understands code ownership through GitHub profiles.
Strengths:
- Efficient error/spike routing to specific owners.
- Pulls error context across platforms, providing a holistic view of issues.
Gaps:
- Custom attributes rely on tags generated by the frontend user, with less context available from backend systems.
- Lacks Service Level Objectives (SLOs) for performance budgeting.
- Attribute analysis can be deep but not wide, limiting flexibility.
Raygun RUM: Lightweight tool, but lacks support
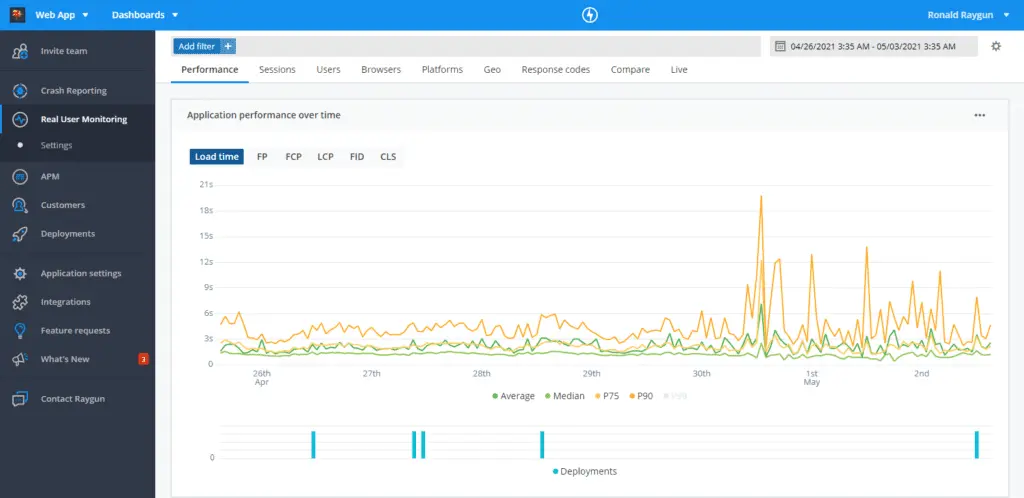
Raygun RUM offers a lightweight SDK tailored for frontend performance monitoring. Designed with frontend use cases in mind, Raygun allows developers to pinpoint bottlenecks and track performance in local environments.
Strengths:
- Easy setup, designed specifically for frontend applications.
- Command-line interface (CLI) allows commands to be executed directly from the console.
Gaps:
- Pricing plans restrict exploration, which may be limiting for teams needing deeper analysis.
- No SLO support for performance budgeting.
- Lacks support for logs, making it less effective for exploring high-context structured data.
How Honeycomb for Frontend Observability fills gaps
The gaps highlighted in contemporary RUM solutions lead to a difficult status quo for frontend devs where pinpointing issues, maintaining performance, understanding user context, and controlling volume costs are all more opaque than they need to be. Here’s how we’re changing each of these:
End-to-end pattern detection and fault localization
Status quo: Most existing observability vendors struggle to analyze end-to-end tracing data. It can be challenging to pinpoint where problems arise across the stack, especially when issues span multiple services.
With Honeycomb: Honeycomb provides a powerful tool for full-stack pattern detection. You can review detailed visualizations of Core Web Vitals and easily identify performance bottlenecks while observing the correlation between backend and frontend metrics.
Better site performance budgeting and optimization
Status quo: CWV attribution data is often disconnected from key frontend performance metrics, making it harder to optimize site performance efficiently.
With Honeycomb: Honeycomb for Frontend Observability uses a wrapper around OTel web instrumentation, capturing detailed performance metrics and attributing them directly to CWVs. This makes it easier to optimize site performance with precision, leading to faster load times and better user experiences.
Understanding the context around user interactions
Status quo: Traditional tools help identify issues by revealing spikes in metrics. However, they provide little insight into the context behind user interactions, making it hard to understand the full user journey.
With Honeycomb: Honeycomb for Frontend Observability goes a step further. It tracks clicks out of the box and provides context around interactions. This means developers not only see when issues arise but also get deeper insights into why, making it easier to diagnose and fix problems.
Cost control without compromising on accuracy
Status quo: Many observability platforms offer limited control over how data is sampled, often leading to a compromise between data granularity and cost.
With Honeycomb: HFO’s flexible sampling capabilities let you control the data you preserve while maintaining visibility into important trends. This enables teams to manage costs effectively without sacrificing accuracy or data fidelity.
How Honeycomb for Frontend Observability works in practice
Let’s walk through how the Honeycomb UI brings the above all together.
Let’s say we want to see how things are going today on the frontend and optimize any outliers. We start by looking at the Web Launchpad that not only shows us CWVs like LCP, CLS, and INP, but lets us view the associated event, trace, or granular query behind every line and spike on these graphs.
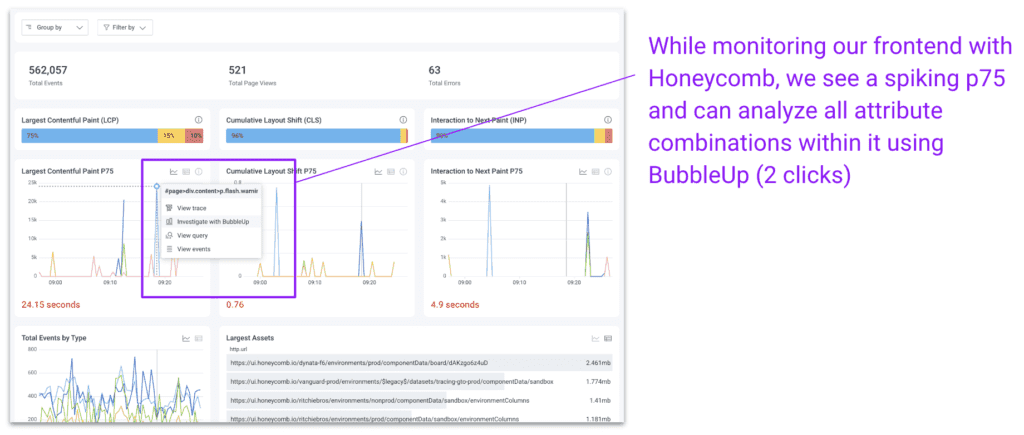
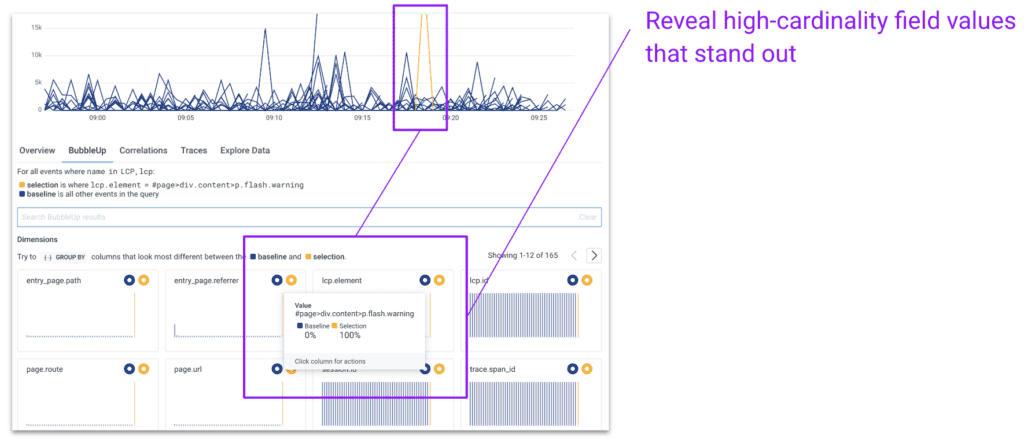
Here, we go even further and select “Investigate with BubbleUp” on an LCP spike. Within three seconds, this takes us to Honeycomb’s histogram analysis of every single high-cardinality attribute value associated with the events experiencing that LCP spike. Honeycomb reveals the page path, referrer, id, and specific element found only in the selection.
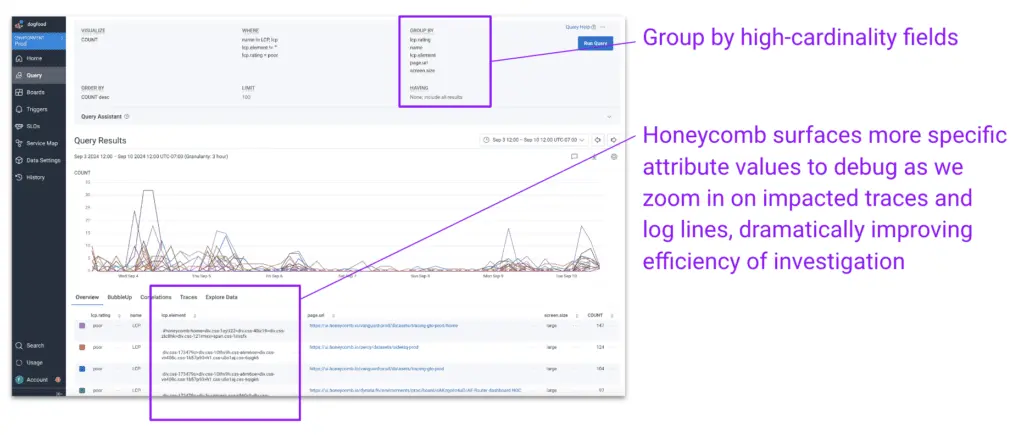
With the context we get from BubbleUp, we can use Honeycomb’s powerful high-cardinality Group By queries to further understand what’s causing our slow LCP. We can group by rating, name, element, URL, and screensize to see what attributes of a frontend experience frequently score poorly. This already lets us know, through fast analysis, where to look in Honeycomb’s trace or log explorer views to solve our problem with confidence.
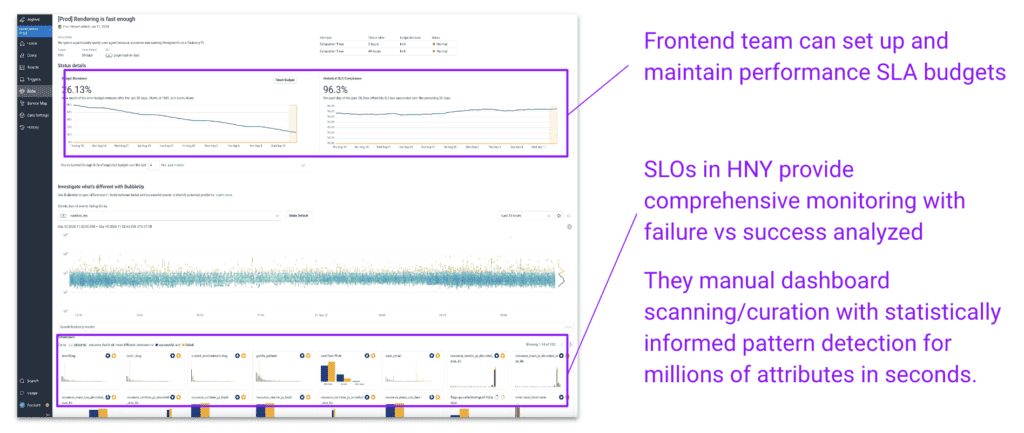
Honeycomb for Frontend Observability also works for teams that proactively define success and failure and manage a performance budget with SLAs. The analysis interface this provides takes users directly from budget alerts to debugging context without wasting any time.
Conclusion
The modern web development landscape demands solutions that can provide full-stack visibility, deep insight into specific user interactions, and precise performance budget management for prioritization. Traditional RUM tools, while honed and polished for usefulness with familiar errors, often fall short in delivering the context and granularity needed for today’s dynamic, unpredictable applications.
Honeycomb addresses these gaps by combining end-to-end traceability, context-aware performance insights, and cost-efficient data management. By doing so, Honeycomb enables frontend teams to troubleshoot more effectively, optimize site performance, and better understand user behavior—all while keeping costs under control.
Honeycomb for Frontend Observability is now generally available to Honeycomb Enterprise customers on Environments. Ready to see how it can help you improve your frontend and consolidate your observability tooling?
Book some time with us to get a personalized demo.
Want to know more?
Talk to our team to arrange a custom demo or for help finding the right plan.