Customer success can be a serious differentiator and competitive advantage for companies today. Everyone wants to ship quality products to their customers faster, and the rise of subscription-based pricing and SaaS applications in the last decade means that ensuring customer success is a more critical part of the business than ever.
In technical support, we use the real observability Honeycomb provides to deliver quality information quickly — to both the customer and the engineering team (if an escalation is required). The more our support engineers are able to observe what is happening in the customer’s service, the faster they are able to pinpoint the problem and solve it.

Of course, we use Honeycomb at Honeycomb to monitor and troubleshoot our service — but what you might not know is that we also use Honeycomb extensively in technical support. We in Support get a lot of benefit from having access to the observability tools the rest of our engineers enjoy. Here are our recommendations for achieving observability benefits in your customer-facing teams:
Integrate Honeycomb into support systems for fast access to the important details
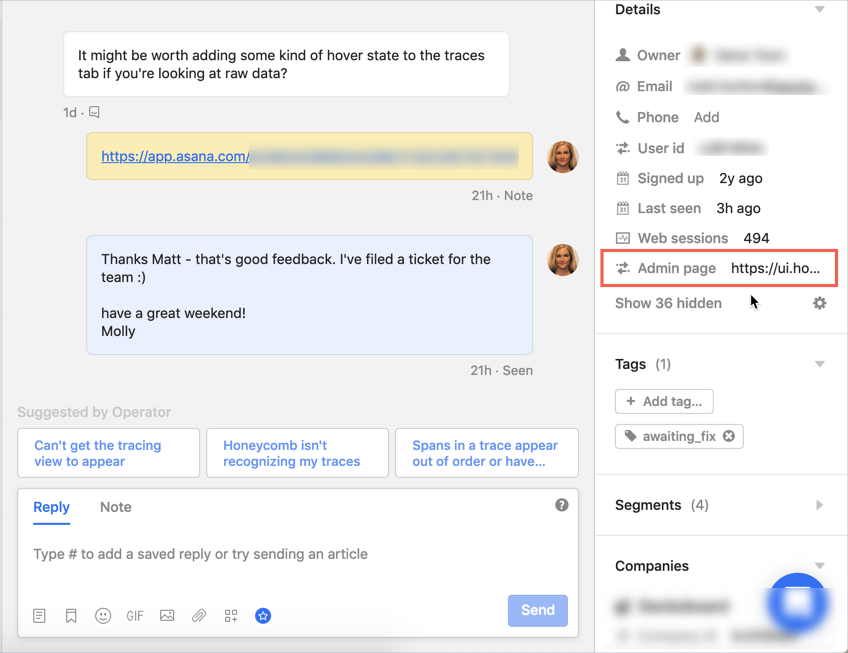
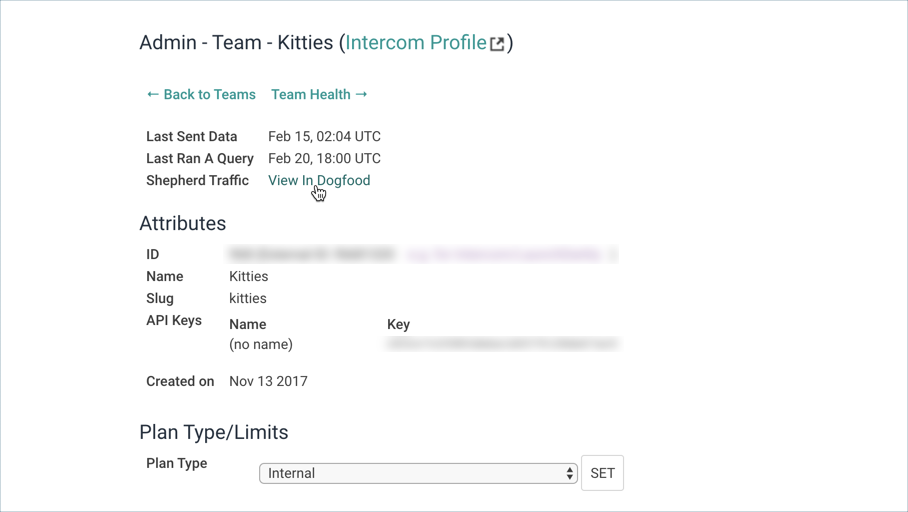
We deliver much of our support through Intercom, where customers chat with our engineers, request help, and report problems. From within the Intercom window, the Support Engineer can jump directly to that customer’s Honeycomb admin page to investigate problems.

Additionally, we use Honeycomb query templates integrated into our internal systems so that (with permission) we can observe a customer’s data within Honeycomb. For example, customers occasionally have problems sending data in. With one click, the support engineer can pull up the ingest dataset (called Shepherd) that tracks events from our collectors to immediately see whether or not we’re receiving traffic from that customer and, if we are, to determine if there are any problems.

Leverage Boards for run book automation and enable Support do more, faster
Just like in IT, Support uses run books. Although the cause of a problem can be different every time (i.e. you don’t know all the questions you will need to ask to solve the problem), we can all agree that there are things you always need to check when troubleshooting. Plus, you always have new team members coming up to speed, and run books really help them ramp and add value quickly. Further, when you bring good data that you’ve already gathered about the problem, Engineering is much happier when you escalate to them–you’ve saved them a lot of time up front.
Here’s a recent example where I used Honeycomb Support’s Shepherd board to troubleshoot a customer issue.
Customer writes in: “Hey, after 2:30pm, none of my data is appearing in my dataset – it just stopped showing up, but I’m still sending it…”
Me: “Ok – let me check on that…”
I click the admin link for their account right there in Intercom and click on the Shepherd board to bring up our collectors data relating to their account.
Our run book for troubleshooting event collection problems involves isolating the data down to the particular customer and then checking for errors, large time discrepancies (between when the event was sent and when our collector received it), rate limiting and other possible causes.
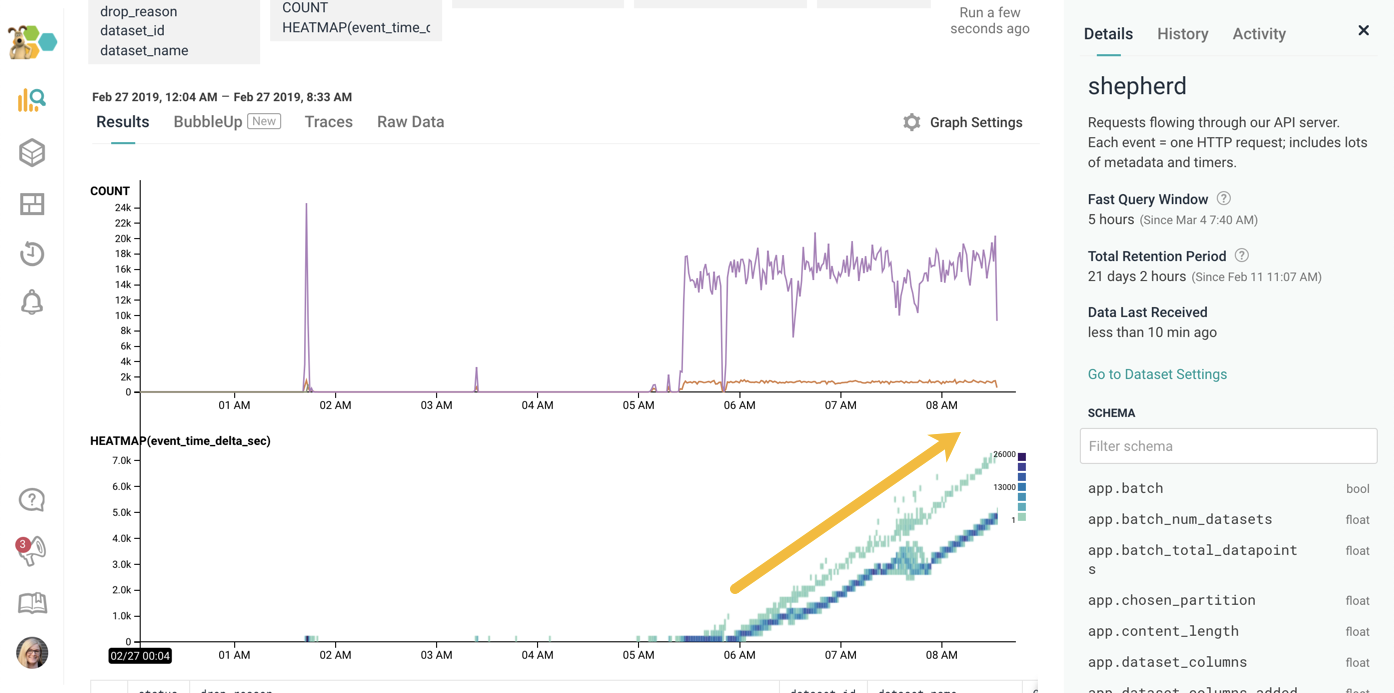
In this case, just pulling up the Shepherd board for them showed this:

Something is obviously up, right?
The heatmap (the bottom graph) shows near linear growth for the field event_time_delta_sec. That field represents the difference between when the event was sent from the client system to when we received it. Larger numbers mean larger delays between when the event was sent and when we received it. And this customer’s was growing linearly! Near the end of the graph — where we show data points at 7K and 5K seconds, the time delay between when the event received its timestamp and when we received it was between 90 minutes and 2 hours!
Something was happening on the customer’s side. I explained that we were seeing a large bottleneck on their side — the events were being generated (the created timestamp) – but weren’t being sent to us for over an hour (our received timestamp) — I also shared that the event volumes (the line graph) had spiked up and sustained at around 19K.
Sure enough – they were running a load test on their side that turned out to be generating a large number of events through a small pipe. Basically they couldn’t send the events fast enough so they had a big backup happening on their end.
Ultimately, the events hadn’t stopped showing up in the dataset – they were just taking far longer to appear in the dataset than the engineer expected.
Using Honeycomb in Support allowed me to immediately see what was happening and give the customer the information they needed to understand and solve the problem quickly. Being able to deliver useful information and solve customer problems quickly makes everyone happy 🙂
Encourage Support to contribute to instrumentation efforts
At Honeycomb, our support team writes code and is encouraged to augment existing instrumentation to help the team do their jobs better. By sharing in the ownership of creating observable systems, the support team has a much better understanding of how the system works and how to leverage Honeycomb to observe its behavior.
While not all teams may be comfortable having support contribute to the code base, I have found that inviting the team to participate in instrumentation creates a more engaged team with a deeper understanding of the systems they’re supporting. I encourage more support teams to participate in the creation of observable systems.
Empower your Support Team with observability to better serve your customers
Access to the real power of observability gives your customer-facing teams a real edge in their efforts to deliver customer success. Integrate Honeycomb into your support systems and processes to drive faster resolutions to customer issues. Your Support engineers will be happier too!
Looking to level up your Support/Customer Success team? Give us a shout!


