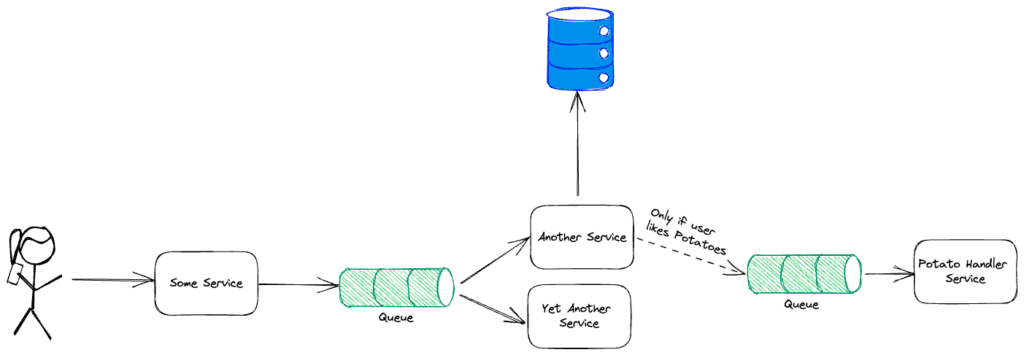
At Traceloop, we’re solving the single thing engineers hate most: writing tests for their code. More specifically, writing tests for complex systems with lots of side effects, such as this imaginary one, which is still a lot simpler than most architectures I’ve seen:

As you can see, when an API call is made to a service, there are a lot of things happening asynchronously in the backend; some are even conditional.
Traceloop leverages LLMs to understand the OpenTelemetry traces outputted by such systems. Those LLMs can then be used to generate tests that make sure that the system always works as designed. So, for example in the above diagram, we make sure that:
- Another service stores data in the database
- Potato Handler Service is only called if the user actually likes potatoes, and so on…
But how does it actually work?
While LLMs are kind of magic in many domains, having them generate high-quality tests is a difficult task. We need to give the LLM significant context about what’s happening in the system so it can generate meaningful tests. But we can’t simply add all the traces to the prompt. Even our smallest client sends us millions of traces on a daily basis, which is way too large as a context for LLMs.
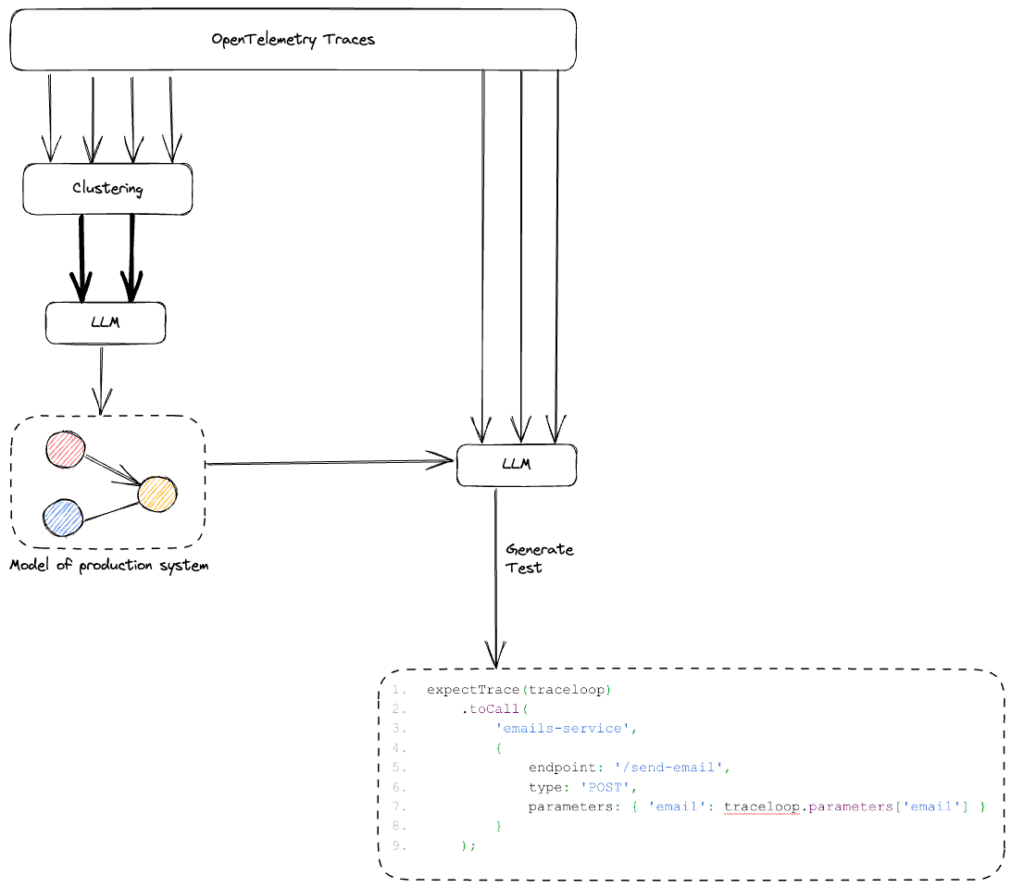
Instead, we needed to figure out how to create a compact representation of the system which can then be used to generate the tests. This resulted in a three-step process, depicted below.

- Cluster the incoming traces and choose a single representative trace from each API call in the system.
- Use all the representative traces to build a semantic model of the system, which models everything within the system: services, entities, and endpoints.
- Use the model as context to an LLM that generates tests based on traces. The semantic model, together with our LLM, allows us to build tests of complete user journeys, and set up the test with the right system state.
These tests are then run using our open-source test runner, which allows writing and running trace-based tests (give it a try!).
Honeycomb as a data exploration tool
It took us a while to figure out the right way to model the system as a context to our LLM. Given the millions of traces we receive per customer, we needed a way to easily explore the data, discover patterns, and quickly iterate.
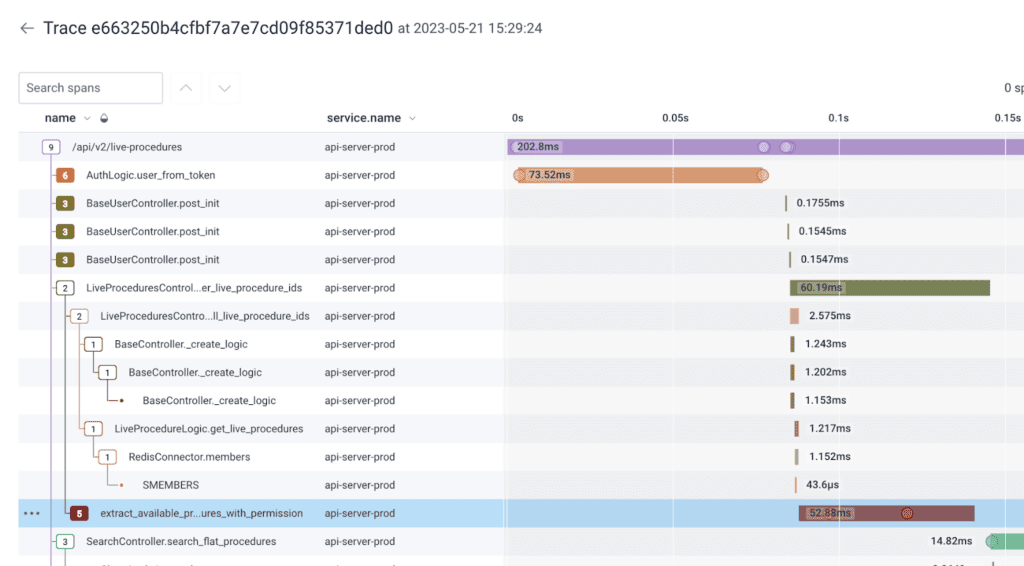
Honeycomb provided us with the best set of tools to visualize the data, explore and search for patterns, and improve the features we were using to build our internal models. Just viewing the traces for each new customer in Honeycomb was invaluable for us as we fine-tuned and tweaked our processing pipeline to make it more robust.

Conclusion
OpenTelemetry is a goldmine of data about production systems, and large language models are the perfect tool to make sense of the millions of telemetries outputted. The possibilities are endless from smarter code and test generation to modeling and explaining complex systems. Join Traceloop’s community if you’re curious to learn more, and if you haven’t signed up for Honeycomb yet, we strongly recommend that you do!


