New to Refinery? Read our blog on achieving great sampling.
OpenTelemetry and Beelines were designed with assumptions about the types of traffic that most users would trace.
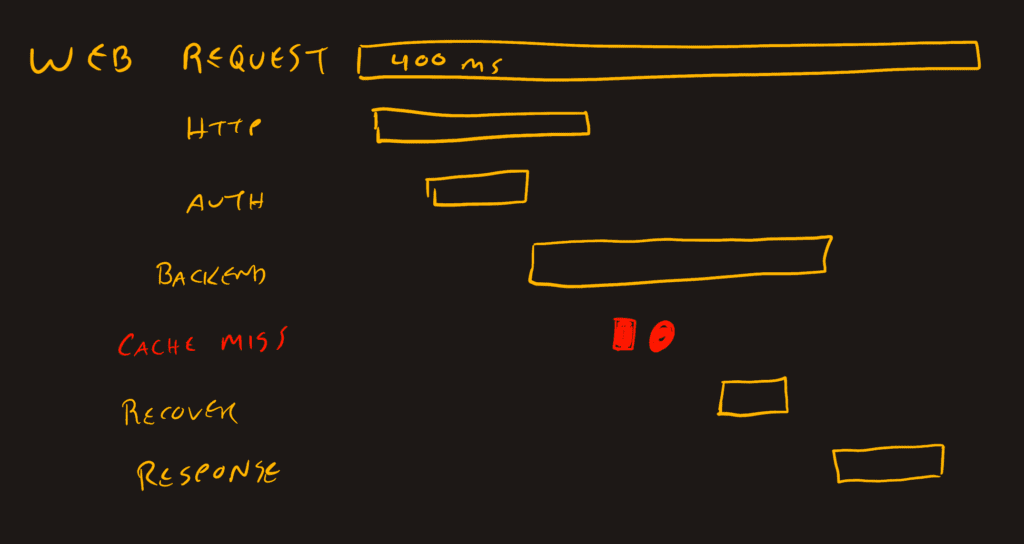
Assumptions:
- Traced data is for synchronous activity (we won’t want users to experience delays)
- A user requests something, which starts the transaction
- Multiple systems participate to generate a single response
- When the user receives their response, the transaction is complete
- Most traces will follow this pattern
Based on these assumptions, web application and API calls fit very nicely into a trace waterfall view. This is also the set of assumptions for Refinery, our sampling proxy, to manage the traces it processes. These assumptions are true for most traffic.
There are several other common application flows that are expressible by OpenTelemetry as a “trace,” but do not fit with these assumptions. They may exhibit one or more of the following:
- Duration is days or weeks
- Millions of actions are performed
- Units of work are too small or too big
- No clear start or end (request/response)
- Every trace has a novel pattern
For the most part, we can create traces of any shape using OpenTelemetry. Initialize it, and start sending spans with all the attributes you care about. There aren’t really any constraints at this level.
The constraints come from our ability to find value in these traces when we pull aggregates or analyze them in a visual representation. Some visualizations are flexible: we can generate aggregates by span so a trace with an absurd duration or number of descendants isn’t much of an issue. However, other visual representations rely on the start, end, and uniqueness of trace identifiers so that operators can draw conclusions about the performance of their systems.
What follows in this post are approaches to adapt non-request/response application flows for reasonable trace boundaries, where possible. If you want to look at examples right away, check out the various branches in this repository. Each branch matches with a header in this post that explains nuances to its approach.
Application flows which lead to exotic traces
Certain types of applications create exotic trace shapes because they don’t follow a request/response flow. For example:
- Batch processing usually creates one trace per run which can contain thousand or millions of jobs and account for many hours of execution time
- Stream processing typically creates one trace for a connection where most of it is empty, but when traffic arrives, it creates spans or constantly receives data and the trace goes on forever
- Proxies can be baked into the application trace, but sometimes they are operated by third parties who want to trace just the proxy traffic, which only has intermediate spans
- Machine learning and other data processing activity can emit too many spans to be useful
These are common software patterns that still benefit from observability. We need to be able to receive spans from their activities, evaluate their health and performance, and make improvements.
Each of these patterns can benefit from applying two approaches to create the best abstraction level possible:
- When a process executes continuously, we can manage trace identifiers more deliberately
- When a process does all of its work very quickly, we can take a summary approach to add attributes rather than spans
You’ll notice that these two approaches apply to different parts of each of the exotic trace types. The next sections will explore how to separate the trace into parts that can be coherent and useful.
Continuous or excessively long traces
For both the stream ingest and batch scheduler component, there’s a persistent thread that lasts for the duration of the connection, or all the jobs. For simplicity, I’m going to call this pattern “continuous,” even if it does have start and end points (they’re not a useful boundary).
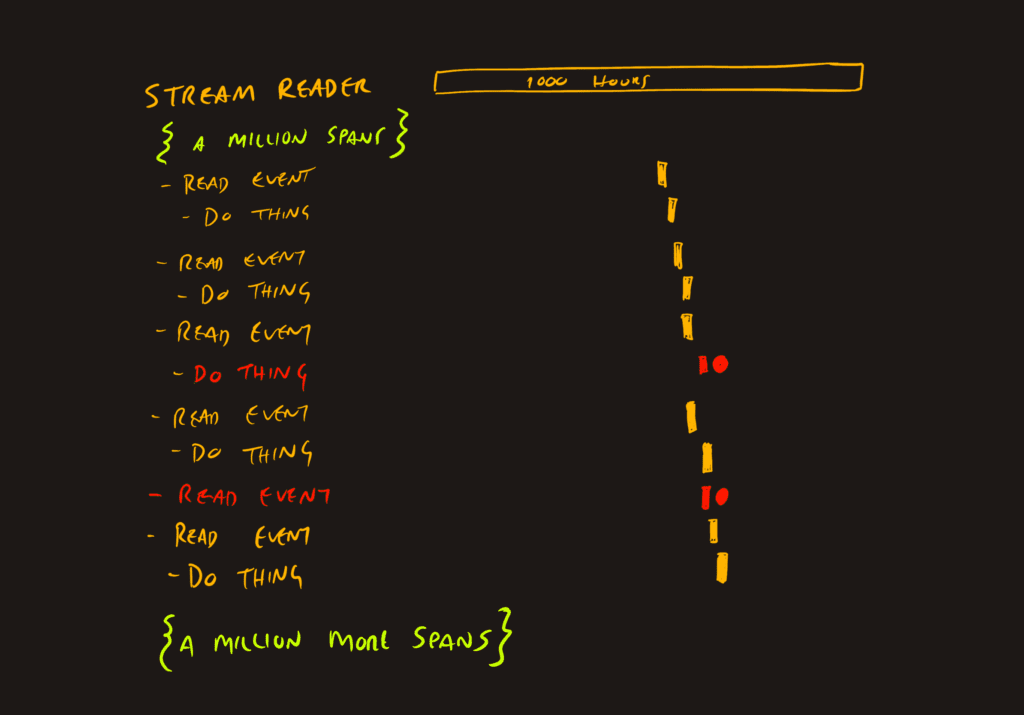
To clarify, there are batch schedulers that perform analysis and then build a nuanced graph of all the jobs so that inputs can align to outputs and parallelize for efficiency. There may be a very juicy trace generated by this evaluation process, but it’ll behave nearly the same as a request/response trace. Let that exist on its own. We don’t want that trace to have every action performed by every downstream job added to it.
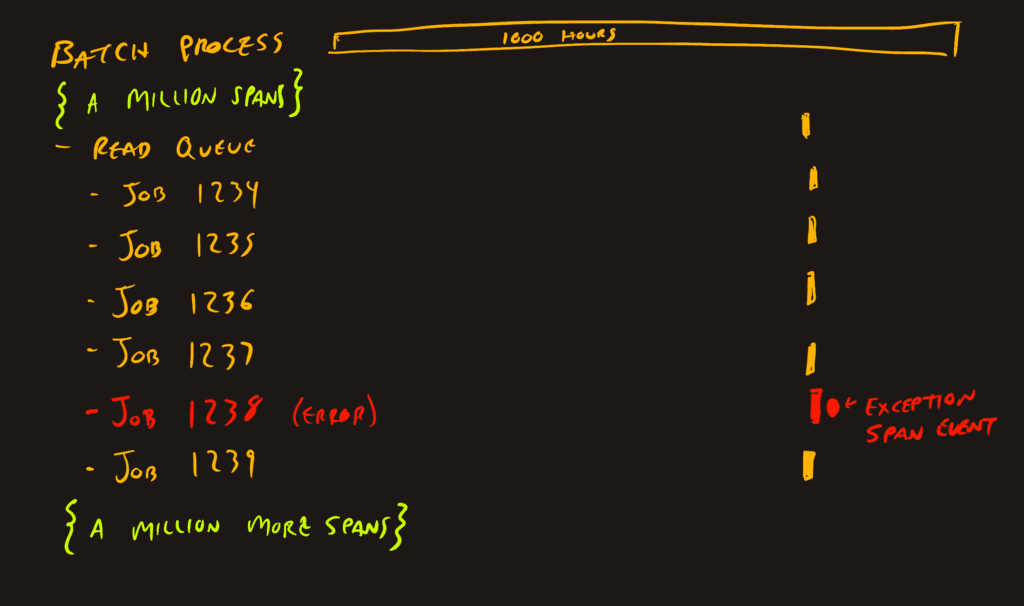
Single trace example, the default
Since traceparent information is propagated through applications and HTTP/GRPC requests automatically, there’s a good chance that your batch job trace will be big.
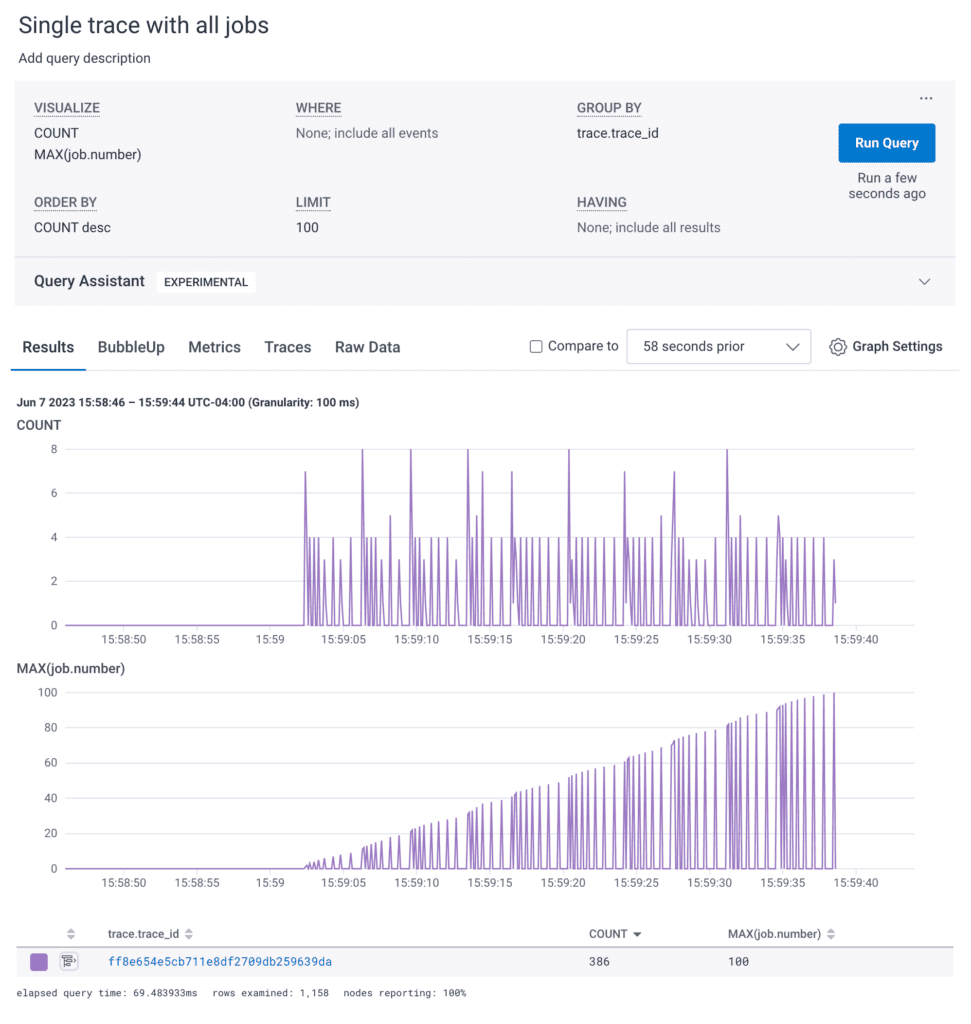
Here’s a query showing a batch system running 100 job in about 35 seconds. It’s at least a few orders of magnitude smaller than what we’d see in reality, but provides a nice foundation to adapt the instrumentation in a way that can address deficiencies.
Looking at the trace waterfall view of these spans, it shows a relatively flat series of events.
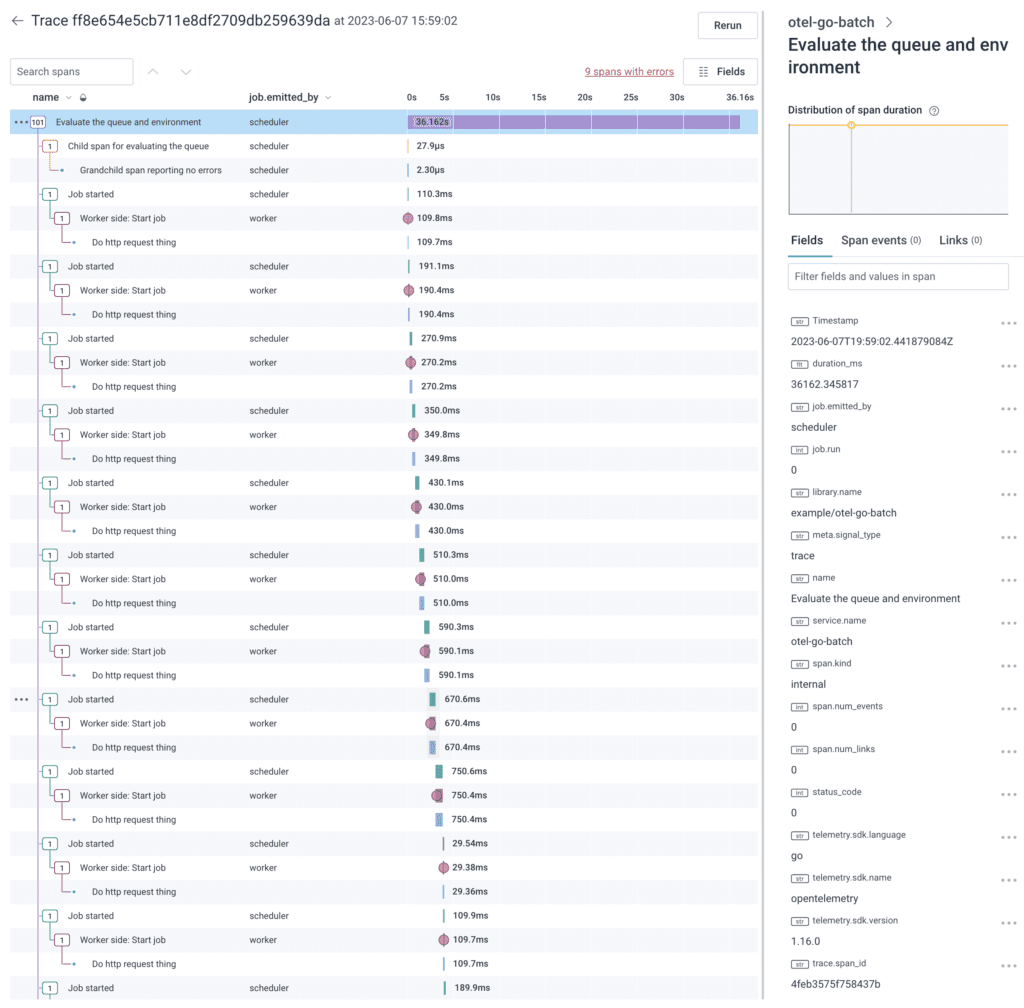
The flatness makes it so that each job and it’s children create a nearly uniform set of spans within the trace. These uninteresting jobs would be nice to apply a sampler to decide which to keep and which to drop. Since sampling decisions are made at the trace level, it becomes all-or-nothing.
You can also see there are some errors in this trace. If it were sent through Refinery, it’d get the “error” rule and keep all the uninteresting jobs.
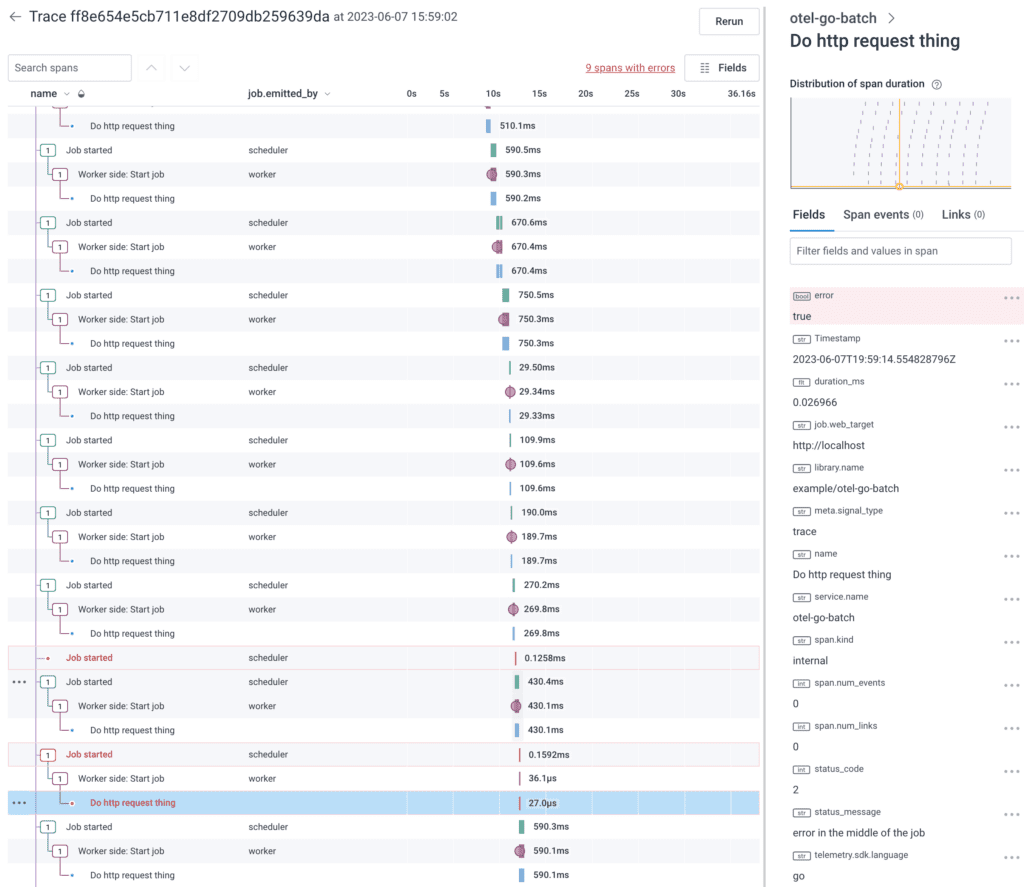
What can we do to improve this? Let’s start with changing the start and end points for the trace.
Starting a new trace periodically
When there isn’t a meaningful start and end to a trace, we have two options to break it up:
- Time-based, new trace every minute
- Count-based, new trace ever 10,000 items
The one minute and 10,000 item thresholds are arbitrary, but each has benefits and drawbacks.
If you start a new trace every minute, a particularly busy minute may overwhelm the trace viewer and a slow minute may have one or two spans in it.
If it’s being split based on a count of items, you end up with more traces starting and ending and the jobs overlapping. This makes for better summarization and concurrency and also allows Refinery to sample the scheduler traces when nothing interesting happens.
The goal is to avoid breaking a trace during an evaluation, but keeping the traces short enough that an error span or latency issue can be found. The trace around it must be meaningful.
The best approach is to split the trace every 10,000 items, or if it gets up to a minute without hitting the item limit, split there as well.
    for i := range jobs {
        if perTraceCountdown < 1 || lastNewTrace.Add(60*time.Second).Before(time.Now()) {
            fmt.Printf("new trace at jobnumber %d and time %s", i, lastNewTrace.String())

            spanWorker.SetAttributes(attribute.Int("job.period.ending_number", i-1))
            spanWorker.SetAttributes(attribute.Int("job.period.failures", failures))
            spanWorker.SetAttributes(attribute.Int("job.period.successes", successes))

            // reset the periodical counters
            failures = 0
            successes = 0
            lastNewTrace = time.Now()
            perTraceCountdown = 10

            // kill the last worker span
            spanWorker.End()

            // reassign the context to a new fresh one and make a new spanWorker.
            ctxWorker, spanWorker = tpWorker.Tracer("example/otel-go-batch").Start(context.Background(), "Next unit of jobs started", trace.WithLinks(startupTraceSpanLink))

            spanWorker.SetAttributes(attribute.Int("job.starting_number", i))
            defer spanWorker.End()
        }

        // perform the batch job, pass in the trace context
        err := doSomeJobWork(ctxWorker, int64(i))
        if err != nil {
            failures += 1
        } else {
            successes += 1
        }

        // decrement the job limiter
        perTraceCountdown -= 1
    }
For batches, you can start the trace when the job starts, and break it every time the count or duration threshold is met. For data streams, you can start a trace when the connection is made and apply similar thresholds to break the trace up.
In the Golang example above, the key to starting a new trace is to use the Tracer().Start() with a new context rather than passing in the existing trace context. ...Start(context.Background()... creates a new empty context and returns it to be sent to the next doSomeJobWork call.
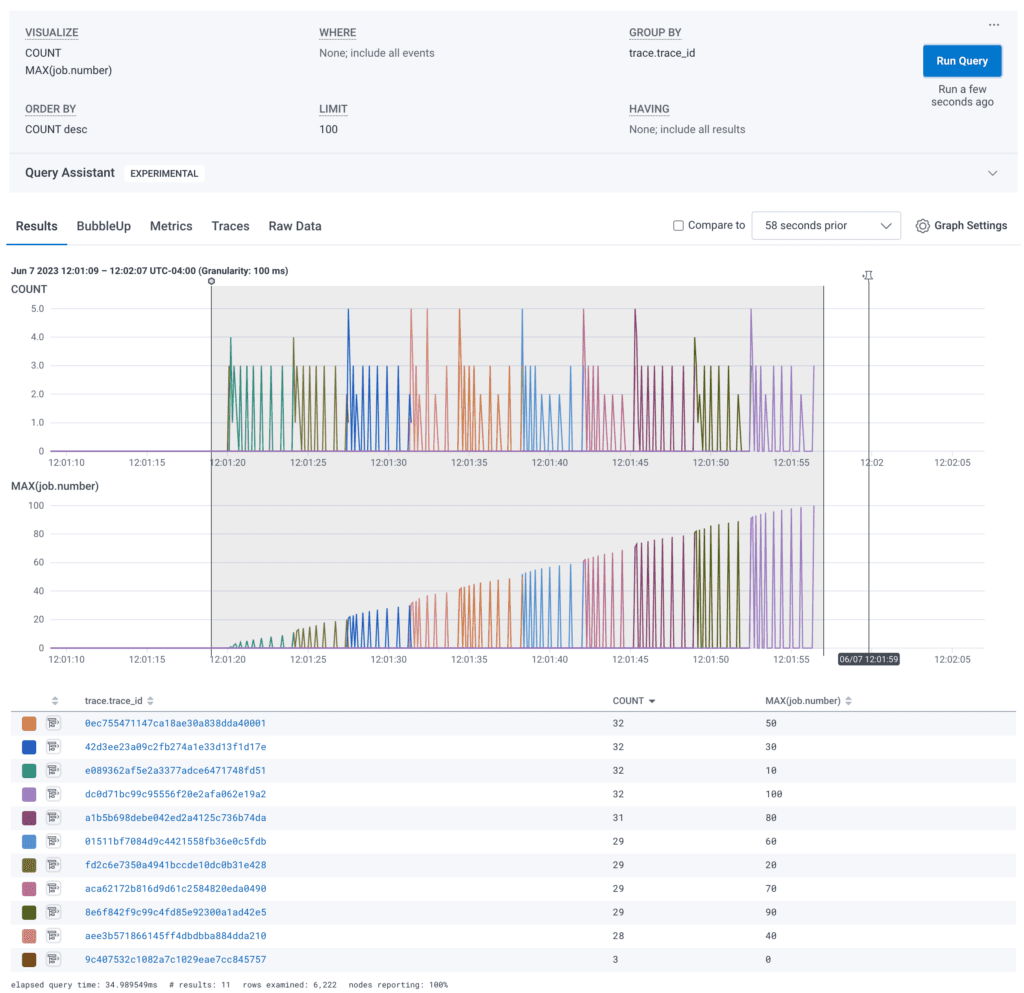
When the job performs work serially, changing out the traces periodically helps keep the sizes manageable and shorter in duration. In my test application, the timer created new traces every 10 jobs. That makes for a nice 🌈 rainbow 🌈 of trace identifiers.
Each trace waterfall is now shorter, so it can be rendered and reasoned about in Honeycomb. These have about 30 spans, but it could be a thousand times longer and still be rendered and evaluated.
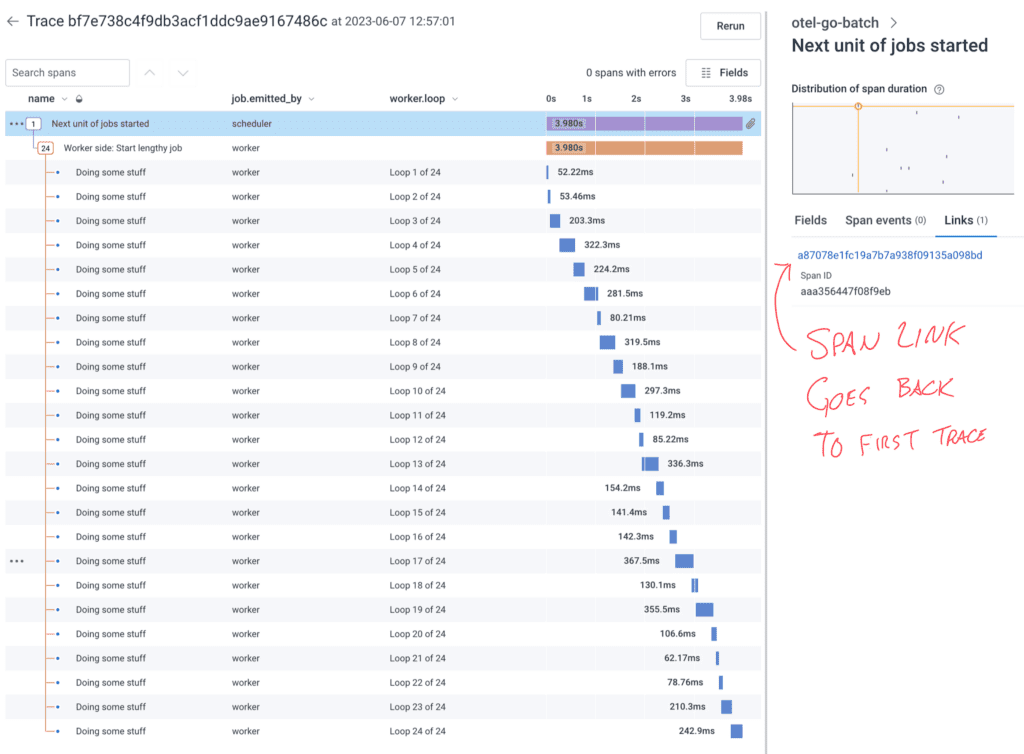
Also note the right-side panel has a Links (1) tab which can get the analyzer user back to the trace that kicked off the batch job. This will allow it to get information about how the job started.
To do this, I have a startupTraceSpanLink created near the beginning of the scheduler and that link is used to instantiate the root span of each periodical trace.
    startupTraceSpanLink := trace.Link{
        SpanContext: span.SpanContext(),
        Attributes: []attribute.KeyValue{
            attribute.String("name", "Link to job start"),
            attribute.String("job.run", jobIdentifier),
        },
    }
You can probably imagine a situation where 90% of jobs have one or two spans, but occasionally, something will pass the trace context to an application that does a lot of work. This one may create a few thousand spans on its own. The scheduler will still be counting off jobs and won’t be aware of the spans added to each job or downstream activities.
Starting a new trace for each job
To address this, since Honeycomb only charges by events (spans) and doesn’t care how many trace identifiers there are, it’s perfectly reasonable to create a new trace per job.
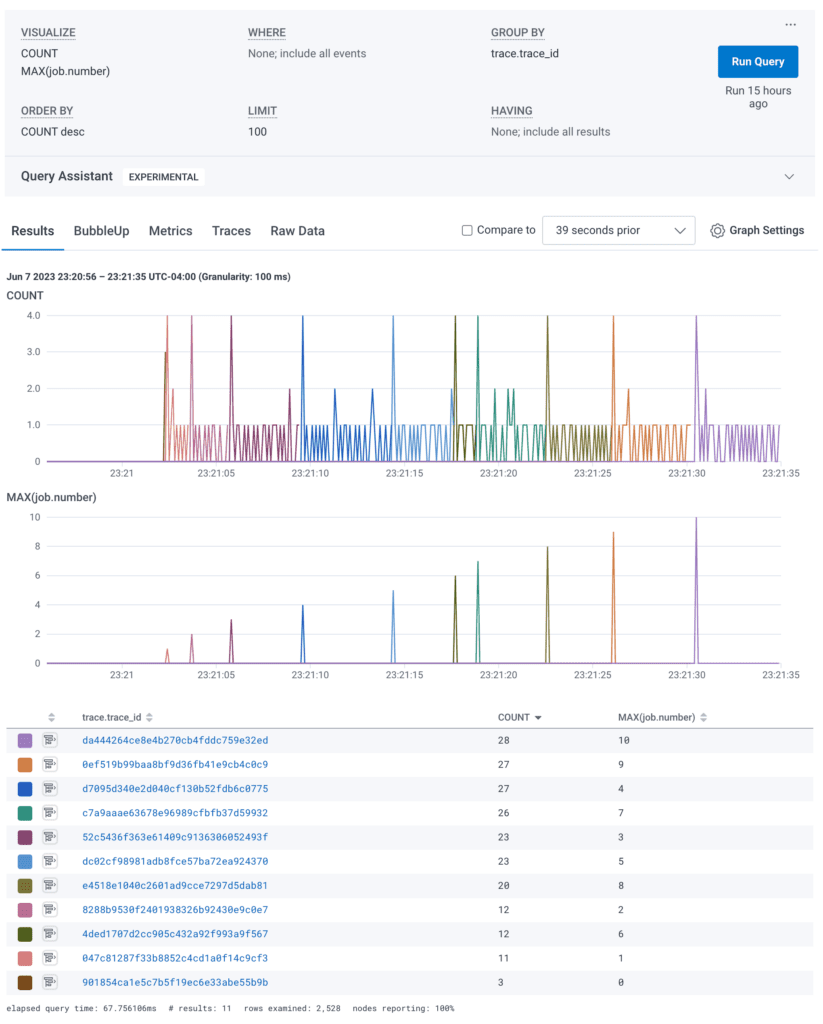
In this example, each job does a bit more work. We went down from 100 jobs to 10 just for timeline sake. The jobs run sequentially, which is required for certain workloads where an output from one becomes an input to the next. This approach solves some problems, such as the unknowable length to a fanout job, and keeps the planning trace separate from the execution.
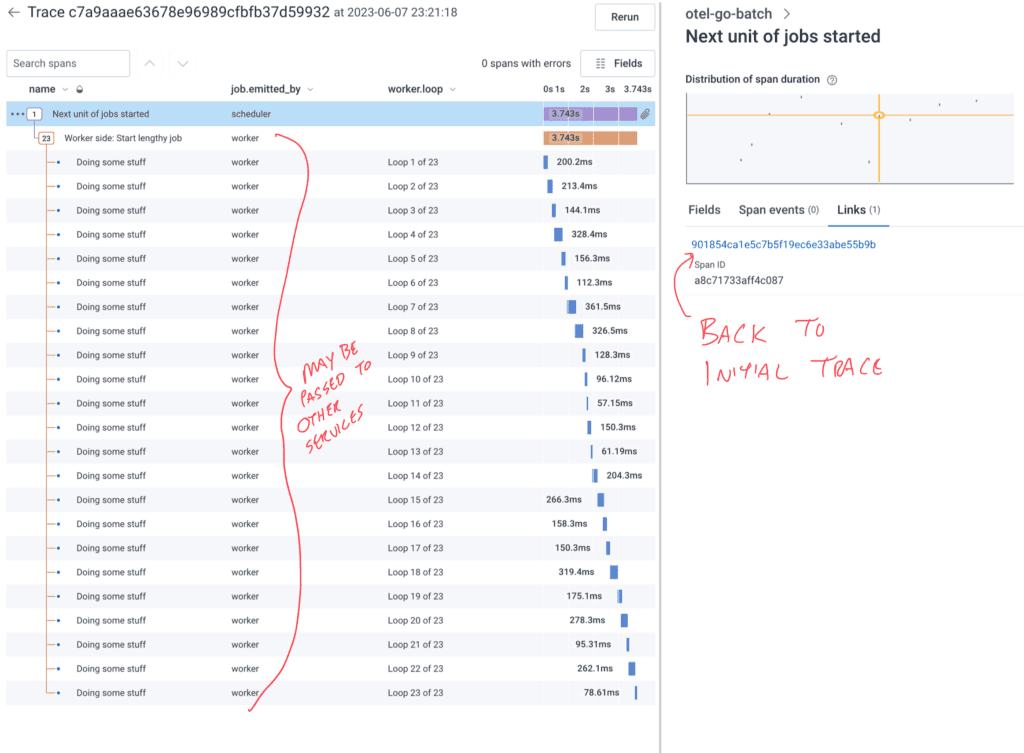
In this waterfall view, the job.emitted_by stands in for service.name, since my example system doesn’t span services. You could imagine the scheduler causes the worker to call other internal and external systems to complete its tasks.
Again, in this example, the right pane is populated with the link to be able to get back to the scheduler trace in order to make investigations easier.
The loop is simper because we always start a new span and then pass the context into our doSomeLengthyJobWork function. Less to keep track of. No impact on Honeycomb cost.
    for ; i <= 10; i++ {
        fmt.Printf("new trace at jobnumber %d and time %s", i, lastNewTrace.String())
        ctxWorker, spanWorker = tpWorker.Tracer("example/otel-go-batch").Start(context.Background(), "Next unit of jobs started", trace.WithLinks(startupTraceSpanLink))

        spanWorker.SetAttributes(attribute.Int("job.number", i))
        spanWorker.SetAttributes(attribute.String("job.emitted_by", "scheduler"))
        err := doSomeLengthyJobWork(ctxWorker, int64(i))
        if err != nil {
            spanWorker.SetStatus(codes.Error, fmt.Sprintf("An error during lengthy job %v", i))
        }
        spanWorker.End()
    }
Of note: The first span is from the scheduler before it hands off the trace to the worker. When implementing tracing that spans systems, being able to track delays and failures in the borders is incredibly important. If a worker starts a trace, there may be delays or failures between the scheduler intending to start the job and the job actually starting.
Sampling decisions can be made about these smaller traces based on duration and errors. The biggest problem for Refinery with the sequential nature of the jobs is that it will only see a few during any given window. Refinery won’t typically drop the only trace it sees, so if the jobs take 20-30 seconds, your sample rate may be stuck at one or two. If you have more than a few dozen jobs per second, Refinery will have a much better time making good sampling decisions.
Improve sampling with async jobs
The fact that my test harness for this uses sleep means it can do all the sleeping at the same time. This is similar to a fanout where the scheduler starts 200 Lambdas and then each one does its thing.
Our async scheduler code looks like this:
    var wg = &sync.WaitGroup{}
    // This for loop is our fake job queue.
    var i = 1
    for ; i <= 10; i++ {
        wg.Add(1)
        // the following block runs in parallel
        go func(i int) {
            ctxWorker, spanWorker = tpWorker.Tracer("example/otel-go-batch").Start(context.Background(), "Next unit of jobs started", trace.WithLinks(startupTraceSpanLink))
            defer spanWorker.End()
            spanWorker.SetAttributes(attribute.Int("job.number", i))
            spanWorker.SetAttributes(attribute.String("job.emitted_by", "scheduler"))
            err := doSomeLengthyJobWork(ctxWorker, int64(i))
            if err != nil {
                spanWorker.SetStatus(codes.Error, fmt.Sprintf("An error during lengthy job %v", i))
            }
            spanWorker.End()
            // adding a big delay here to let the span get sent before ripping everything down
            // time.Sleep(2 * time.Second)
            wg.Done()
        }(i)
    }
    wg.Wait()
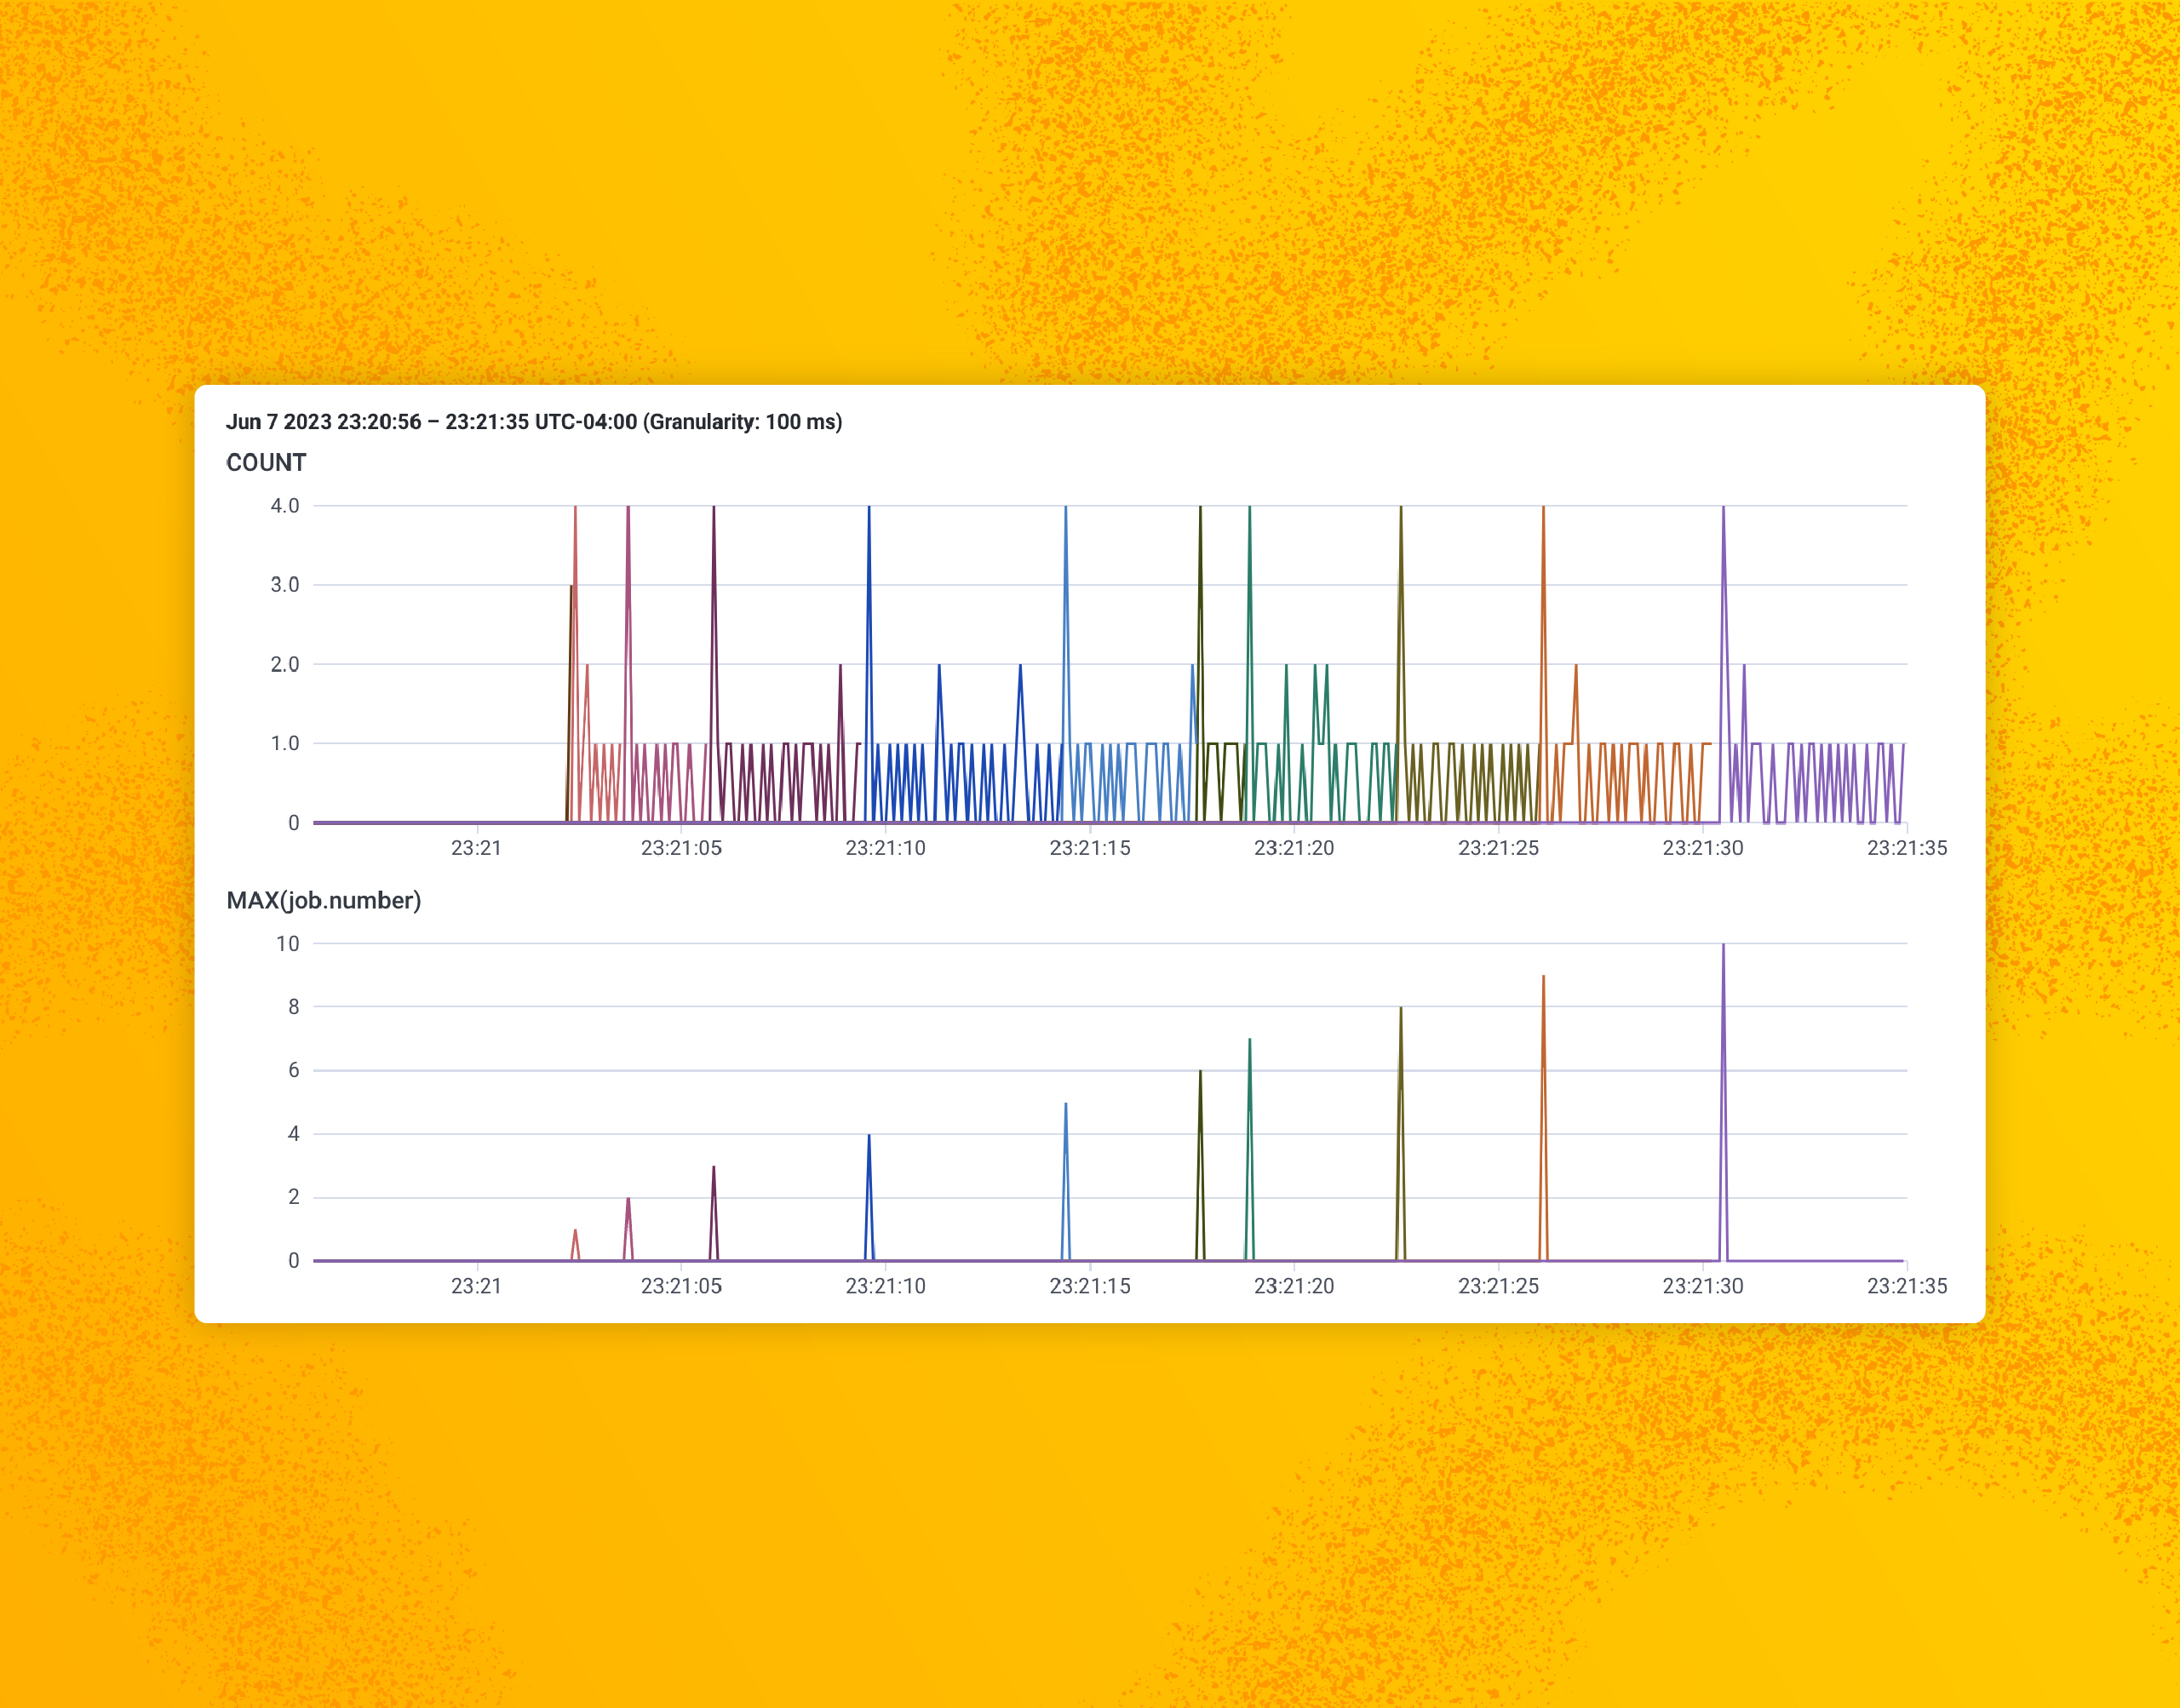
When running multiple jobs at once, it sends all the scheduler spans right away. Then, the worker spans come in gradually as the jobs execute and finish. You can see it nicely in this CONCURRENCY visualization chart.
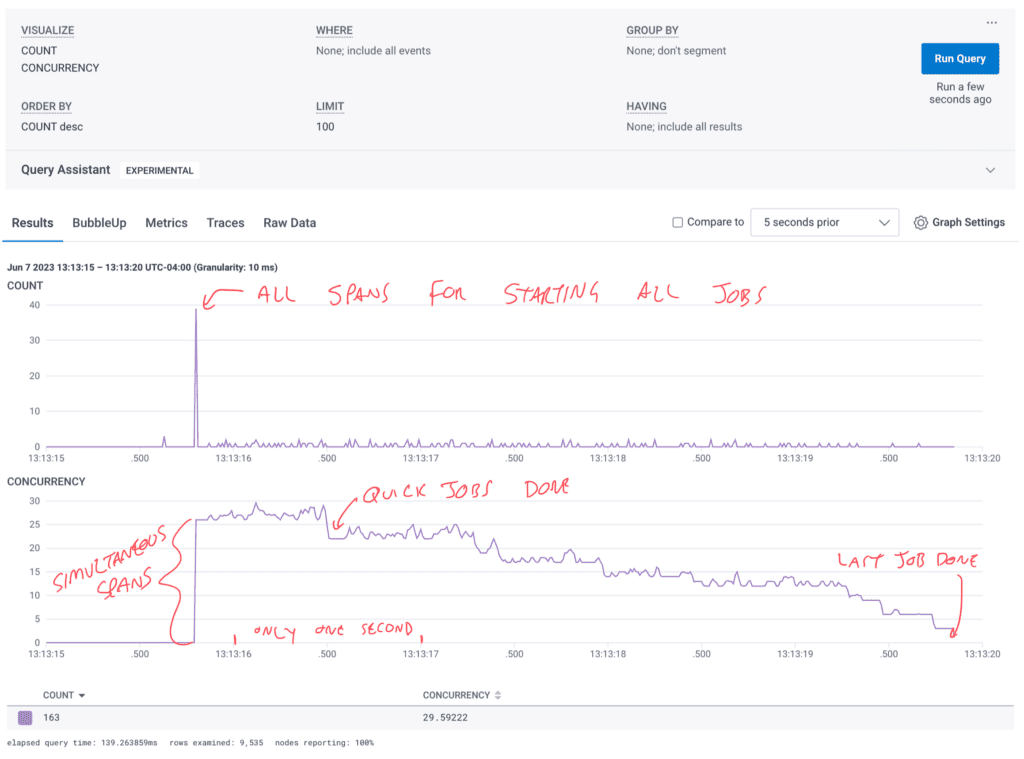
If your batch system has 10,000 jobs and 1,000 hosts, the parallel nature of the work getting done will help the sampler, even if each of the hosts does its portion of the jobs sequentially.
If it’s a stream processing system and there are multiple hosts pulling events off the queue to process them, this will also create enough parallel activity to improve sampling.
So what does that look like in trace waterfall view? It’s about the same as the per-job traces that run sequentially.
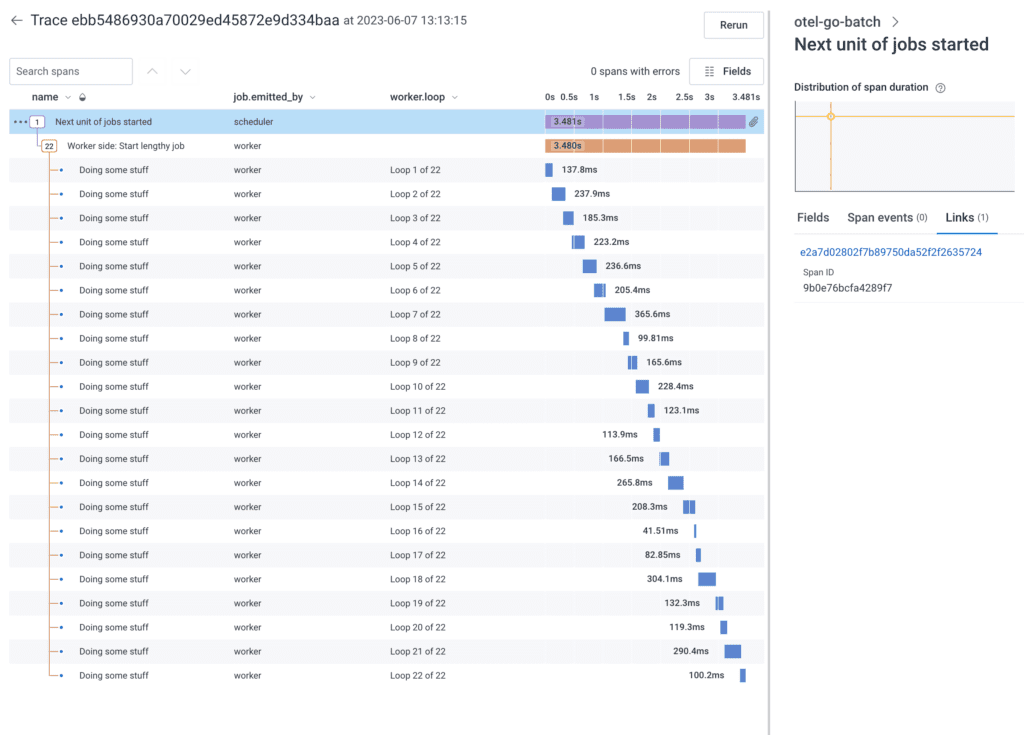
It’s internally consistent and has the link back to the instantiation trace.
The major benefit is that Refinery sees the surge of quick jobs at the beginning, creates its dynamic sampler keys, and starts the timeout there. This means by the time the quick jobs complete and Refinery makes its decisions, many of them will be similar enough that Refinery can safely drop them and account for them by increasing the sample rate on a similar trace.
We hope that by managing trace identifiers strategically, your organization can apply sampling approaches to effectively manage the volume of events sent to Honeycomb.
What if each job still creates too many spans to be valuable? Maybe summary spans can help!
Excessively detailed traces
In certain situations, a set of spans may not be the best, clearest, most economical way to track ongoing work. For these scenarios, there are a few methods to help.
Disable auto-instrumentation
If you find that traces are too voluminous and have too much noise relative to their value, an easy option is to disable auto-instrumentation. The OpenTelemetry SDK allows enabling and disabling auto-instrumentation per library, so you can keep HTTP but drop database spans.
The best part of this approach is that it costs nothing and you still get a full picture of the activities, just not the depth.
Optional error spans with summary attributes
We talked about changing the trace context to a new one at various times. In a similar vein, we could trace only when something interesting happens.
The first example runs a non-instrumented function called doSomeDetailedJobWork which returns an array of strings that are all errors. If your system already has finely-tuned internal error collecting, this may be something to tie into.
   for i := range jobs {
        // save the timestamp of starting the job just in case we need it
        startTime := time.Now()
        errStrings := doSomeDetailedJobWork(int64(i))
        if errStrings != nil {
            // if there are errors, let's do something about it
            failures += 1
            _, spanWorker := tracer.Start(ctx, "Something went wrong", trace.WithTimestamp(startTime))
            spanWorker.SetAttributes(attribute.String("job.emitted_by", "scheduler"))
            spanWorker.SetAttributes(attribute.Int64("job.number", int64(i)))
            spanWorker.SetAttributes(attribute.Int64("errors.count", int64(len(errStrings))))
            // for _, errStr := range errStrings {
            // Could perform more analysis on the strings if something can be summarized.
            // }
            spanWorker.SetStatus(codes.Error, "Error Summary")
            spanWorker.End(trace.WithTimestamp(time.Now()))
            time.Sleep(50 * time.Millisecond)
        } else {
            successes += 1
            success_duration += int(time.Since(startTime).Milliseconds())
        }
    }
This generates a series of spans, one for each errored job. Any jobs that complete on time without errors are not sent at all, which reduces volume. For example, this run includes 1000 jobs but only 106 spans.
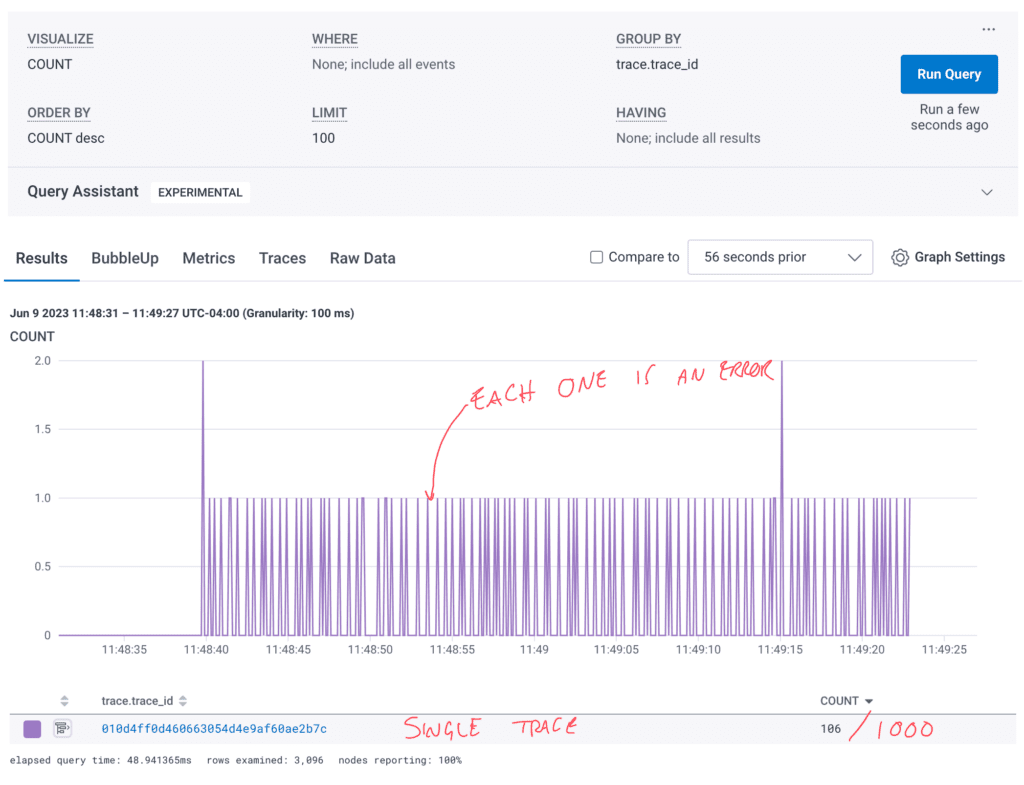
The example code uses a deterministic method for generating errors so they’re evenly distributed throughout the trace. In a real world scenario, you’re likely to see bigger gaps and bigger clumps where things are smooth vs. cascading failures.
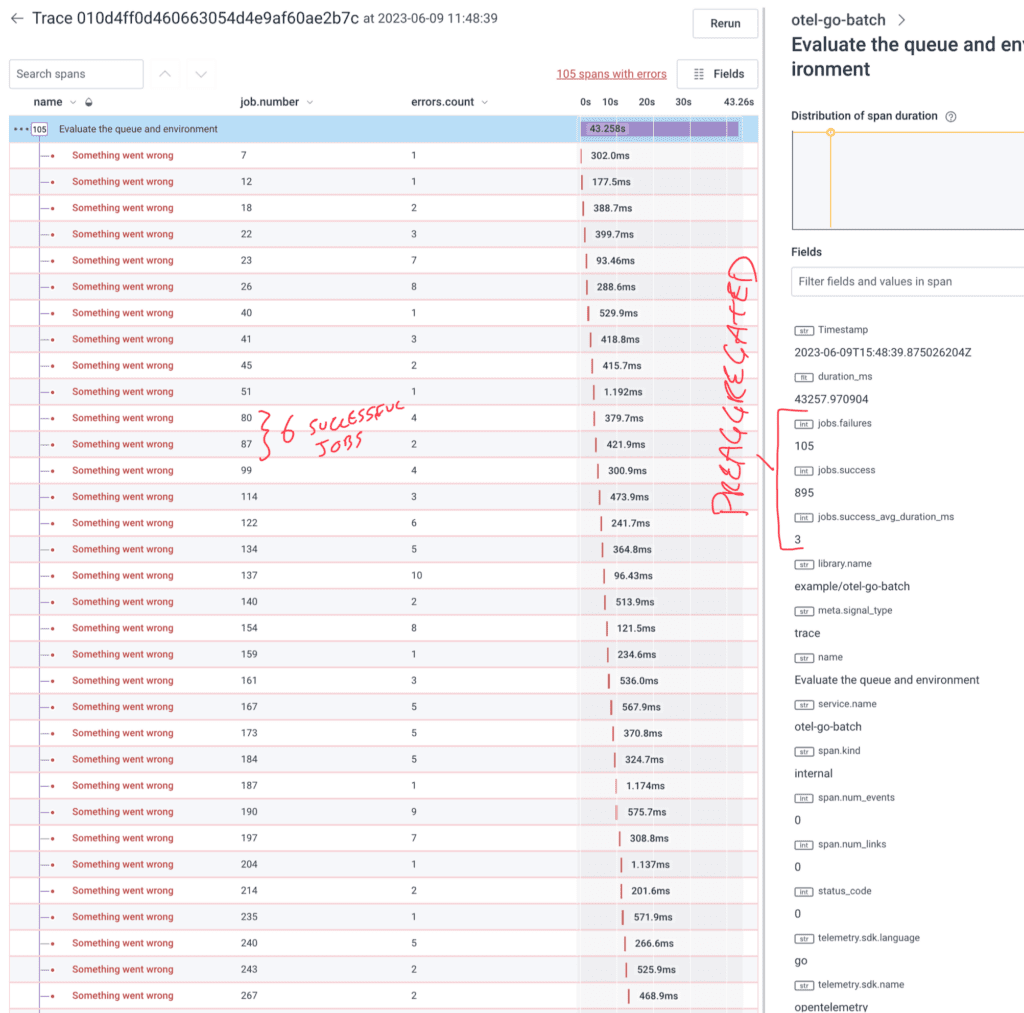
One consequence of starting and ending the span during the error-catching conditional is that the span’s starting timestamp is not set until after the job returns the error. To fix this, the code above gets the timestamp just before starting the span and then adds the span option trace.WithTimestamp(startTime). Now, our errors have a timeframe associated with them that matches the actual job.
The other thing that’s entirely lost is successful jobs. We have no idea how long a job that doesn’t return a failure took since it exists between these failed jobs. In the case where there are multiple machines working on these jobs, the parallel nature means it could be impossible to know if non-error jobs even completed. The simple step I took in this version was to add up the amount of time each successful job took and add it, in milliseconds, to the success_duration variable. At the end, it adds the successes, failures, and the average duration (simple mean) to the root span.
span.SetAttributes(attribute.Int64("jobs.success", int64(successes)))
span.SetAttributes(attribute.Float64("jobs.success_avg_duration_ms", float64(success_duration/successes)))
span.SetAttributes(attribute.Int64("jobs.failures", int64(failures)))
span.End()
By using the context.Background() approach to initializing the spans there, we could have made them each their own trace. Since we aren’t getting close to 10,000 errors per trace, we don’t need to separate the traces out. For your use case, it may be preferable to do that.
Single summary span
In other cases, maybe you want to generate one span full of attributes to explain an entire job run. This has the largest reduction factor, but also loses the most context.
In our code, we have three parts. First, where we run the jobs and collect the errors:
    errorsPile := make(map[int]customErrorClump)
    var successes int64
    for i := range jobs {
        // do the jobs and collect up the errors
        errIntArray := doSomeDetailedJobWork2(int64(i))
        if errIntArray != nil {
            // store the errors in the pile for later summarization
            errorsPile[i] = customErrorClump{
                SchedulingFailures:        errIntArray[0],
                RecoverableStartupFailure: errIntArray[1],
                ConnectionFailure:         errIntArray[2],
                TooManyPuppies:            errIntArray[3],
            }
        } else {
            successes += 1
        }
    }
In my example, I made a custom type with known errors that I want to capture. The errorsPile is where the execution loop stores any errors that are returned from the doSomeDetailedJobWork2 function.
Then we process the errors, summarize them however makes sense, and record the findings:
    summaryErrorClump := customErrorClump{}
    var failedJobsIds []string
    // analyze the errors
    for i, cec := range errorsPile {
        summaryErrorClump.SchedulingFailures += cec.SchedulingFailures
        summaryErrorClump.RecoverableStartupFailure += cec.RecoverableStartupFailure
        summaryErrorClump.ConnectionFailure += cec.ConnectionFailure
        summaryErrorClump.TooManyPuppies += cec.TooManyPuppies

        failedJobsIds = append(failedJobsIds, fmt.Sprintf("%v", i))
    }
The summary clump stores the totals for each error type. Then, we make a big string array full of failed job identifiers.
Finally, we create the meaty span full of findings:
// create the summary trace (single span)
    var spanSummary trace.Span
    ctx, spanSummary = tracer.Start(context.Background(), "End of batch run summary", trace.WithLinks(startupTraceSpanLink))
    spanSummary.SetAttributes(attribute.String("job.emitted_by", "scheduler"))
    spanSummary.SetAttributes(attribute.String("summary.failed_job.ids", strings.Join(failedJobsIds, ", ")))
    spanSummary.SetAttributes(attribute.Int64("summary.failed.count", int64(len(errorsPile))))
    spanSummary.SetAttributes(attribute.Int64("Summary.success.count", successes))

    spanSummary.SetAttributes(attribute.Int64("summary.error.SchedulingFailures.count", int64(summaryErrorClump.SchedulingFailures)))
    spanSummary.SetAttributes(attribute.Int64("summary.error.RecoverableStartupFailure.count", int64(summaryErrorClump.RecoverableStartupFailure)))
    spanSummary.SetAttributes(attribute.Int64("summary.error.ConnectionFailure.count", int64(summaryErrorClump.ConnectionFailure)))
    spanSummary.SetAttributes(attribute.Int64("summary.error.TooManyPuppies.count", int64(summaryErrorClump.TooManyPuppies)))

    spanSummary.End()
Once this span is sent to Honeycomb, we can use either the aggregate view, raw data view, or trace waterfall span details to get the summarized information.
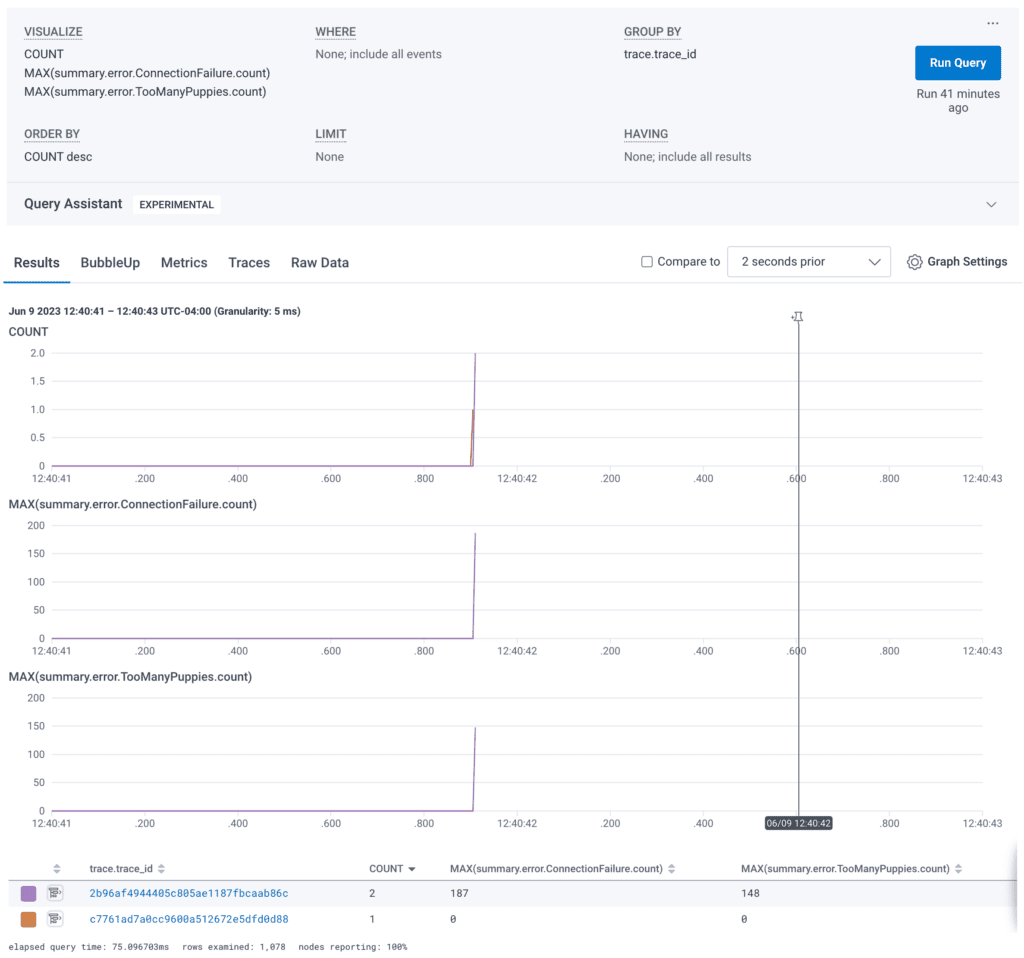
You can take MAX, AVG, and SUM aggregations of these counted error types to see trends over time. These trends are at the “job run” level rather than the “job” level. Any determinations about performance or behavior of the jobs themselves will have to come from a pre-aggregated value or a separate log.
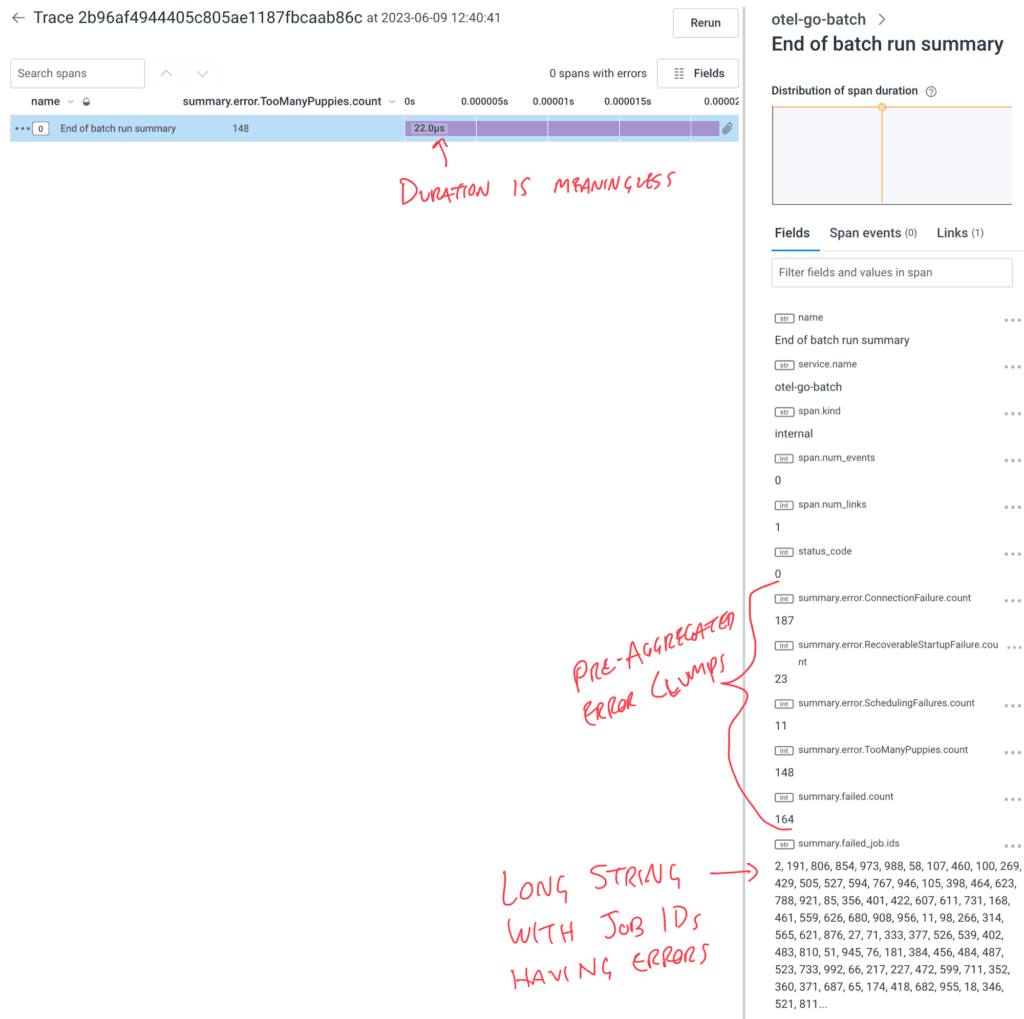
In the trace waterfall view, the span fields list includes all the summaries and the job identifier list.
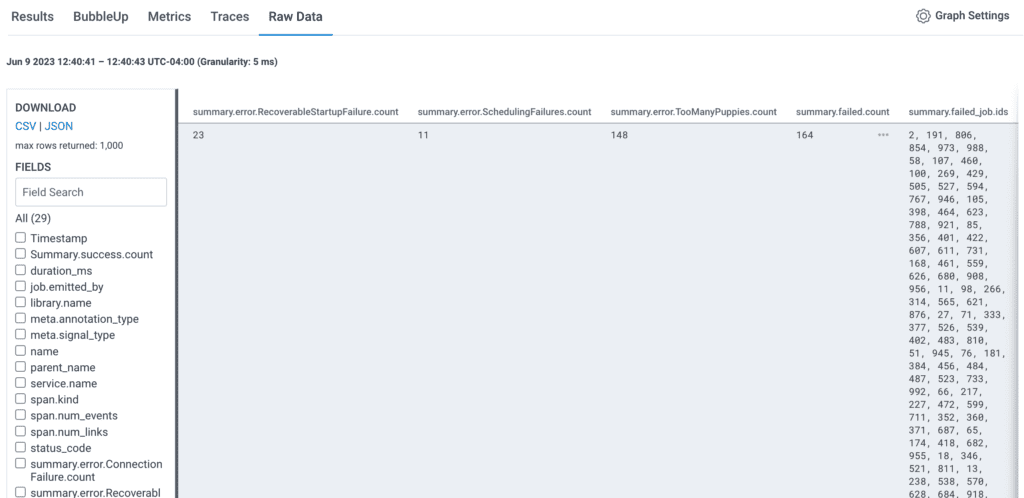
And in raw data, these fields can be exported as a CSV for spreadsheet analysis.
Pre-aggregating data
One drawback with the total, success, and failed counts is that you lose a lot of context for each. If you create a summary clump of information pulled out from each set of jobs (like you have to run the same tasks for 20 customers), you would have to make 20 spans per run. Otherwise, your summary.error.{facet} would clobber the prior one. Since Honeycomb supports having many attributes, if you have a small number of job sets, you can add them all to the summary span.
It might look like this, where each set gets its own customer_id and then loops through that set of jobs:
spanSummary.SetAttributes(attribute.Int64(  fmt.Sprintf"summary.error.%s.count", customer_id),           int64(summaryClump.count)))
spanSummary.SetAttributes(attribute.Int64(  fmt.Sprintf"summary.error.%s.error", customer_id),           int64(summaryClump.error)))
spanSummary.SetAttributes(attribute.Float64(fmt.Sprintf"summary.error.%s.avg_duration_ms", customer_id), float64(summaryClump.total_duration/summaryClump.count)))
spanSummary.SetAttributes(attribute.String( fmt.Sprintf"summary.error.%s.category", customer_id),        summaryClump.category))
spanSummary.SetAttributes(attribute.String( fmt.Sprintf"summary.error.%s.failed_job_ids", customer_id),  strings.Join(failedJobsIds, ", ")))
This will work up to a point. However, any time there’s a dynamic string in the key, there’s a risk it will blow up your column limit and put a dataset into read-only until the columns are cleaned up.
Another complication from this approach is that there isn’t currently a way to make a COALESCE derived column with a dynamic name. To make a summary.error.total.count attribute, you need a separate summary clump that collects the total across the whole run. It’s all the same logic that you’re already doing, but does have to be manually computed and added.
Conclusion
We hope you found some useful methods to handle situations where trace shapes end up less useful. Keep in mind that auto-instrumentation is optional, trace start and end can be moved around, and context can be passed as a parent or as a link. With those three modifications to the standard approach, you should be closer to optimal observability.
As with anything, there will be times when this is more applicable than others. The specific examples in this blog post are illustrative but don’t represent an exhaustive exploration of options.
Check out the repo
The OpenTelemetry Go Batch repo that generated all the traces in these examples is open source.
The branches each contain a different example above:
- main → periodically replacing the trace id
- single-trace → the default where propagation leads to a single, huge trace with all the jobs
- new-trace-per-job → preventing trace propagation with a SpanLink, still starts job traces in scheduler
- per-job-async → same as new-trace-per-job, but wraps the jobs in parallel goroutines
- optional-trace → each job gets a span only if there’s a reason to create a span
- summary-span → each job run (all jobs) get one span that summarizes the activities for all jobs
If you run into another flow that is still incomprehensible after applying these methods, please join us in our Pollinators Slack. We’re happy to help!


