Tracing the Line: Understanding Logs vs. Traces
In the software space, we spend a lot of time defining the terminology that describes our roles, implementations, and ways of working. These terms help us share fundamental concepts that improve our software and let us better manage our software solutions. To optimize your software solutions and help you implement system observability, this blog post will share the key differences between two important terms: traces and logs.

By: Rox Williams

Rocking the Logs: Fender’s Journey to Modern Observability
Learn MoreIn the software space, we spend a lot of time defining the terminology that describes our roles, implementations, and ways of working. These terms help us share fundamental concepts that improve our software and let us better manage our software solutions. To optimize your software solutions and help you implement system observability, this blog post will share the key differences between logs vs traces.
What are logs?
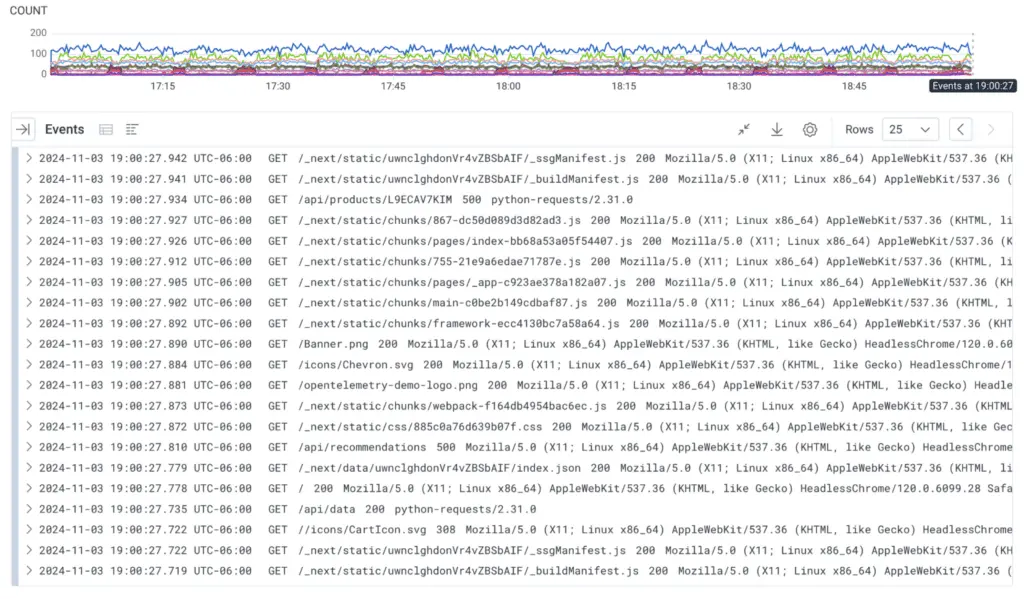
Logs are time-stamped records generated by software applications, services, or network devices. They provide a sequential account of events that occurred within a system, including details of what happened, when it happened, and the state of the application during the event.
Types of logs
Different types of logs come from different parts of the software and serve different audiences.
- Application logs: Capture events related to application behavior, errors, and transactions.
- System logs: Provide information about the operating system, such as boot processes and system errors.
- Security logs: Track access and authentication events, helping identify potential security threats.
- Audit logs: Record changes and actions taken within an application for compliance and security purposes.
Use cases for logs
Implement logs to capture changes, actions, and errors. In summary, logs are used for:
- Debugging: identifying issues in system performance or functionality.
- Compliance: ensuring systems meet regulatory requirements through detailed logging.
- Monitoring: observing and alerting for specified system behaviors or errors.
Application logs can be used for debugging, giving developers and SREs some clues about how requests are served by the software. Each log is independent and describes an action or error in one software component.
What are traces?
Traces are records that follow the path of a request as it traverses through various components of a distributed system. Distributed tracing provides a high-level overview of how different services interact, helping teams understand the flow and performance of requests across microservices.
Traces can hold all the information found in application logs, with additional data about how all the pieces fit together.
What are traces composed of?
A trace is made up of spans grouped by a trace ID. A span represents a unit of work, some operation performed by a service. Each trace has one root span, which has the total latency of a request. That parent span can contain nested spans to represent sub-operations within a request. These nested spans are known as child spans.
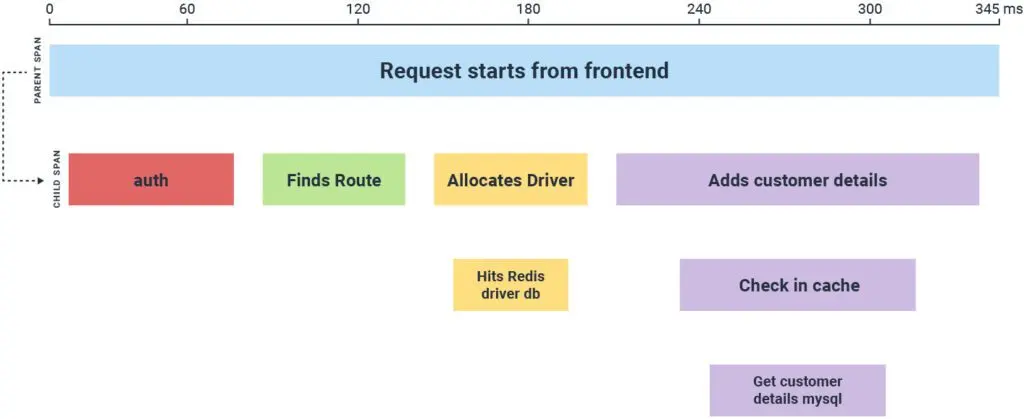
In OpenTelemetry, spans include attributes of the following information:
- Operation Name: a descriptive name for the span
- Trace ID: a generated identifier, one per incoming request, shared by all spans describing the processing of that request
- Span ID: another generated identifier, unique for every span
- Parent Span ID: references the Span ID of the activity that triggered this one; this is empty for root spans
- Timestamp: when this activity started
- Duration: how long this activity took
- Attributes (optional): Key-value pairs that describe everything else about this activity. Common attributes include URL, route, user ID, IP address, and much more
- Span Events (optional): to annotate a particular point in a span’s duration, such as a thrown exception
- Span Links (optional): to establish a relationship between spans
- Span Status: one of three values: unset, error, or ok
- Span Kind: one of five values: client, server, internal, producer, or consumer
The OpenTelemetry documentation has more information if you want to learn more about spans.
Use cases for traces
Implement traces to identify bottlenecks and latency issues across service calls, pinpoint failures in complex service interactions, and understand how users interact with applications. Traces can be used for:
- Performance optimization: Identifying bottlenecks and latency issues across service calls.
- Root cause analysis: Pinpointing where failures occur in complex service interactions.
- User experience monitoring: Understanding end-to-end user experiences.
Traces can replace application logs for debugging, and they can replace application metrics for monitoring.
Shameless plug: traces are now even better in Honeycomb
Over time, we’ve made updates to distributed tracing that make it easier to navigate traces and find the insights you need—quicker:
- The new trace summary highlights long-running spans and issues at a glance, so you can jump straight to problem areas with a single click—no more hunting.
- Navigation is smoother too. Now, you can open span events and links directly from the trace waterfall. Just click on an event to view its metadata or use the link icon to explore related spans, keeping everything at your fingertips.
- With trace zoom, you can focus on a subtree by expanding a span’s duration across the whole trace. Plus, you can share this zoomed-in view via permalink, making collaboration effortless.
- Lastly, span link attributes are now visible in the span details sidebar. Click on the link icon next to a span to expand its attributes.
These updates make tracing faster and more intuitive, helping you troubleshoot errors, optimize performance, and get insights without the hassle.
Generating logs and traces
Logs are implemented by single lines of code outputting text or structured data. Traces are harder to add because they are implemented from multiple lines of code. Distributed tracing also requires propagation, which comes from instrumentation libraries.
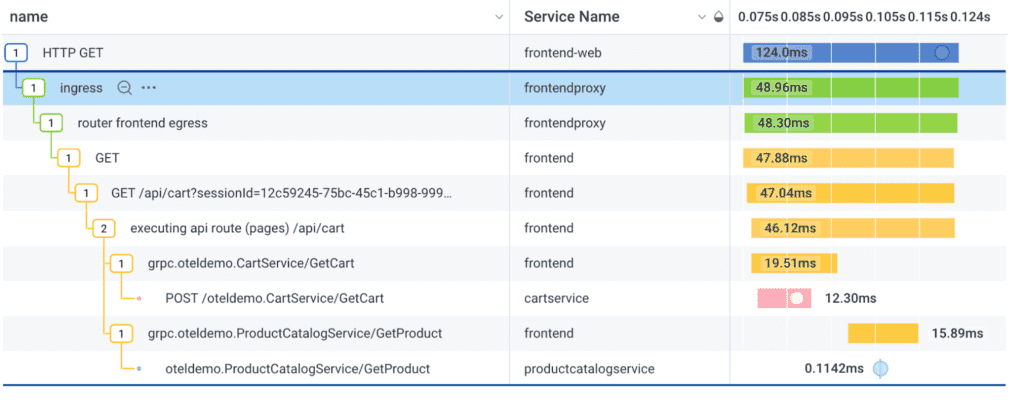
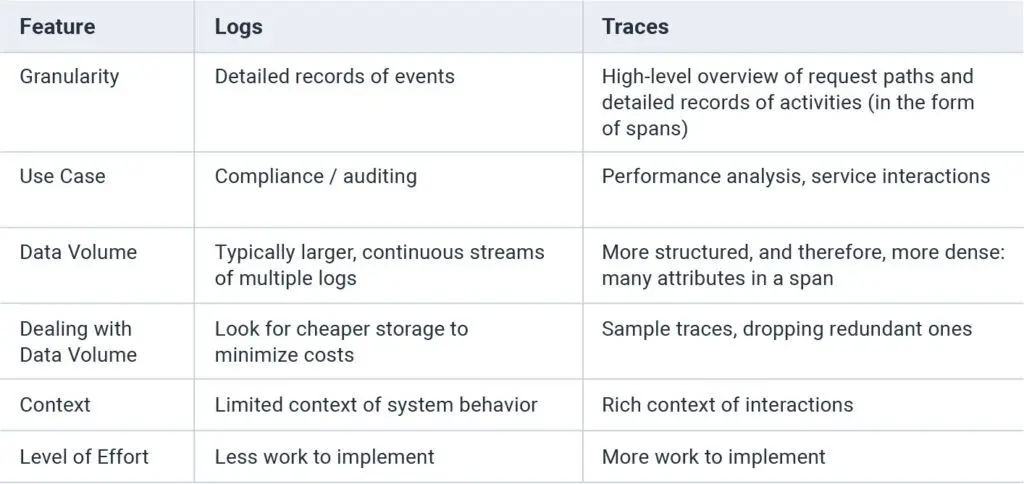
The data generated by logs and traces and the strategies for managing this data also differ. To better summarize the key differences across various categories, read on.
Logs vs traces: The main differences
This table shares the key differences between logs and traces.
How traces and logs work together
In the world of observability, logs provide valuable insights into individual events, and traces offer a holistic view of how those events interact within a system. By combining logs and traces, teams can achieve a more comprehensive understanding of system behavior and performance. For example, a log may indicate an error, and a trace can reveal where the error originated and how it propagated through the system.
Users can use information from both logs and traces to enhance observability in their software systems, allowing for quicker troubleshooting, better performance monitoring, and improved user experiences. For example, a log could be integrated into a trace. When adding OpenTelemetry instrumentation on top of your existing log libraries, the log becomes a dot on a trace span, allowing developers and engineers to view log statements inside the context of a request.
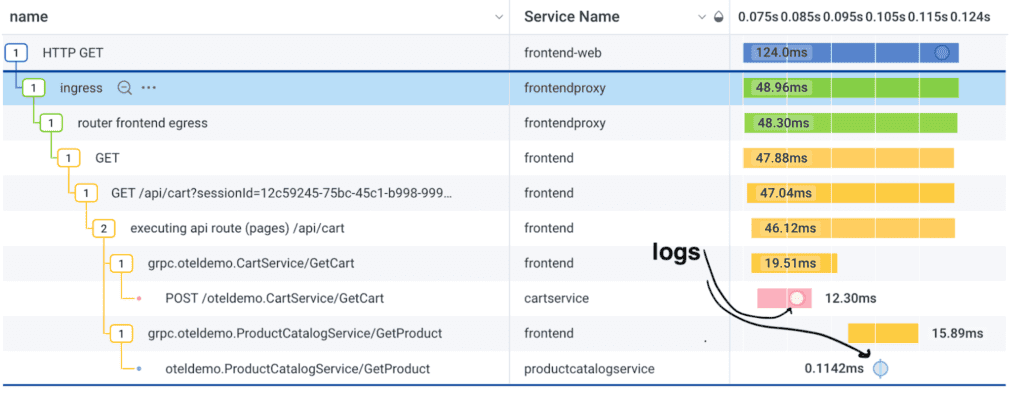
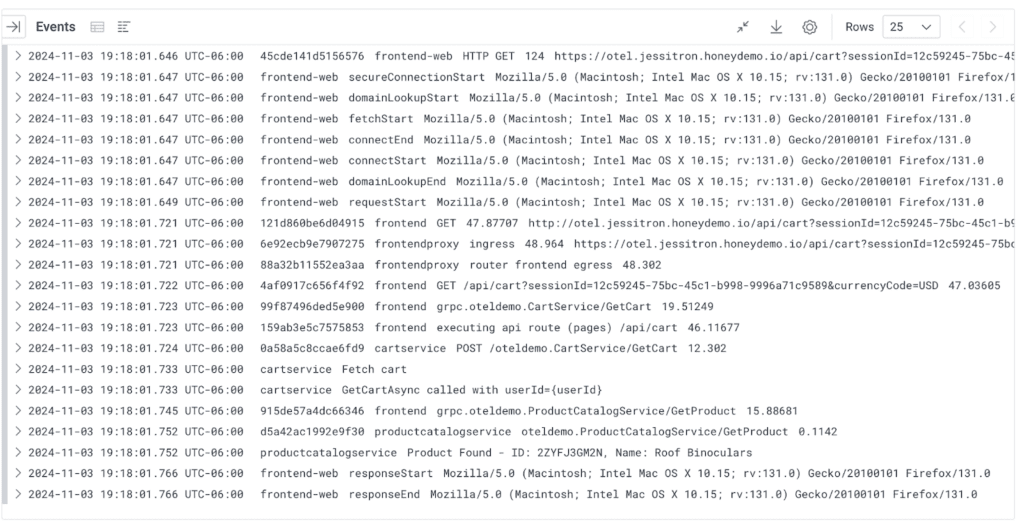
Or, trace spans can be viewed with logs, since both are made of structured data.
Lining up the points
In summary, it’s important to understand the differences between logs and traces. Each serves its unique purpose in observability, and when used together, they provide even better debugging and monitoring for complex systems. Cleverly using both traces and logs allows teams to resolve issues more efficiently and mitigate potential problems before they impact users.
If you would like to learn about more observability concepts, read our resources:
- What is Observability? Key Components and Best Practices
- Observability Maturity Model
- How Observability Differs from Traditional Monitoring
- Getting Started with Distributed Tracing
- An Engineer’s Checklist of Logging Best Practices
These observability resources will help you tackle modern software application challenges.
Get your free Honeycomb account to experience the power of logs and traces.
Want to know more?
Talk to our team to arrange a custom demo or for help finding the right plan.