What’s That Collector Doing?
The Collector is one of many tools that the OpenTelemetry project provides end users to use in their observability journey. It is a powerful mechanism that can help you collect telemetry in your infrastructure and it is a key component of a telemetry pipeline. The Collector helps you better understand what your systems are doing—but who watches the Collector?

By: Alex Boten


How OpenTelemetry and Semantic Telemetry Will Reshape Observability
Learn MoreThe Collector is one of many tools that the OpenTelemetry project provides end users to use in their observability journey. It is a powerful mechanism that can help you collect telemetry in your infrastructure and it is a key component of a telemetry pipeline. The Collector helps you better understand what your systems are doing—but who watches the Collector?
Let’s look at how we can understand the Collector by looking at all the signals it’s emitting.
Internal telemetry
The first thing to keep in mind when thinking about the Collector is that it is used to receive, process, and emit telemetry. Differentiating between the telemetry and internal telemetry can get a bit confusing. For the remainder of this article, when we say “telemetry,” we’ll be referring to the Collector’s internal telemetry.
The Collector is instrumented using the Go implementation of OpenTelemetry. This means that the APIs available to developers instrumenting Collector components adhere to the OpenTelemetry specification and the telemetry emitted should follow the project’s Semantic Conventions. The Collector is instrumented using OpenTelemetry to produce traces, metrics, logs, and can even be configured to emit continuous profiling.
Let’s look at how to configure each of these signals.
Logs
The Collector emits logs for a variety of reasons, some of the ones you may want to keep an eye on are:
- Configuration errors or environment variables missing at startup
- Deprecation warnings for components that are no longer maintained or being deprecated
- Errors receiving, processing, or exporting data
By default, logs are emitted for any message with a severity of INFO or greater, and are sent to stderr. If you already have a mechanism to scrape logs from applications running in your infrastructure, this is enough to get started. In our infrastructure, we use a few different mechanisms to collect logs from workloads in Kubernetes, including the Collector itself. The following configures the filelog receiver to scrape logs emitted by the Collector:
receivers:
  filelog:
    include:
      - /Users/alex/dev/opentelemetry-collector/bah.log
    start_at: beginning

processors:
  batch:

exporters:
  otlphttp:
    endpoint: https://api.honeycomb.io:443
    headers:
      "x-honeycomb-team": "${env:HONEYCOMB_API_KEY}"

service:
  pipelines:
    logs:
      receivers: [filelog]
      processors: [batch]
exporters: [otlphttp]It’s important to note here that a different Collector is configured to scrape the Collector’s logs. Configuring the Collector to scrape its own logs is a recipe for disaster as you could get into a situation where your Collector logs errors during the transmission of the logs, causing more logs to be transmitted, causing more errors, and finally causing rather large, unexpected bills. Oops.

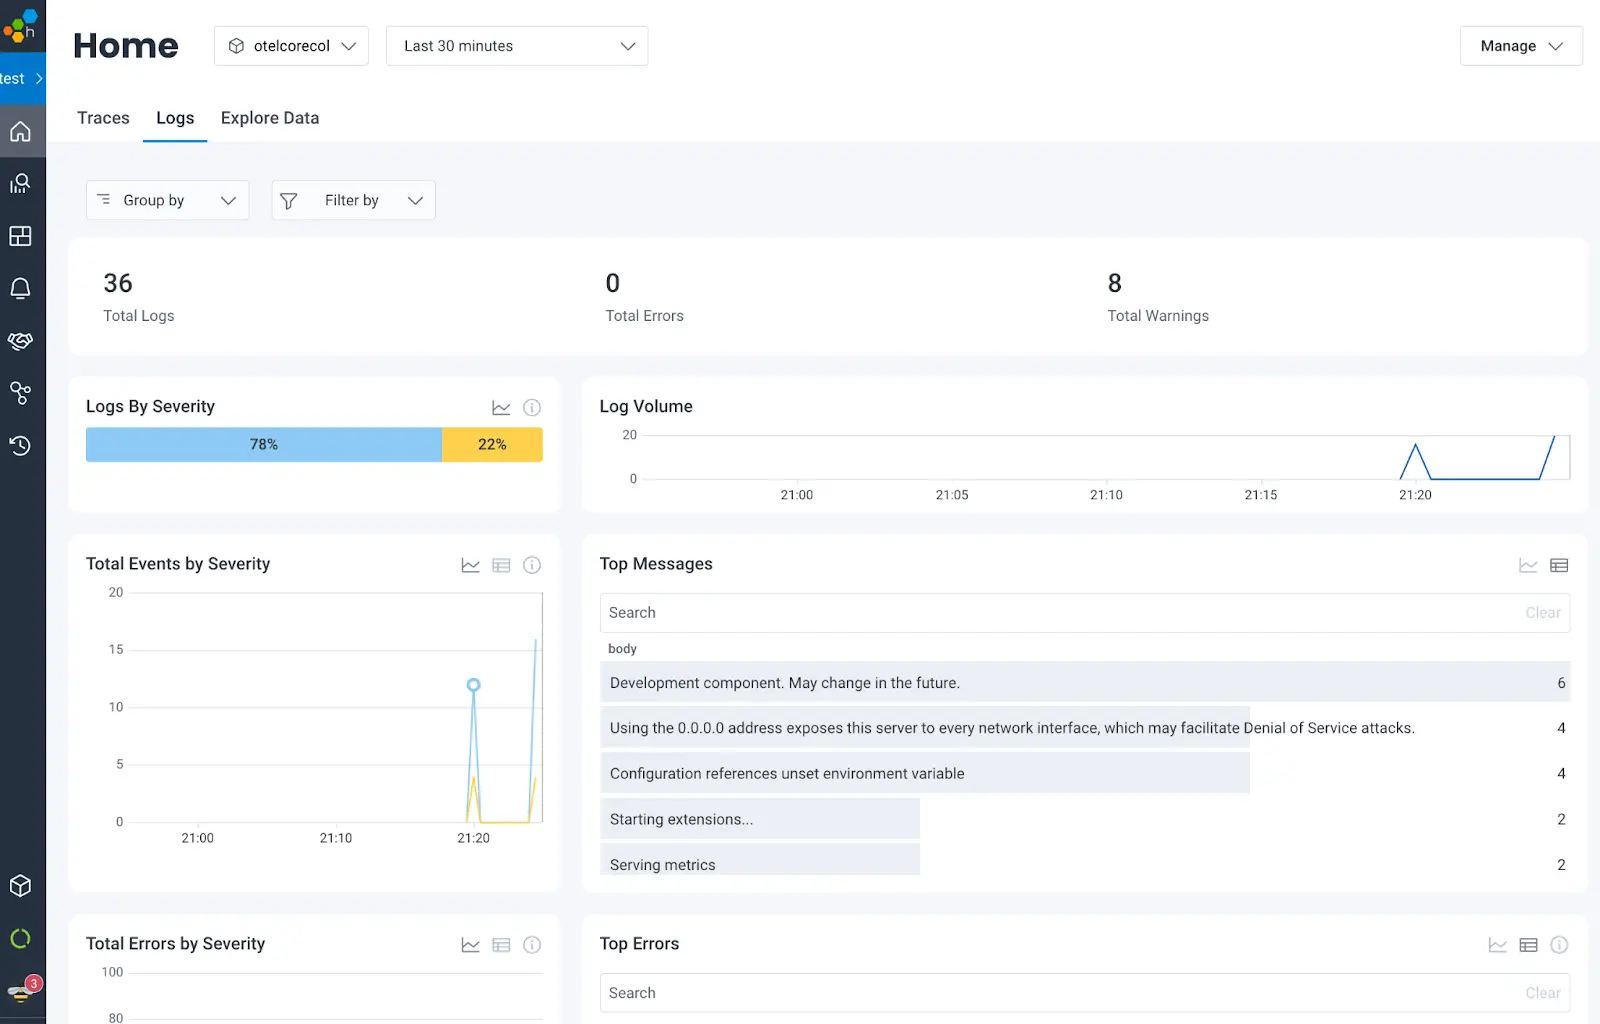
By default, logs scraped by Kubernetes logs will emit the body as a single JSON blob and that’s not great. It’s possible to configure the filelog receiver to parse the content of log messages to extract fields like timestamps, severity, and more. If you’re interested in additional details, you can see how we used this when reducing the amount of noisy logs our infrastructure produced.
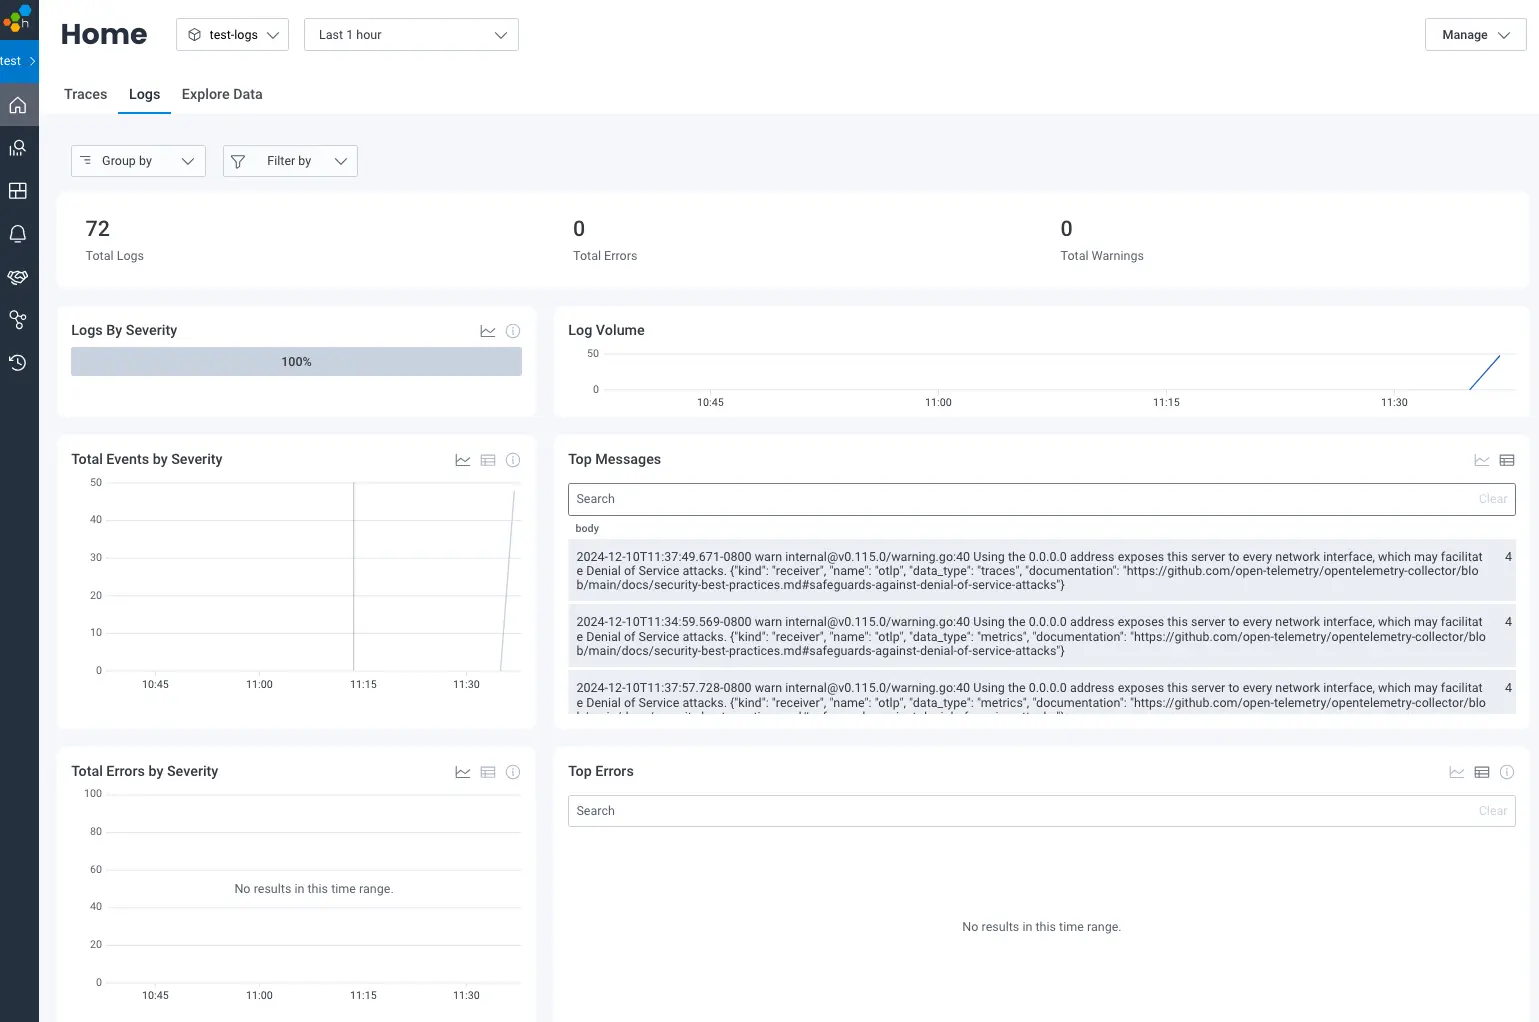
Thankfully, as of version v0.115.0, there is a better option! Remember how I mentioned that the Collector is instrumented using OpenTelemetry-Go? It is now possible to configure the Collector to emit its logs using the OpenTelemetry Protocol directly. The following example sets up an otlp exporter to emit logs to Honeycomb:
service:
  telemetry:
    logs:
      processors:
        - batch:
            exporter:
              otlp:
                protocol: http/protobuf
                endpoint: https://api.honeycomb.io
                headers:
"x-honeycomb-team": <YOUR API KEY HERE>This saves you the additional effort of setting up a log scraping mechanism and log parsing. The results are also much better as the logs emitted are structured following the OpenTelemetry Protocol definition and can be rendered with all the details in the right places. This works really well because the many attributes are separated into the correct fields at their source, rather than being concatenated into the body of the log.

There are other options available for configuring the verbosity of logs, as well as configuring a sampler for logs. Details for these options (and more!) are available in the Collector’s official documentation.
Metrics
There are many metrics emitted by the Collector today. The project’s documentation lists many of the metrics emitted by the core Collector. These metrics provide us a way to monitor the Collector via:
- The number of data points received, processed, and exported
- Resources consumed by the Collector process
- Errors transmitting data from the Collector
There are additional metrics emitted by individual components, listed in a markdown file named documentation.md that can be found in the opentelemetry-collector and opentelemetry-collector-contrib repositories. For example, all the metrics produced by the batch processor can be found under processor/batchprocessor/documentation.md. In the future, these metrics are likely to make their way onto the project’s official documentation page.
The default for the Collector is to expose a Prometheus endpoint on port 8888 for a Prometheus scraper to scrape. Until recently, the recommended way to export metrics if you don’t have the Prometheus infrastructure to scrape metrics was to configure a Prometheus receiver to scrape the Collector’s metrics as per the following:
receivers:
 prometheus:
   config:
     scrape_configs:
     - job_name: opentelemetry-collector
       scrape_interval: 10s
       static_configs:
       - targets:
         - 127.0.0.1:8888


processors:
 batch:


exporters:
 otlphttp:
   endpoint: https://api.honeycomb.io:443
   headers:
     "x-honeycomb-team": "${env:HONEYCOMB_API_KEY}"
     "x-honeycomb-dataset": test-metrics


service:
 telemetry:
 pipelines:
   metrics:
     receivers: [prometheus]
     processors: [batch]
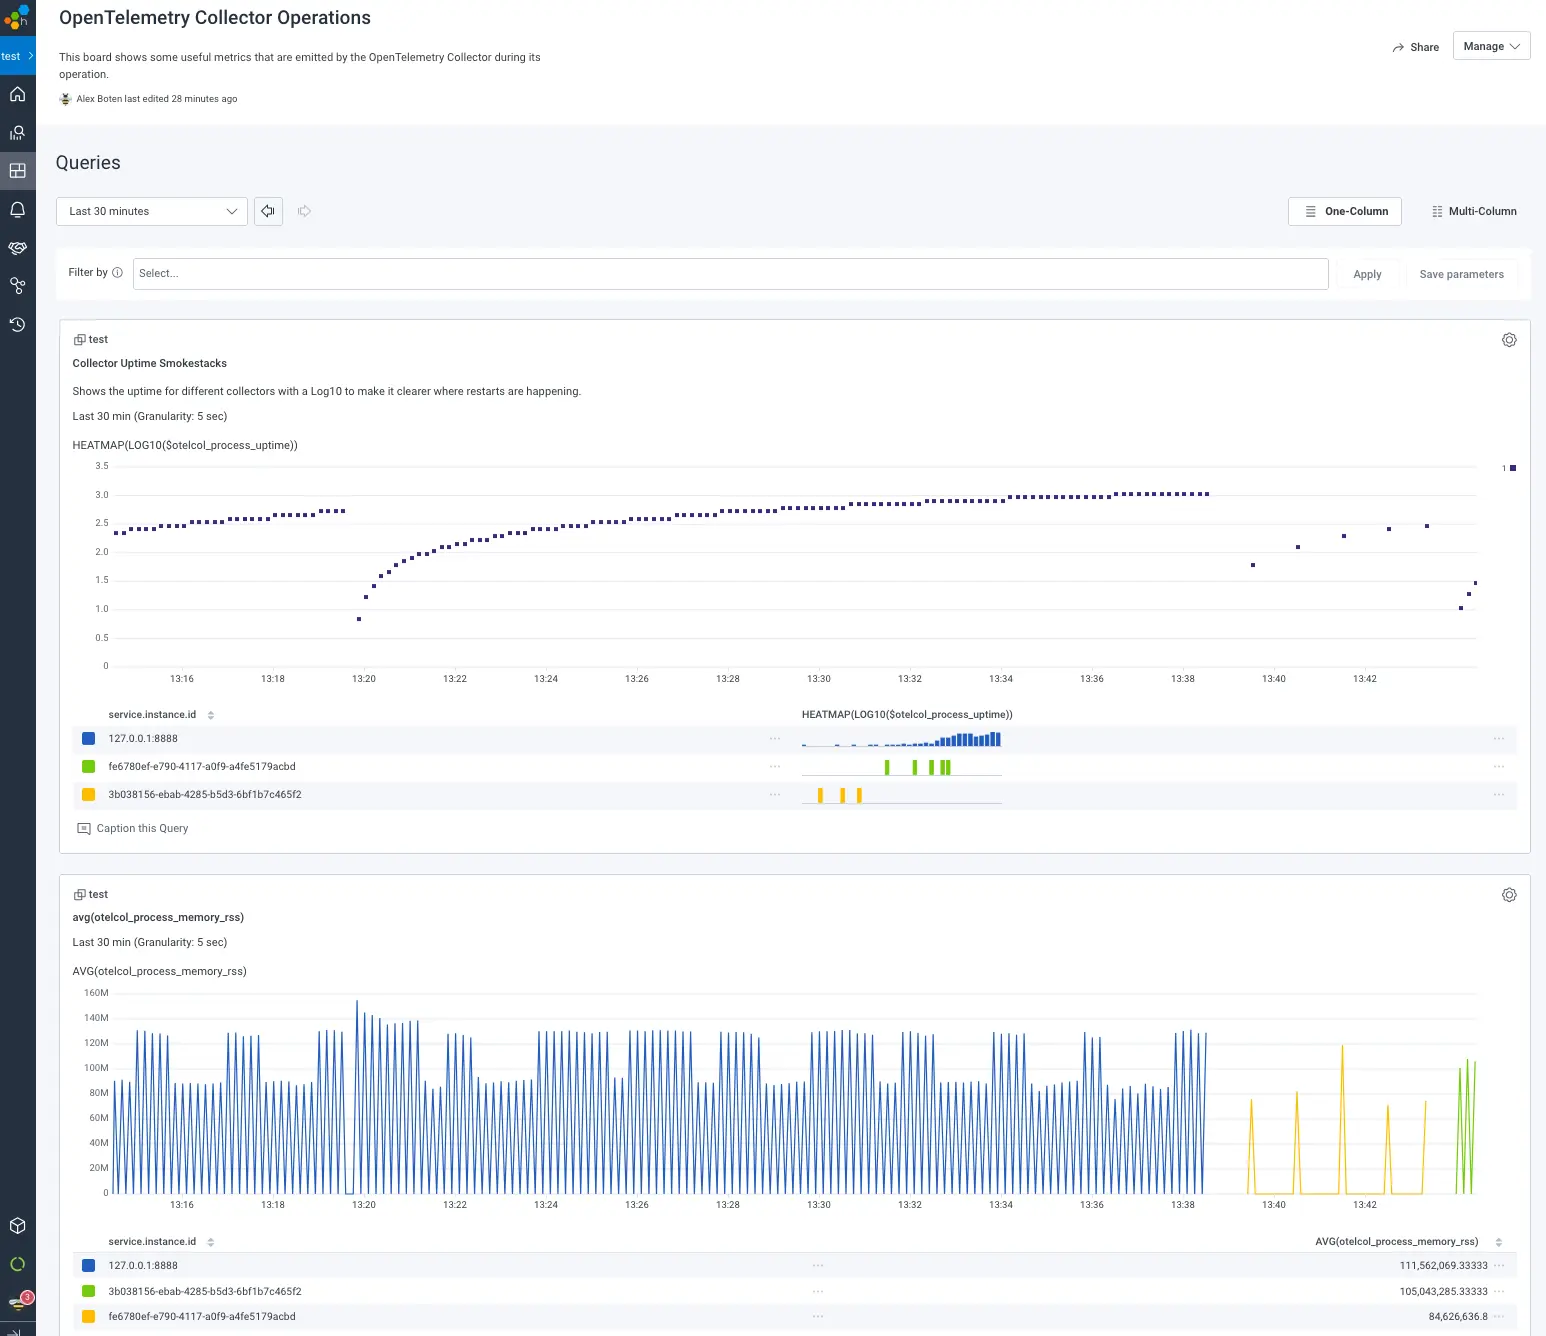
exporters: [otlphttp]That’s a lot of configuration just to get metrics out of a Collector! As with logs, there is now a way to emit metrics directly without having to expose a port which is then scraped. This saves us from additional configuration and processing. The following example sets up an otlp exporter to emit metrics:
service:
  telemetry:
    metrics:
      readers:
        - periodic:
            interval: 10000 # 10s in milliseconds
            exporter:
              otlp:
                protocol: http/protobuf
                endpoint: https://api.honeycomb.io
                headers:
                  "x-honeycomb-team": <YOUR API KEY HERE>
"x-honeycomb-dataset": "collector-metrics"Unlike with logs, the resulting metrics from using either the Prometheus scraper or the direct approach to sending metrics from the Collector end up in the same data being produced. Some attributes may differ depending on your Prometheus receiver configuration.

Traces
The effort to support exporting the Collector’s internal telemetry via OTLP all started with traces. Before this feature was implemented, there was no way to export the Collector’s internal traces. There are still many improvements to be made to tracing in the Collector—as of today, only a few of the components record spans. The goals of the tracing effort are to provide:
- Data to investigate additional details of error conditions
- The ability to visualize all the components in the Collector’s telemetry pipelines
- A mechanism for calculating how long the Collector takes to process data through its pipelines
A familiar configuration supports emitting traces from the Collector:
service:
  telemetry:
    traces:
      processors:
        - batch:
            exporter:
              otlp:
                protocol: http/protobuf
                endpoint: https://api.honeycomb.io
                headers:
"x-honeycomb-team": <YOUR API KEY HERE>Some areas where the community is improving tracing in the Collector are around ensuring that spans are linked when asynchronous processing is enabled, and adding trace support for all components automatically.
Profiles
The newest addition to the list of signals supported by OpenTelemetry is continuous profiling. This allows you to capture data about a running application to further investigate performance issues. The Collector supports capturing profiling data via the Performance Profiler extension, which can help identify:
- If a particular component is allocating more memory than it should
- Hotspots in code paths
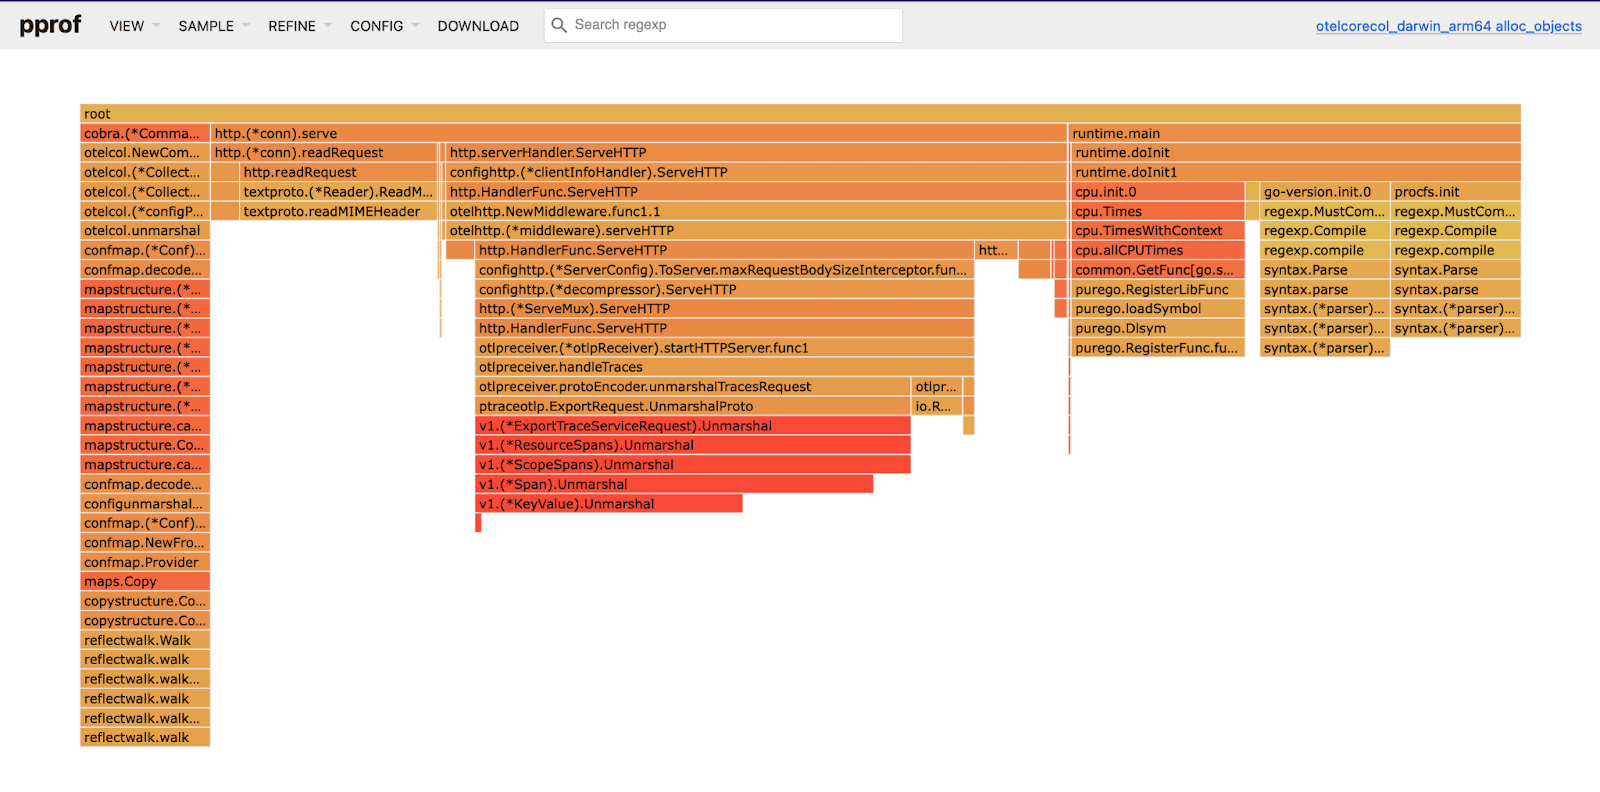
This extension uses the underlying mechanism that is built into Go, pprof, to provide details about memory allocations and CPU consumption of the Collector.
extensions:
  pprof:
    endpoint: localhost:1777

service:
extensions: [pprof]The different types of profiles supported can be found by looking at http://localhost:1777/debug/pprof/. Go provides the tool necessary to visualize profiles locally, which can be used in conjunction with the Collector extension. The following command uses go tool pprof to visualize the heap profile:
go tool pprof -nodecount 300 -alloc_space -http :18889 http://localhost:1777/debug/pprof/heap
Serving web UI on http://localhost:18889
Note that at this time, there is no capability in the Collector to transmit profiling details to an OTLP destination. Stay tuned for more support for this as the signal stabilizes in the project.
Takeaways
Perfecting the telemetry emitted by an application is an art that requires many tweaks to get right. The internal telemetry the Collector emits today is likely to change in the future as the project continues to stabilize. The mechanisms available to emit that telemetry to a backend that is OTLP compatible are here to stay, as they reduce the effort required to gain insight into the operations of the Collector.
Stay on top of the latest developments in the telemetry by familiarizing yourself with the telemetry maturity level guide, as well as keeping up to date with release notes from the Collector.
Honeycomb and OpenTelemetry are better together. Read the guide to harness their power.
Want to know more?
Talk to our team to arrange a custom demo or for help finding the right plan.