In theory, Honeycomb is always up. Our servers run without hiccups, our user interface loads rapidly and is highly responsive, and our query engine is lightning fast. In practice, this isn’t always perfectly the case — and dedicated readers of this blog have learned about how we use those experiences to improve the product.
Now, we could spend all our time on system stability. We could polish the front-end code and look for inefficiencies; throw ever-harder test-cases at the back-end. (There are a few developers who are vocal advocates for that approach!) But we also want to make the product better — and so we keep rolling out so many great features!

How do we decide when to work on improving stability, and when we get to go make fun little tweaks?
From organizational objectives to events
So let’s say we come to an agreement with each other about “how bad” things are. When things are bad—when we’re feeling mired in small errors, or one big error that takes down the service—we can slow down on Cool Feature Development, and switch over to stability work. Conversely, when things are feeling reasonably stable, we can believe we have a pretty solid infrastructure for development, and can slow down on repair and maintenance work.
What would that agreement look like?
First, it means being able to take a good hard look at our system. Honeycomb has a mature level of observability, so we feel pretty confident that we have the raw tools to look at how we’re doing — where users are experiencing challenges, and where bugs are appearing in our system.
Second, it means coming to understand that no system is perfect. If our goal is 100% uptime at all times for all requests, then we’ll be disappointed, because some things will fail from time to time. But we can come up with statements about quality of service. Honeycomb had an internal meeting where we worked to quantify this:
- We pretty much never want to lose customer data. We live and die by storing customer data, so we want every batch of customer telemetry to get back a positive response, and quickly. Let’s say that we want them to be handled in under 100 ms, without errors, for 99.95% of requests. (That means that in a full year, we could have 4 hours of downtime.)
- We want our main service to be up pretty much every time someone clicks on honeycomb.io, and we want it to load pretty quickly. Let’s say we want to load the page without errors, within a second, for 99.9% of requests.
- Sometimes, when you run a query, it takes a little longer. For that, we decided that 99.5% of data queries should come back within 10 seconds and not return an error.
These are entirely reasonable goals. The wonderful thing is, they can actually be expressed in Honeycomb’s dogfood servers as Derived Column expressions:
For example, we would write that first one — the one about data ingest — as “We’re talking about events where request.endpoint uses the batch endpoint and the input is a POST request. When they do, they should return a code 200, and the duration_ms should be under 100.
Let’s call this a “Service Level Indicator,” because we use it to indicate how our service is doing. In our derived column language, that looks like
IF(

   AND(

      EQUALS($request.endpoint, "batch"),

      EQUALS($request.method, "POST")

   ),

   AND(

      EQUALS($response.status_code, 200),

      LT($duration_ms, 100)

   )

)
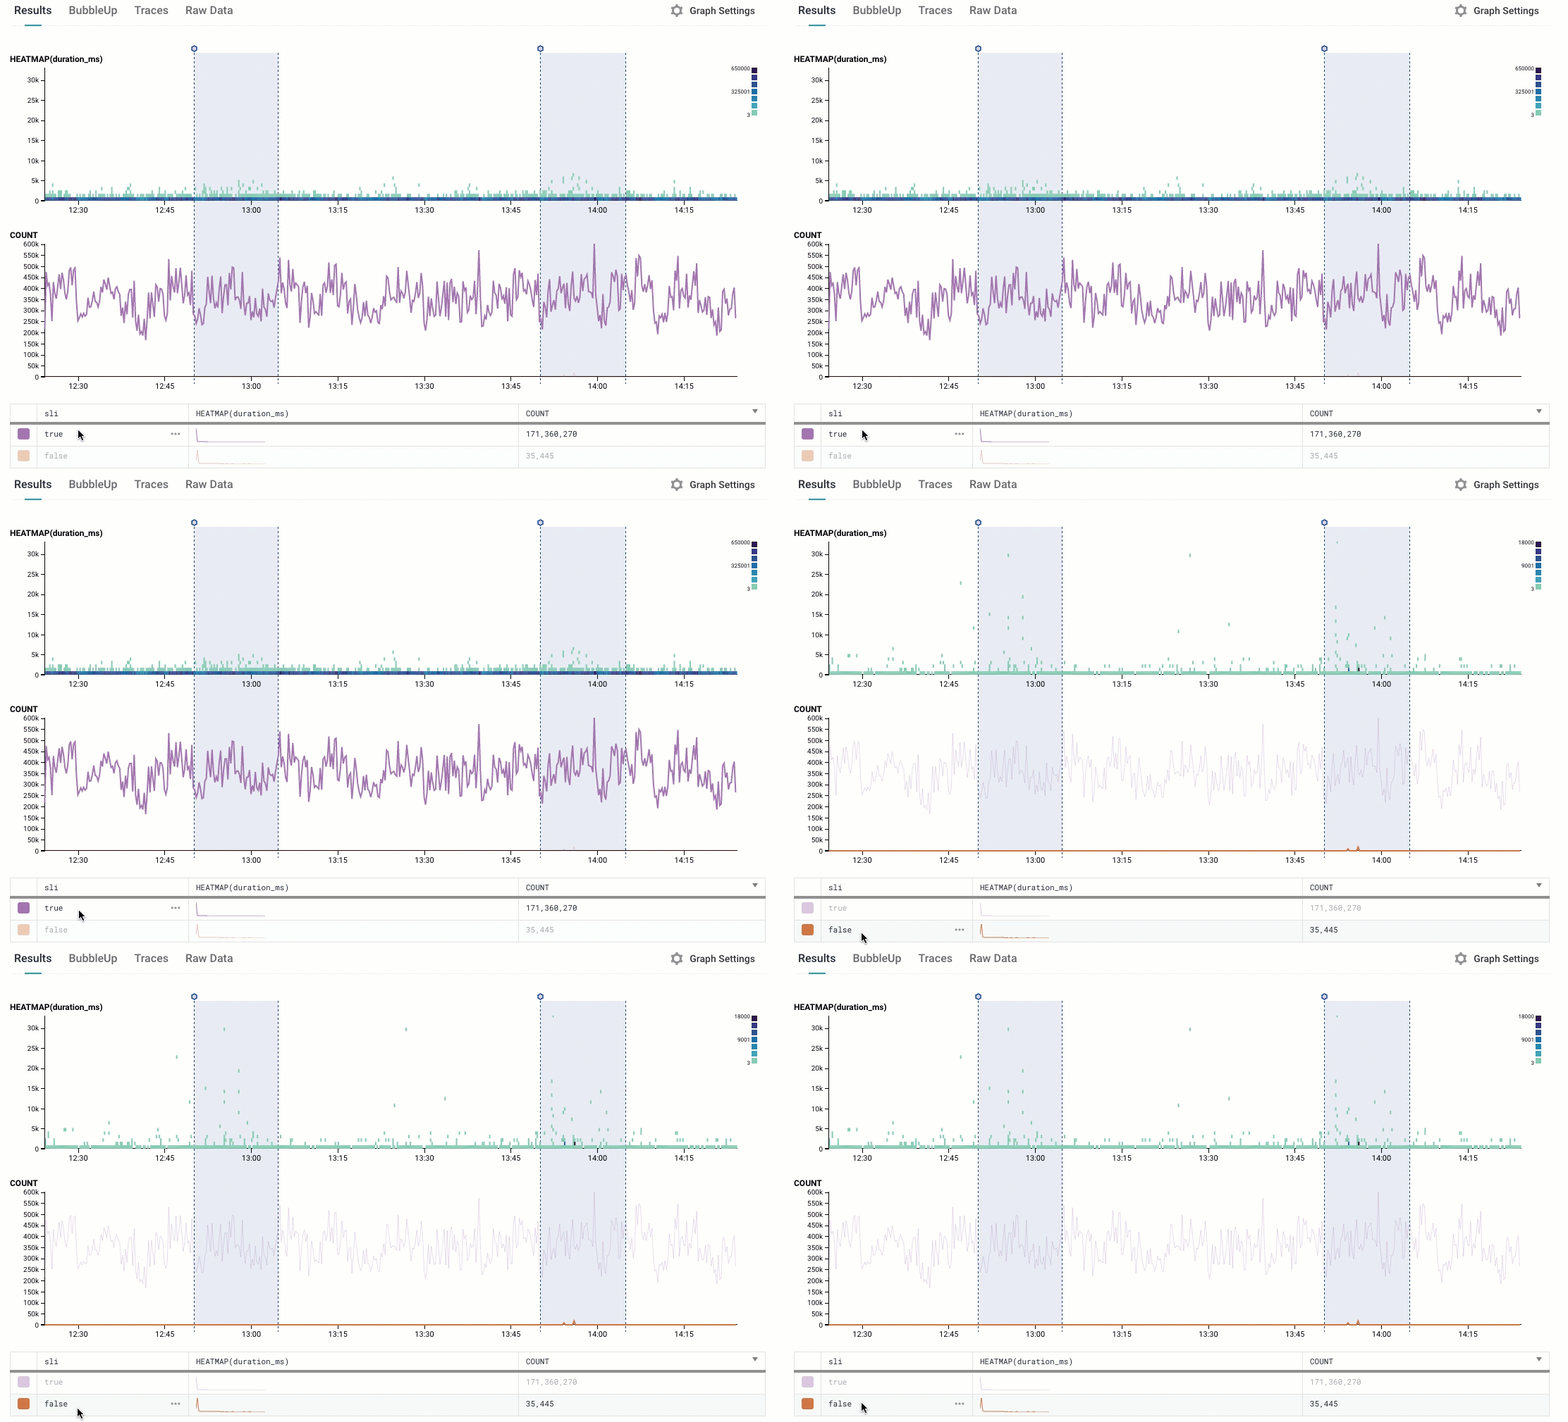
We name that derived column “SLI”, and we can generate a COUNT and a HEATMAP on it
This looks pretty sane: we see that there are many more points that are true (the indicator is ok! everything is great!) than false (oh, no, they failed!); and we can see that all the points that are slowest are in the “false” group.
Let’s whip out our Trusty Pocket Calculator: 35K events with “false”; 171 million with true. That’s about a 0.02% failure rate — we’re up at 99.98%. Sounds like we’re doing ok!

But there are still some failures. I’d love to know why!
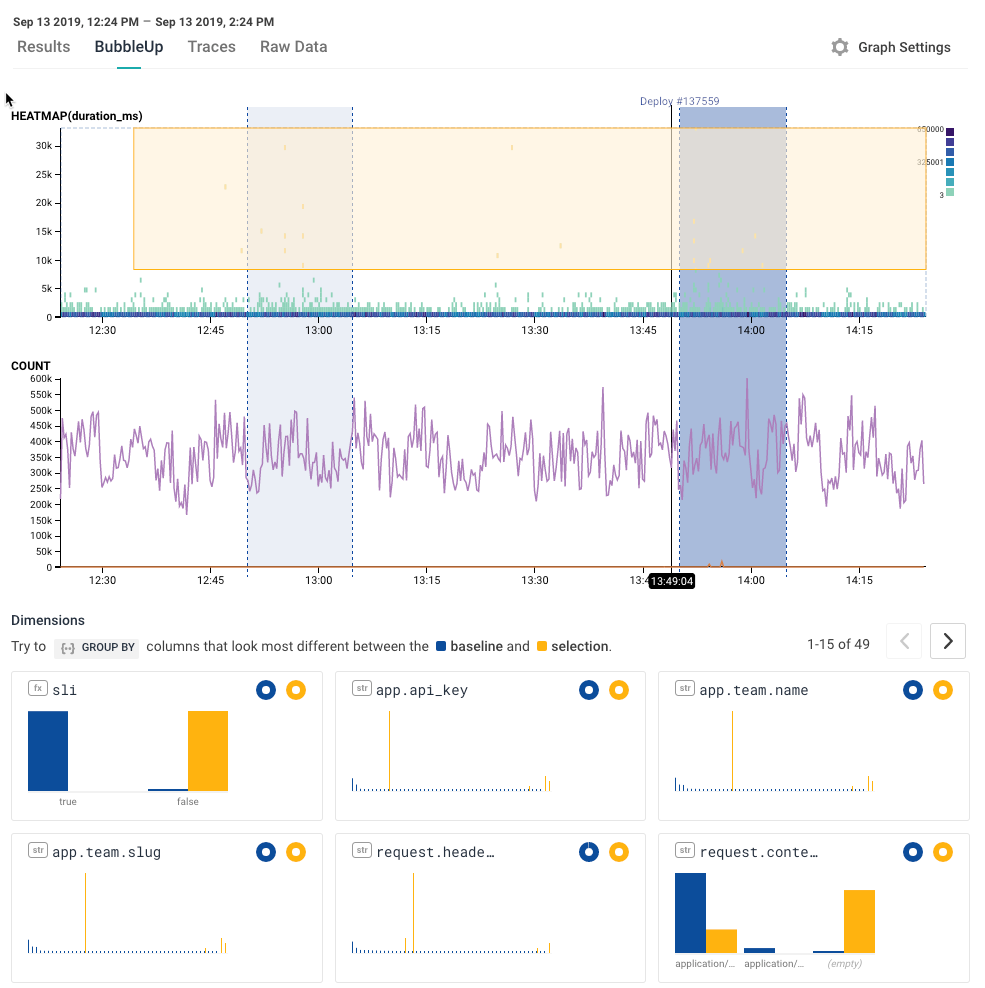
By clicking over to the BubbleUp tab, I can find out who is having this slow experience. I highlight all the slowest requests, and BubbleUp shows me a histogram for every dimension in the dataset. By finding those columns that are most different from everything else, I can see wehre these errors stand out.
… and I see that it’s one particular customer, and one particular team. Not only that, but they’re using a fairly unusual API for Honeycomb (that’s the fourth entry, request.header.user-agent)

This is great, and highly actionable! I can reach out to the customer, and find out what’s up; I can send our integrations team to go look at that particular package, and see if we’re doing something that’s making it hard to use well.
Quantifying quality of service means you can measure it
So bringing that back to where we started: we’ve found a way to start with organizational goals, and found a way to quantify our abstract concept: “always up and fast” now has a meaning, and is measurable. We can then use that to diagnose what’s going wrong, and figure out how to make it faster.
Part 2, coming soon: Wait, why did I have to pull out my pocket calculator? Don’t we have computers for that? Also, this term “SLI”, it feels familiar somehow…
Excited about what the future of operational excellence looks like? Find out today with a free Honeycomb trial.


