Blog

Category: Technical Deep Dives

Technical Deep Dives   Software Engineering  

The Most Important Developer Productivity Metric

At Honeycomb, we believe in ensuring an awesome developer experience for our own engineering teams; it's the only way that we can compete with companies...

Technical Deep Dives   Observability  

Observable Frontends: the State of OpenTelemetry in the Browser

The modern standard for observability in backend systems is: distributed traces with OpenTelemetry, plus dynamic aggregations over these events. This works very well in the...

Technical Deep Dives   Sampling  

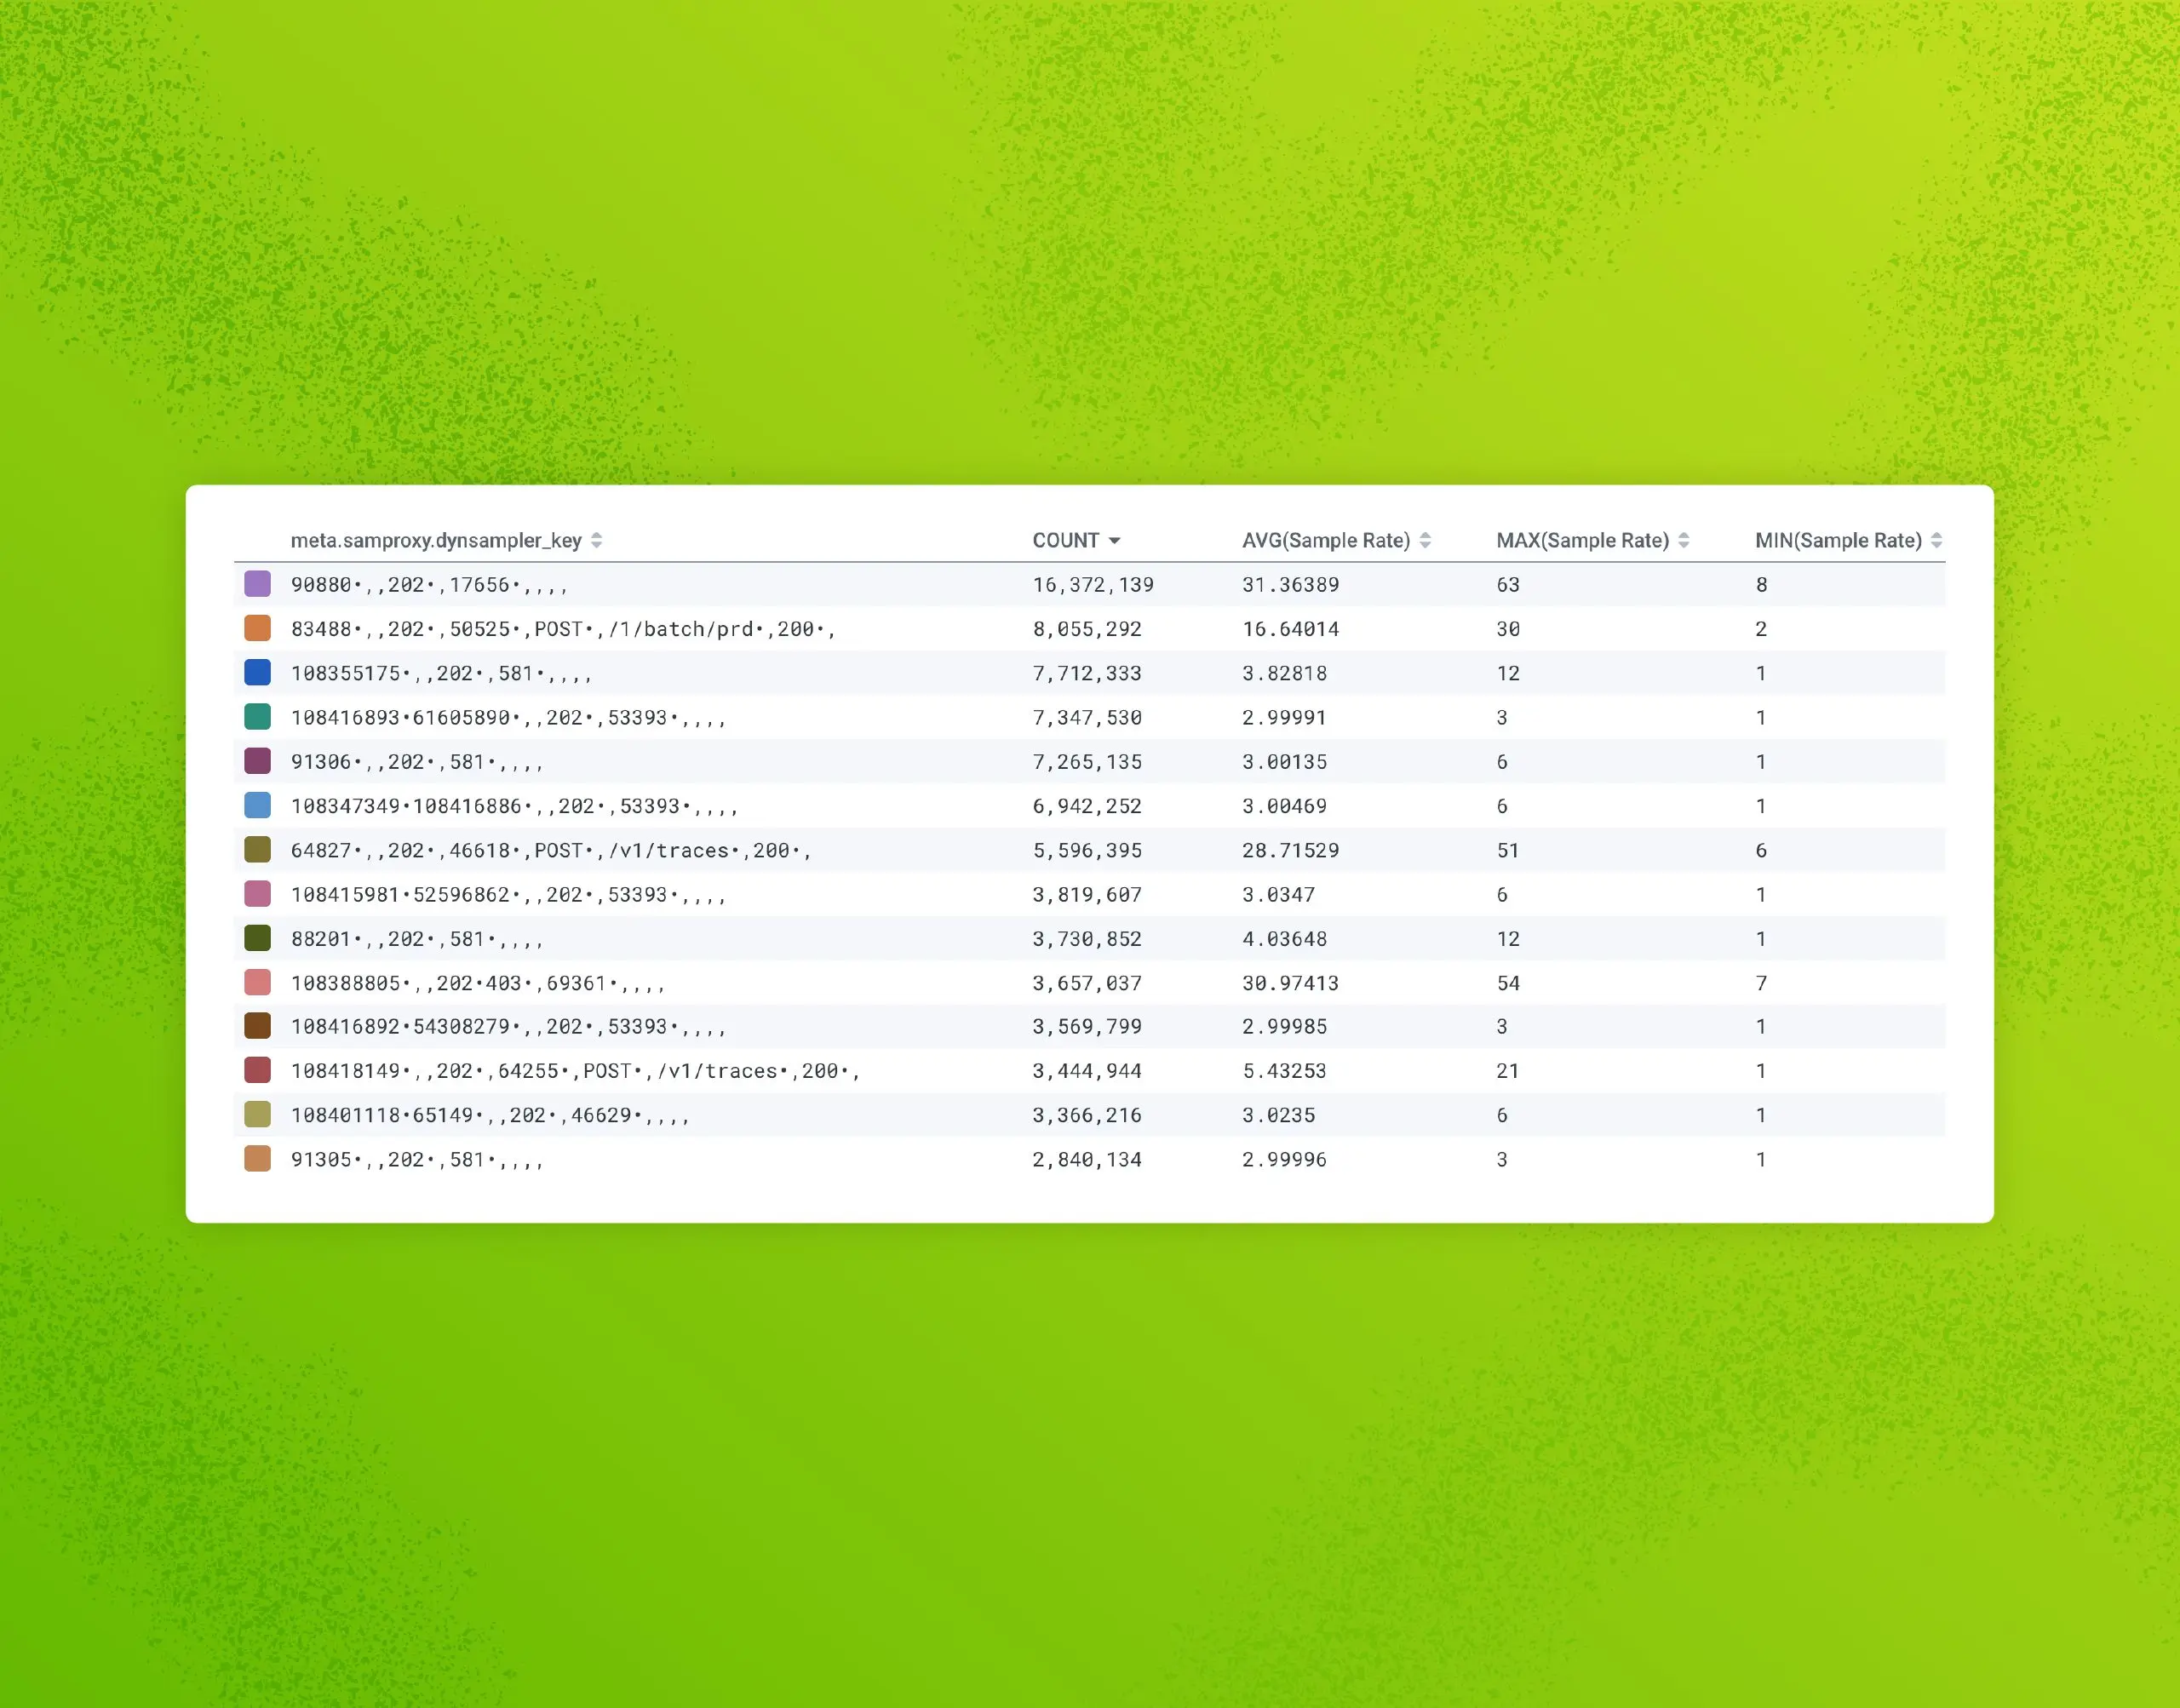
Achieving Great Dynamic Sampling with Refinery

Refinery, Honeycomb’s tail-based dynamic sampling proxy, often makes sampling feel like magic. This applies especially to dynamic sampling, because it ensures that interesting and unique...

Technical Deep Dives   Dogfooding  

Scaling Ingest With Ingest Telemetry

With the introduction of Environments & Services, we’ve seen a dramatic increase in the creation of new datasets. These new datasets are smaller than ones...

Technical Deep Dives   Instrumentation  

What Is Auto-Instrumentation?

In the past, we’ve written about what instrumentation is and the insights it provides. Instrumenting your code generates telemetry that shows you how your system...

Technical Deep Dives  

Scaling Kafka at Honeycomb

When you send telemetry into Honeycomb, our infrastructure needs to buffer your data before processing it in our "retriever" columnar storage database. For the entirety...

Technical Deep Dives   Observability   Databases  

How Time Series Databases Work—and Where They Don't

In my previous post, we explored why Honeycomb is implemented as a distributed column store. Just as interesting to consider, though, is why Honeycomb is...