Move beyond the limitations of New Relic & APM with predictable costs

Does a lack of budget and analysis workflows limit your team’s observability success?
Traditional application performance monitoring (APM) tools like New Relic leverage an outdated pricing strategy for data ingest and user access, significantly increasing costs for comprehensive platform usage. And with a dashboard-centric approach to troubleshooting that limits context and fine grained analysis, New Relic restricts the ability of engineering teams to find problems before their customers do. Honeycomb removes these limitations and makes observability successful for everyone.
Ingest all the data you need
New Relic’s data ingestion model is complex and unpredictable, influenced by factors such as indexing, metric conversion, retention adjustments, and the activation of additional services. This model creates a lack of transparency and necessitates continuous monitoring to manage costs effectively.
Honeycomb simplifies billing with a clear, predictable event-based pricing model. Users have direct control over the data sent through Honeycomb’s API, with intelligent sampling options to optimize data relevancy and cost efficiency.
Give your team more than dashboards
New Relic’s dashboards fall short on providing your team with the tools required to fix problems before they become customer-impacting. Restricted by ingest costs to add custom fields, the context provided by dashboards can be ineffective for quickly tracking down and fixing issues. In addition, these costs limit pattern detection in New Relic dashboards which rely on custom fields, keeping your team in the dark from finding new, unknown behaviors within your application.
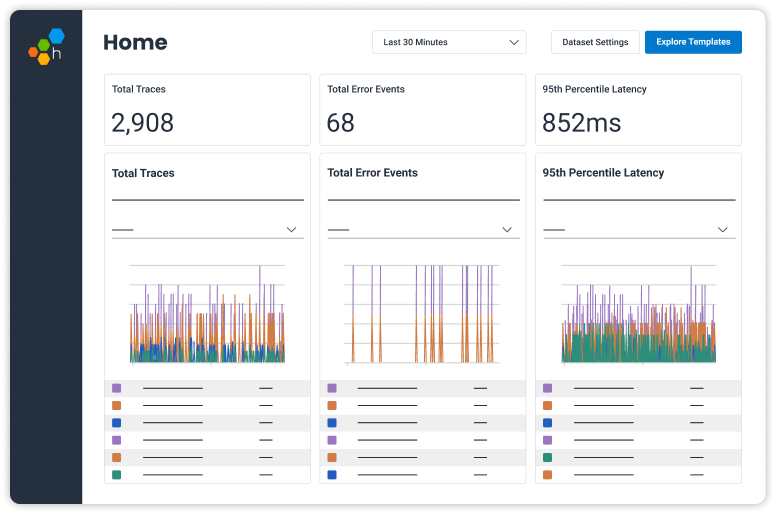
Honeycomb’s dashboards, an element of our highly focused troubleshooting workflow, unlock the context of highly-dimensional data available in our wide events. Unrestrained by data ingest costs for custom fields, your team can add as much data as you need into these wide events for discrete analysis with Query Builder, or they can be run through BubbleUp to find anomalies in your application.
Learn How to Escape the Cost/Visibility Tradeoff with Honeycomb
Talk to our team to learn how you can find greater success with observability
With Honeycomb, it’s not a case of keeping huge volumes of data in storage so your costs rise and you still need to keep more.
Cost is predictable; you know that you can rely on getting access to that one event or piece of raw data you need, so it’s more reliable.
Software Engineer

Scale observability across your entire engineering team
New Relic implements a tiered pricing strategy, leading to substantial expenses for full feature access. Important use cases such as distributed tracing and OpenTelemetry monitoring require $550+ per month per seat.
Honeycomb offers unlimited user access, allowing full querying capabilities across all features without additional charges. This policy supports a more democratic and inclusive approach to observability, enabling all team members to contribute to and benefit from comprehensive system insights throughout the development lifecycle.

Dive deeper into Honeycomb for Kubernetes
Instrument with OpenTelemetry, refined for relevance
Instead of saturating analysis with dense Kubernetes syntax, our refined instrumentation makes it easy to capture meaningful and actionable context for developers.
Human-driven, intuitive investigation
While most dashboards passively monitor clusters, Honeycomb supplements boards with a query-driven approach to pinpoint what’s wrong and how Kubernetes is involved.
Scale your cluster, not your bill
Traditional Kubernetes monitoring can be a nightmare for your bottom line as you constantly balance tradeoffs between sufficient pod visibility and per-host or per-metric billing.

