This is the second of three posts focusing on the limitations of pre-aggregated metrics. The first one explained how, by pre-aggregating, your flexibility is tightly constrained when trying to explore data or debug problems. The third can be found here.
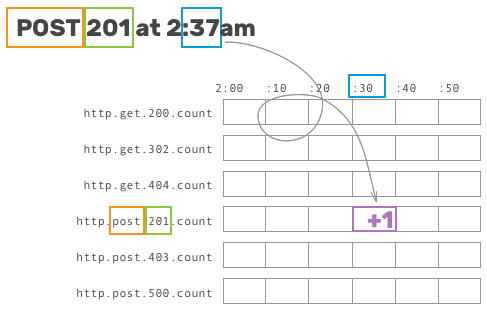
The nature of pre-aggregated time series is such that they all ultimately rely on the same general steps for storage: a multidimensional set of keys and values comes in the door, that individual logical “event” (say, an API request or a database operation) gets broken down into its constituent parts, and attributes are carefully sliced in order to increment discrete counters.
This aggregation step—this slicing and incrementing of discrete counters—not only reduces the granularity of your data, but also constrains your ability to separate signal from noise. The storage strategy of pre-aggregated metrics inherently rely on a countable number of well-known metrics; once your requirements cause that number to inflate, you’ve got some hard choices to make.
Let’s walk through an example. As in our previous post, given an inbound request to our API server, a reasonable metric to track might look something like this:
statsd.increment(`http.${method}.${status_code}.count`)
(A note: many modern time series offerings implement attributes like method and status_code as “tags,” which are stored separately from the metric name. They offer greater flexibility but the storage constraints are ultimately the same, so read on.)
Some nuts and bolts behind time series storage
To understand this next bit, let’s talk about how these increment calls map to work on disk. Pre-aggregated time series databases generally operate under the same principles: after defining a key name and a chosen granularity, events trigger writes to a specific bucket based on its attributes and the associated time.

This allows writes to be handled incredibly quickly, storage to be relatively cheap when the range of possible buckets is fairly small, and reads to be easily read sequentially.
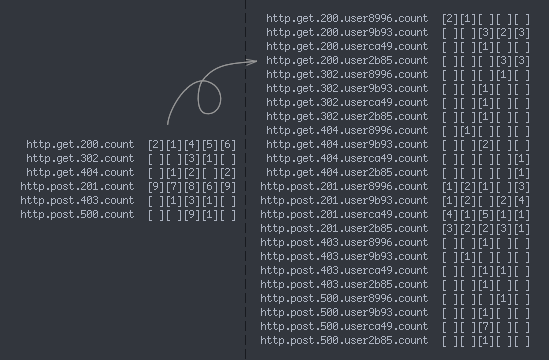
The problem, then, is that the number of unique metrics directly affects the amount of storage needed to track all of the metrics—not the underlying data or traffic but the number of these predicted, well-defined parameters. As touched on above, there are two surefire ways to dramatically increase this number (and cause some serious stress on your time series storage):
- Each new attribute added to a set of metric names might increase the number of unique metrics exponentially, as the storage system has to track the cross product of each combination of values. You have to either accept that combinatorial explosion or choose to track only the first-order slice for a given attribute (just
http.${hostname}.count). - Track an attribute with a particularly large set of potential values. Common high-cardinality attributes in this case are things like user ID, OS/SDK version, user agent, or referrer—and could cause the storage system to allocate a bucket for each discrete value. You have to either accept that storage cost or use a whitelist to only aggregate metrics for a set number of common (or important) user IDs/OS versions/user agents/etc.

It’s painful for any service to be unable to think about metrics in terms of user segments, but crucial for any platform with a large number of distinct traffic patterns to do so. At Parse, for example, being able to identify a single app’s terrible queries as the culprit for some pathological Mongo behavior allowed us to quickly diagnose the problem and blacklist that traffic. Relying on pre-aggregated metrics would have required us to pick our top N most important customers to pay attention to, while essentially ignoring the rest.
Ultimately, no matter the specific pre-aggregated metrics tool, it’s all the same under the hood: constraints inherent in the storage strategy hobble you, the user, from being able to segment data in the most meaningful ways.
Curious to see how we’re different? Give us a shot!
Honeycomb can ingest anything described above, and do so much more. If you’re tired of being constrained by your tools—and you realize that there are some breakdowns in your data (user ID? application or project ID?) that you’ve always wanted but been conditioned to avoid—take a look at our long-tail dogfooding post to see this in action, or sign up and give us a try yourself!
Next, we’ll take a look at how, sometimes, simply being able to peek at a raw event can provide invaluable clues while tracking down hairy systems problems.


