What should you log?
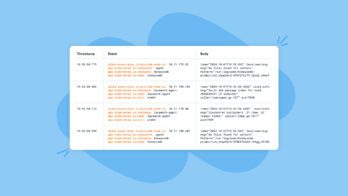
When your systems break, it’s great to be able to look at what they were doing just before they broke. A log is a common solution. But hands up if you’ve come across a log that looks like this:
11:32:33 Processing request for user 42
11:32:33 Request processed successfully
11:32:33 Processing request for user 43
11:32:33 WARNING: user 43 sprocket needs adjusting!
11:32:33 Processing request for user 44
11:32:33 Request processed successfully
11:32:34 NullPointerException in adjustSprocket()
11:32:34 Processing request for user 43
11:32:34 Request processed successfully
11:32:34 Processing request for user 44
What caused the exception? Maybe it was the sprocket in need of adjustment, but we have to filter out a lot of uninteresting information before we can see that. Were there any other exceptions like this? Did every sprocket cause an exception, or was it just this one? That signal is buried in noise.
How about this kind of log:
09:00 Starting service on port 8080
15:34 Exception: the widget exploded!
15:34 Shutting down service
No noise to filter out, but… what happened in the intervening six hours? Was the service even doing anything? Whatever caused the explosion is anyone’s guess.
The first system is logging too much. The second one is logging too little. What’s the sweet spot?
The unfulfilled promise of log levels
The common solution to this problem is log levels. Log “Processing request” and “processed successfully” as DEBUG or INFO; log exceptions as ERROR; configure a log threshold, and everything will be fine. This turns into coding style guides like “don’t log for the common case” or “log expected occurrences on INFO”.
But what’s the right threshold to set? If you configure it statically, you’re back to square one: either throwing away the detail, or printing useless noise. Even if you can change the threshold while the system is running, that’s still too late to see what happened before the explosion.
Again, there’s a common solution: log everything, and just grep for the log levels you care about. That works! But you’re still storing all those DEBUG logs on disk, even if you never look at them. If you’re running a high-volume system, you have even more logs being produced, and even more machines producing them, and log storage starts to be really expensive. So you dedicate an engineering sprint to cleaning up old logging statements, and you move things from WARNING to INFO to DEBUG, and suddenly you’re back to square one… again.
Eye of the beholder
The value of logs is in what questions you can answer with them. Logs are designed for humans to read. But logs are no longer human-scale – they are machine-scale, and we need machines to help us make sense of them.
grep is a very simple machine that helps us use logs to answer some simple questions, like “what happened to this user?” or “what major events happened yesterday?” Log aggregators are essentially larger-scale versions of grep. Log levels are crude hints to the machine.
We need to demand more from our tools, and give our tools more to work with. What if instead of emitting logs for humans to read, we emitted events for machines to analyse? What would those events look like? What sort of hints would we want to give to the machine? What sort of questions could we ask it?
The spectrum of interestingness
The root problem with noise is that not all events are equally interesting. For example:
- Your server crashed. You probably want to know about that, and maybe even page somebody.
- A customer couldn’t buy your product because your server threw an exception. You probably want to be notified of that – at least the first time it happens, to tell you there’s a bug to fix. (This case is well served by exception notification services.)
- A call to the payment service timed out, but you retried and succeeded. Sounds like everything working as designed… if it happens once. But you probably want to know how often it’s happening: if it’s 50% of calls, that’s a problem.
- A customer bought a product successfully. Not a problem! The opposite of a problem. But you still want to know how often it’s happening!
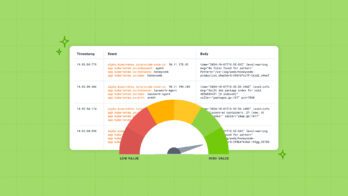
These events lie on a spectrum, and there are many more examples I could give. Trying to cram all of this into a few categories like INFO, WARNING and ERROR is simply not expressive enough, and an all-or-nothing filter is not a powerful enough tool, to deal with events of varying degrees of interestingness.
What if we could provide a more expressive measure of interestingness? That’s what you get by tagging each event with a sample rate. A sample rate of 20 means “there were 19 other events just like this one”. A sample rate of 1 means “this event is interesting on its own”. As a developer instrumenting your code, you can decide how interesting a given event is likely to be: did an error occur, was the database call really slow, is this an important customer?
Once you know that one event is like 19 others, you can skip emitting the 19 others. That way, you don’t have to pay to store all that noise, or spend time filtering through it. But unlike grepping for ERROR, you’re not dropping every uninteresting event – just the vast majority of them. That gives the tools something to work with. Now you can ask questions like “how many pages did we serve” and “how many exceptions occurred”, in the same tool, without storing tons of noise.
Of course, machines can do way more than filtering and counting. Now we’re emitting events for machines to read, rather than humans, we can supply much more context for every event – how long the request took, which customer made it, which database tables we queried. And the machine can do what machines do best – help humans make sense of data. You can see whether that spike in exceptions was correlated with elevated response times, or with querying certain tables, or whether it only happened for certain customers.
Observable systems
We need to build our systems to be more observable: so we can tell what’s going on, how busy they are, how healthy they are. But the tools we used to use – logs, read by humans, filtered by crude rules – aren’t good enough any more. We need better tools, and we need to design our systems to give the tools better data.
So say goodbye to your log levels, and bid farewell to noisy logs and opaque services. Build observable systems, today!


