When it comes to observing systems, it helps to have tools that quickly and efficiently allow you to highlight events, anomalies, or simply changes to the code base. Enter Markers.

Markers have long been a feature of Honeycomb’s platform: honeymarker, our lightweight-CRUD command line interface for managing your Markers, currently lets you generate Markers or create them via Curl commandsthrough the API. We’ve upped the ante and made some improvements to our Markers flow, enabling you to now:
Add Markers to Queries directly from the Query Page
In just a few clicks, you can now add Markers to your query to bring attention to interesting parts of your data.
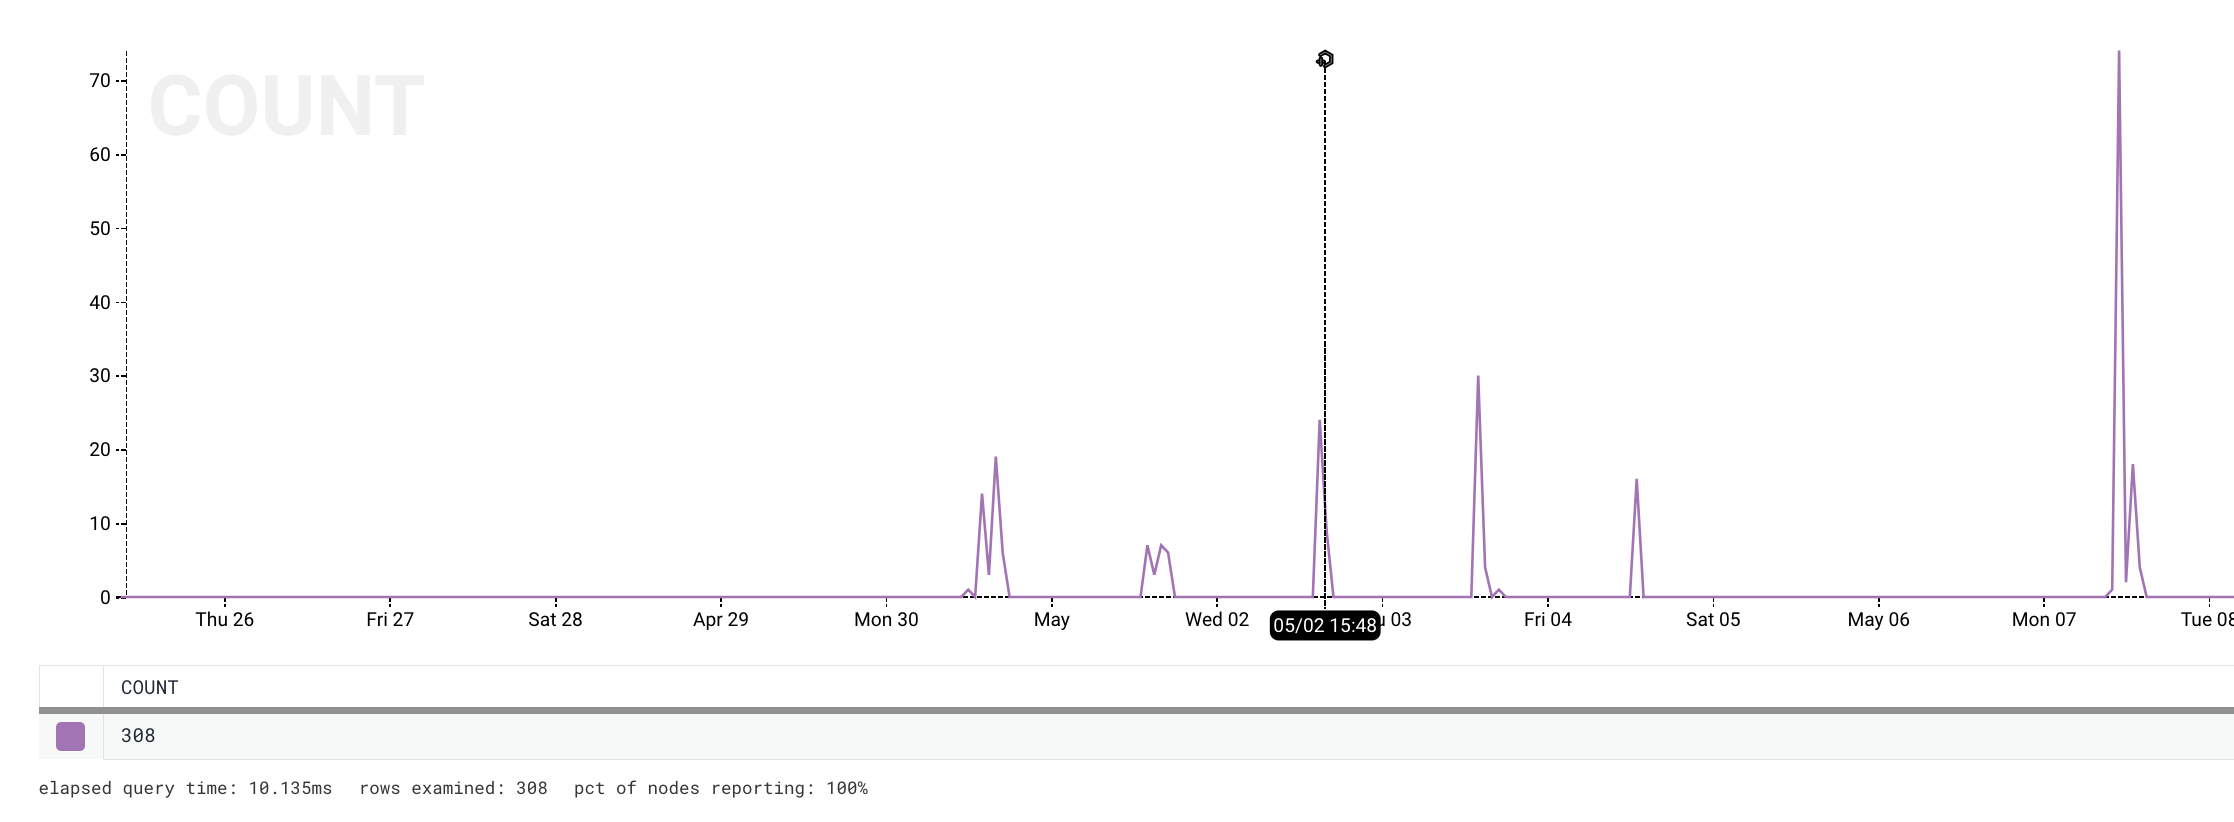
Drag the cursor along the graph area of the display to your desired time point.
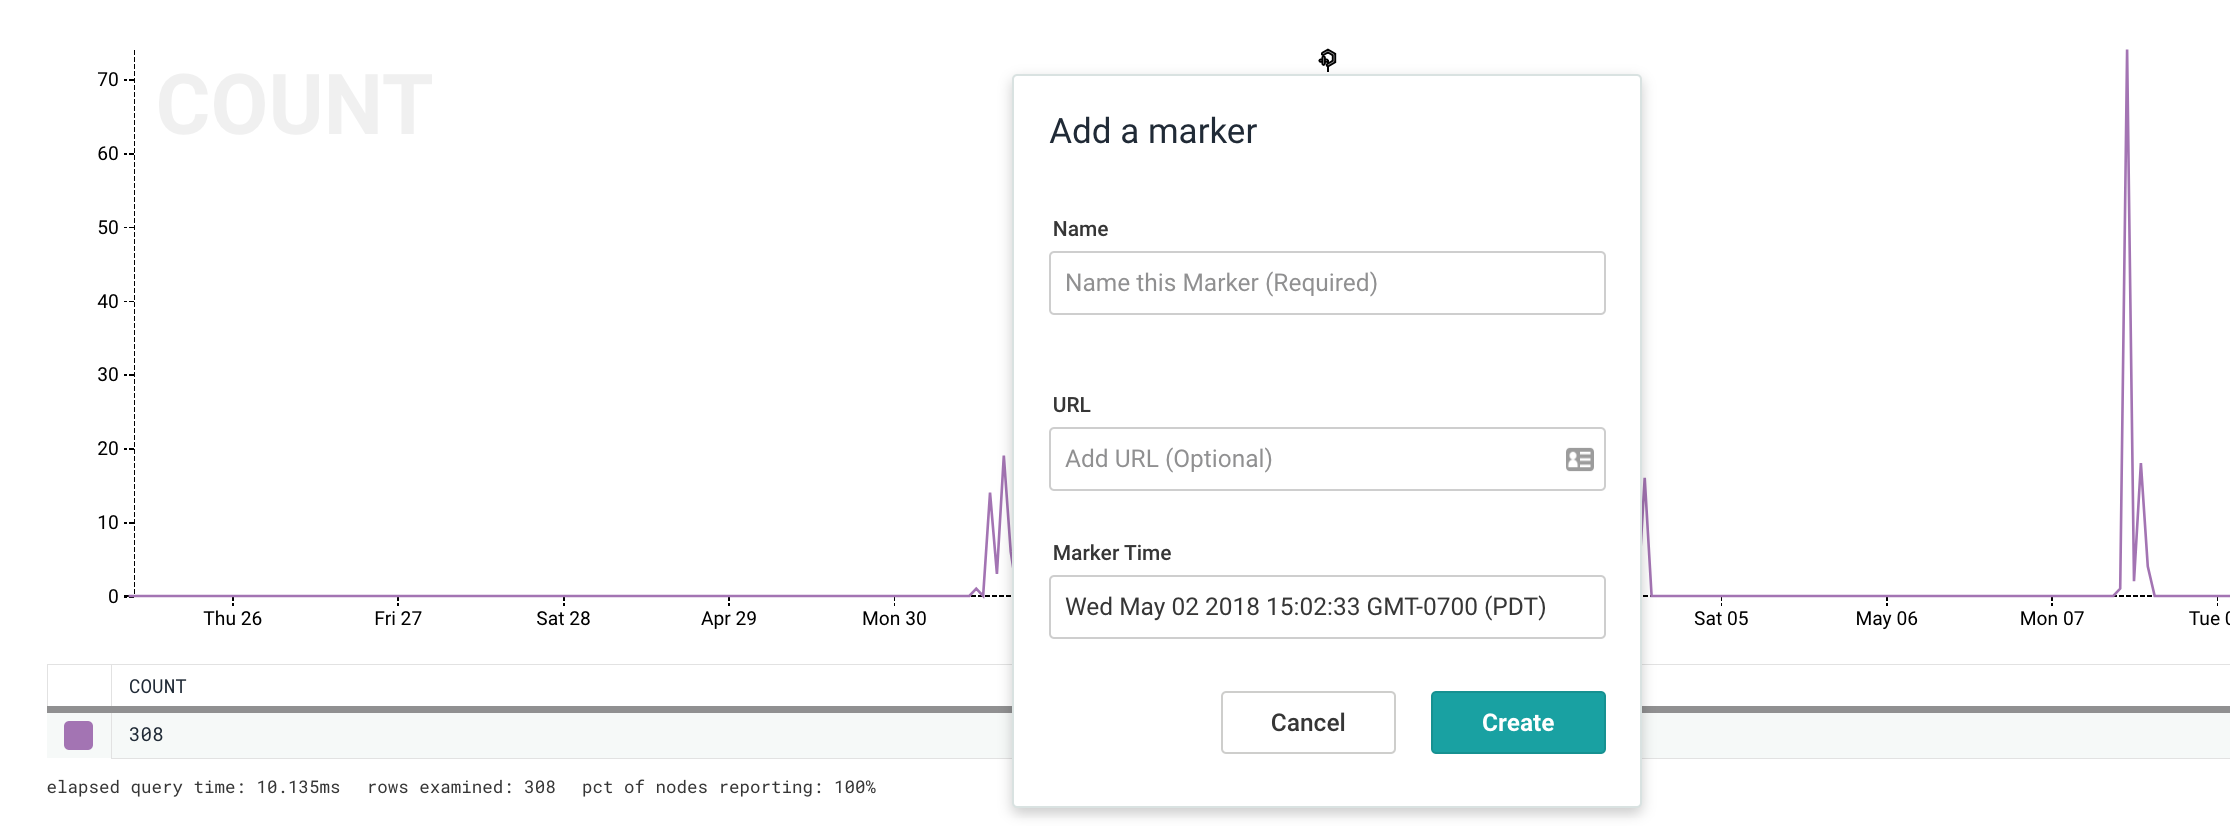
When you’ve found the perfect spot to create your Marker, click the ‘honey-plus’ icon atop the the timebar to open the ‘Add a Marker’ dialog box.
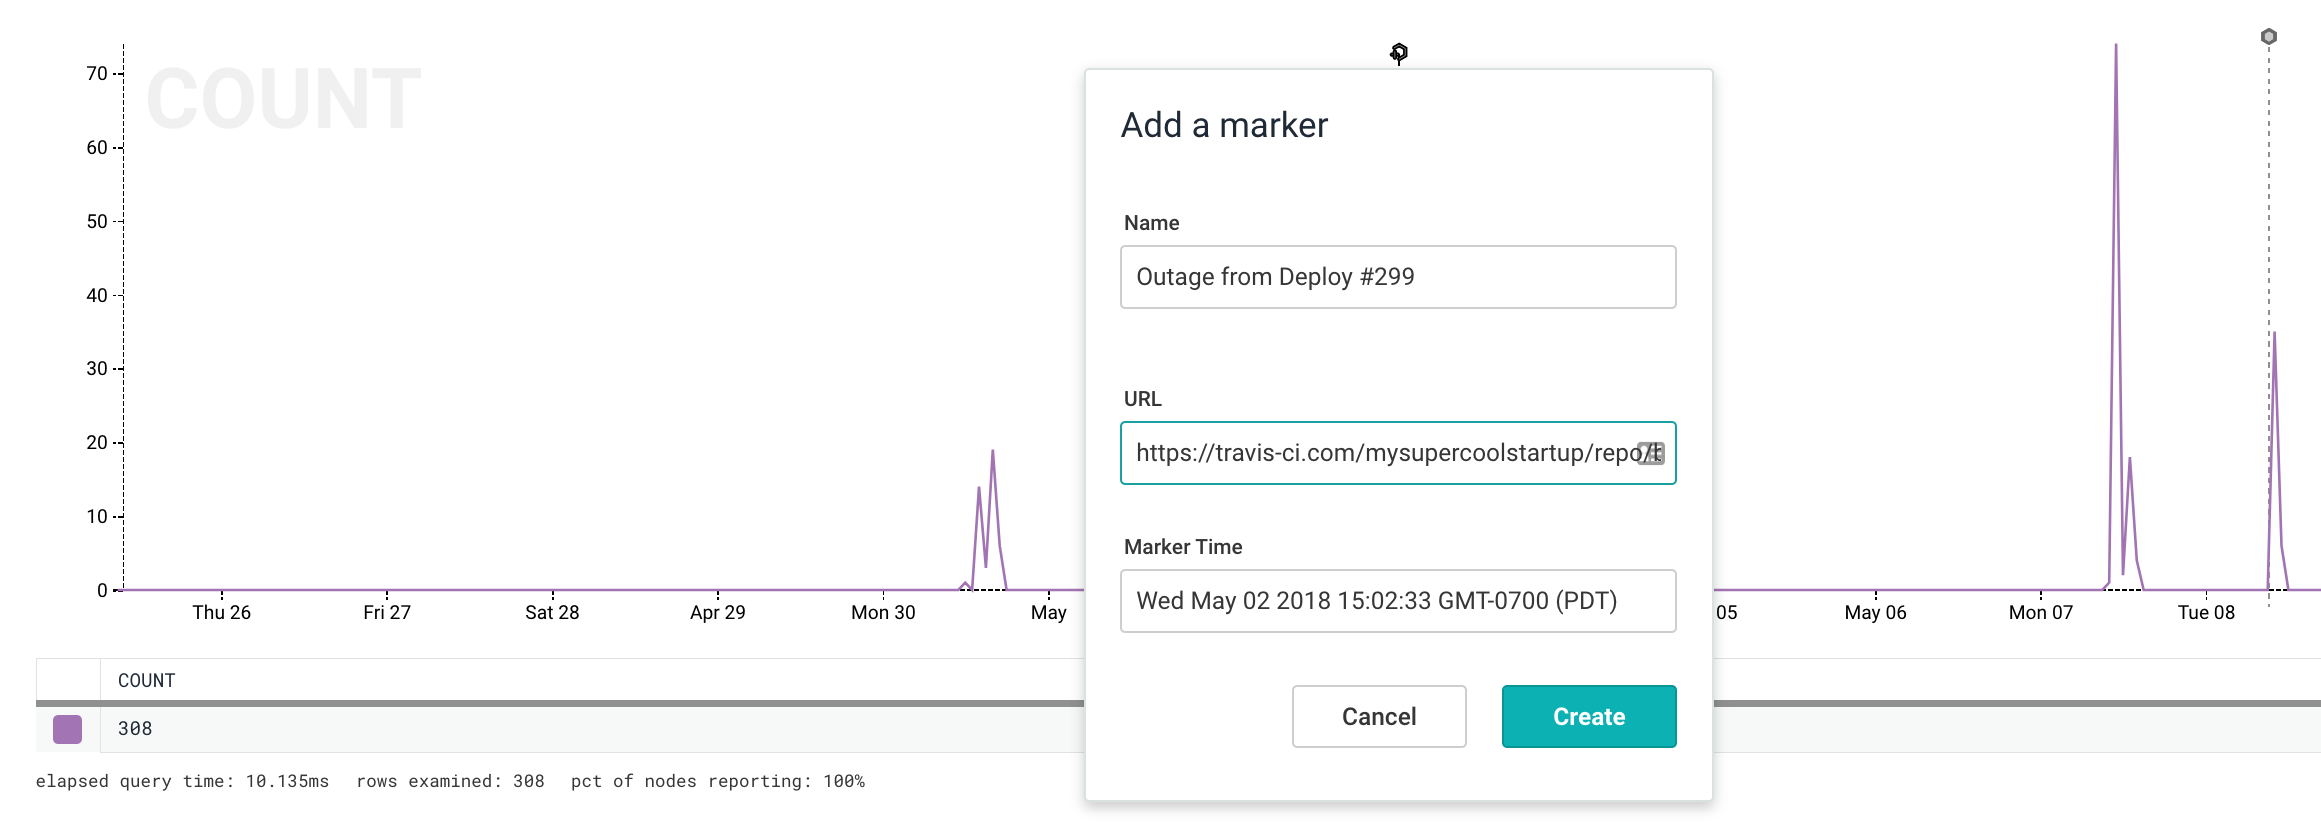
Enter a description for your Marker in the name field (“Deploy #299” or “Abnormal Spike in Products Page Traffic”). The URL field is optional but is a great way to provide a link offering more context on the need for the Marker.
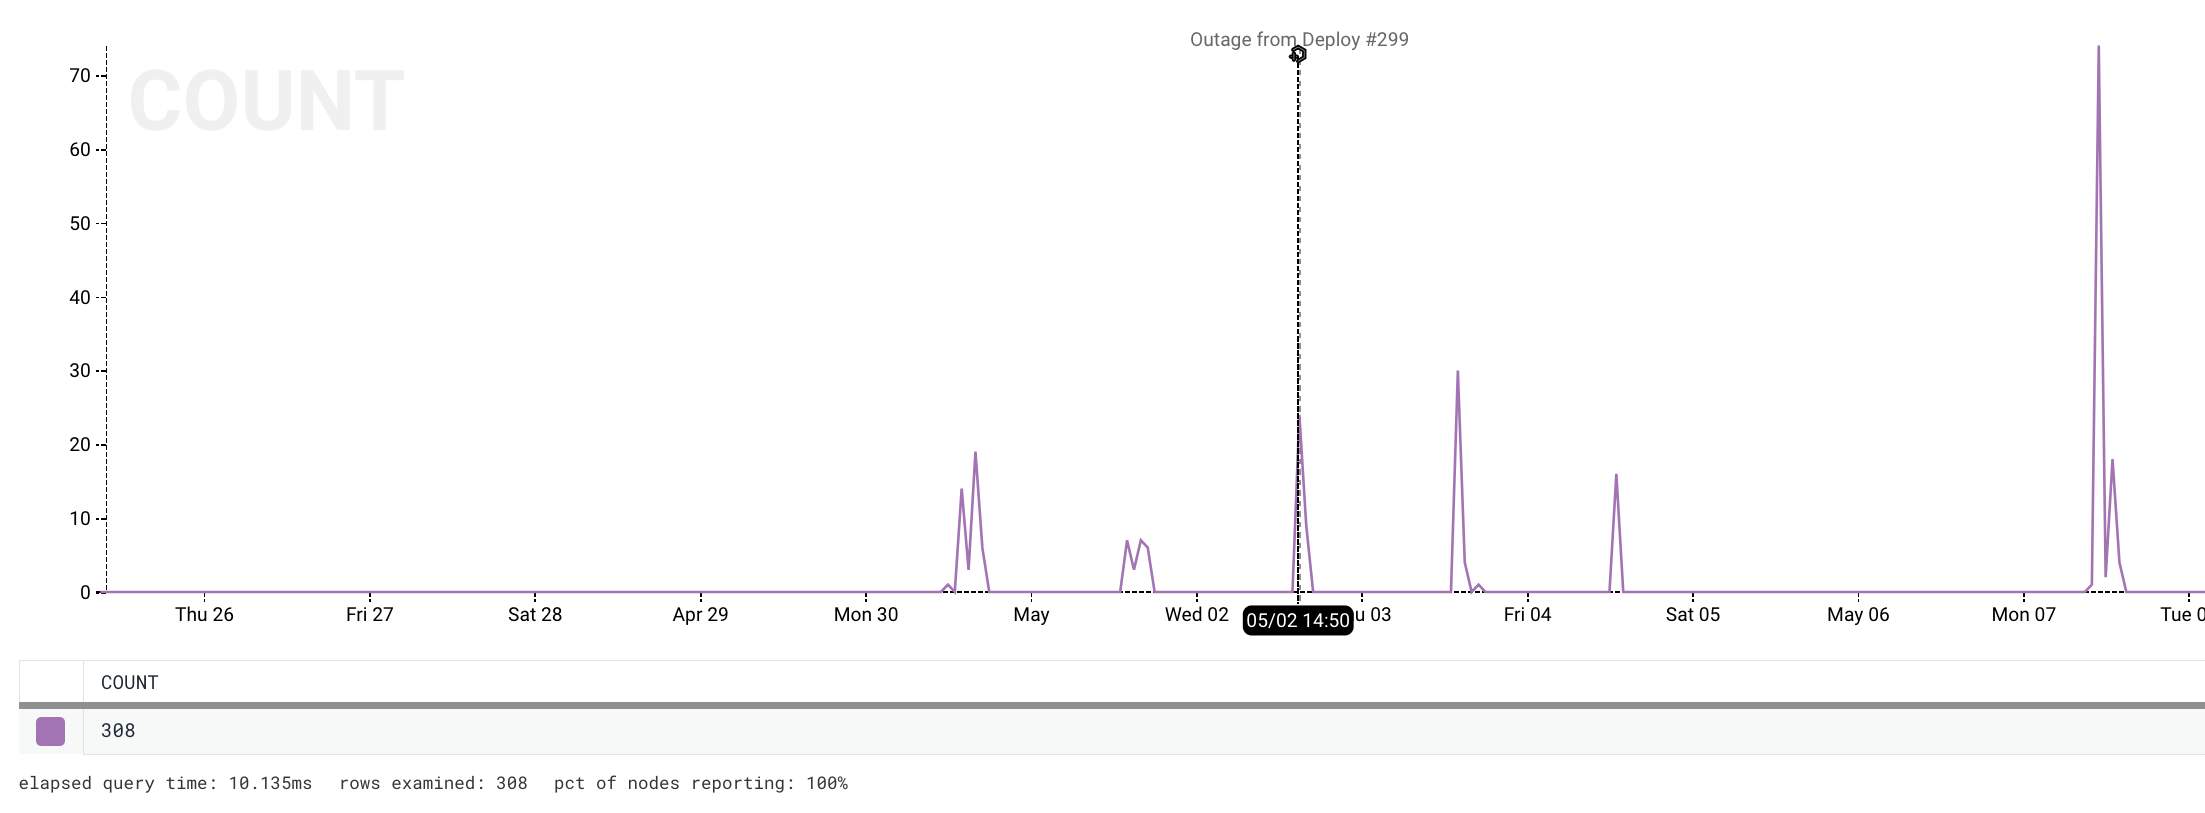
Once you’re satisfied with your entry, click Create to add your Marker to the graph. A dotted vertical line will now display at the designated time point. Hover over the Marker to see the description. If you entered a URL, clicking on the Marker’s description will take you to that address.
This graph depicts the newly-created marker at the selected time, with the given description.
Want to see more? Try us out for free!


