Thank you so much to all who attended Raw & Real Ep. 5 “All Aboard! Bring Your Team Together,” and to any who take the time out of their busy days to watch the recording 🙂
Recap
This was a session for those who would describe yourselves as “internal champions” of Honeycomb and Observability. You’ve instrumented an application with our Beeline or perhaps with OpenTelemetry, and you’ve been blown away by seeing traces of your app, or BubbleUps that point out a customer in pain. You get it! And now you want all your teammates to feel the same excitement you do, and you want your management bought in on SLOs.
There’s six relatively easy steps I recommend to getting the rest of your team and company on board with Honeycomb:
SSO
Whenever you introduce a new tool, there’s always friction and/or busywork around signing up. We make this easy by allowing SSO at our Pro and Enterprise tiers. Honeycomb will automatically add users to your team when you enable SSO for Google Auth, Okta, or generic SAML.
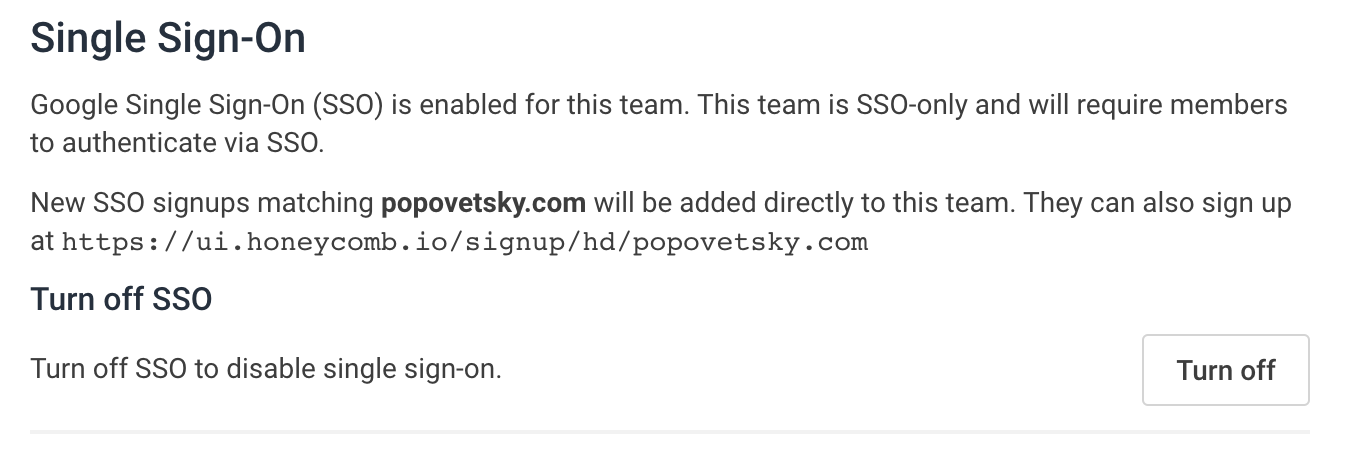
You can also send your users to a special SSO sign-in page so they get straight in:

Slack Integration
Our Slack integration is delightful because it lets you pull your interesting graphs and traces straight into your conversation. This is so incredibly useful during incidents or if you just need a reminder about how your team found and resolved a similar issue in the past.
All Honeycomb permalinks can be shared into Slack, where they are automatically “unfurled” like so:
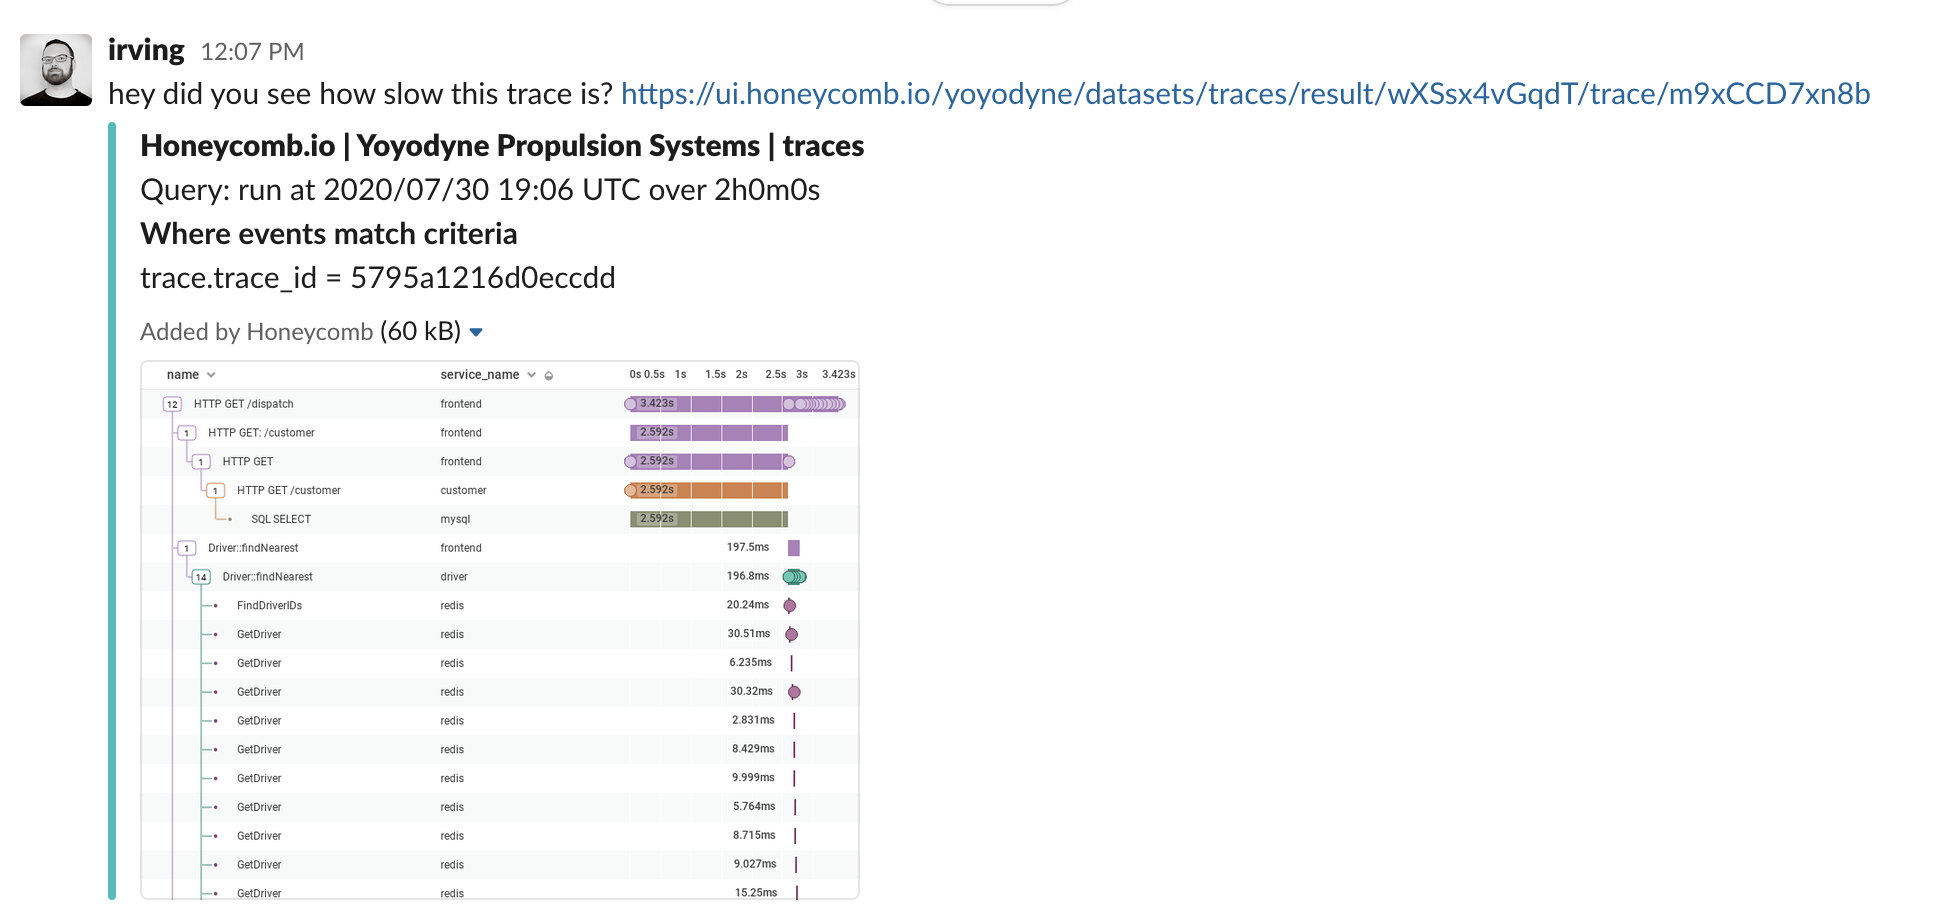
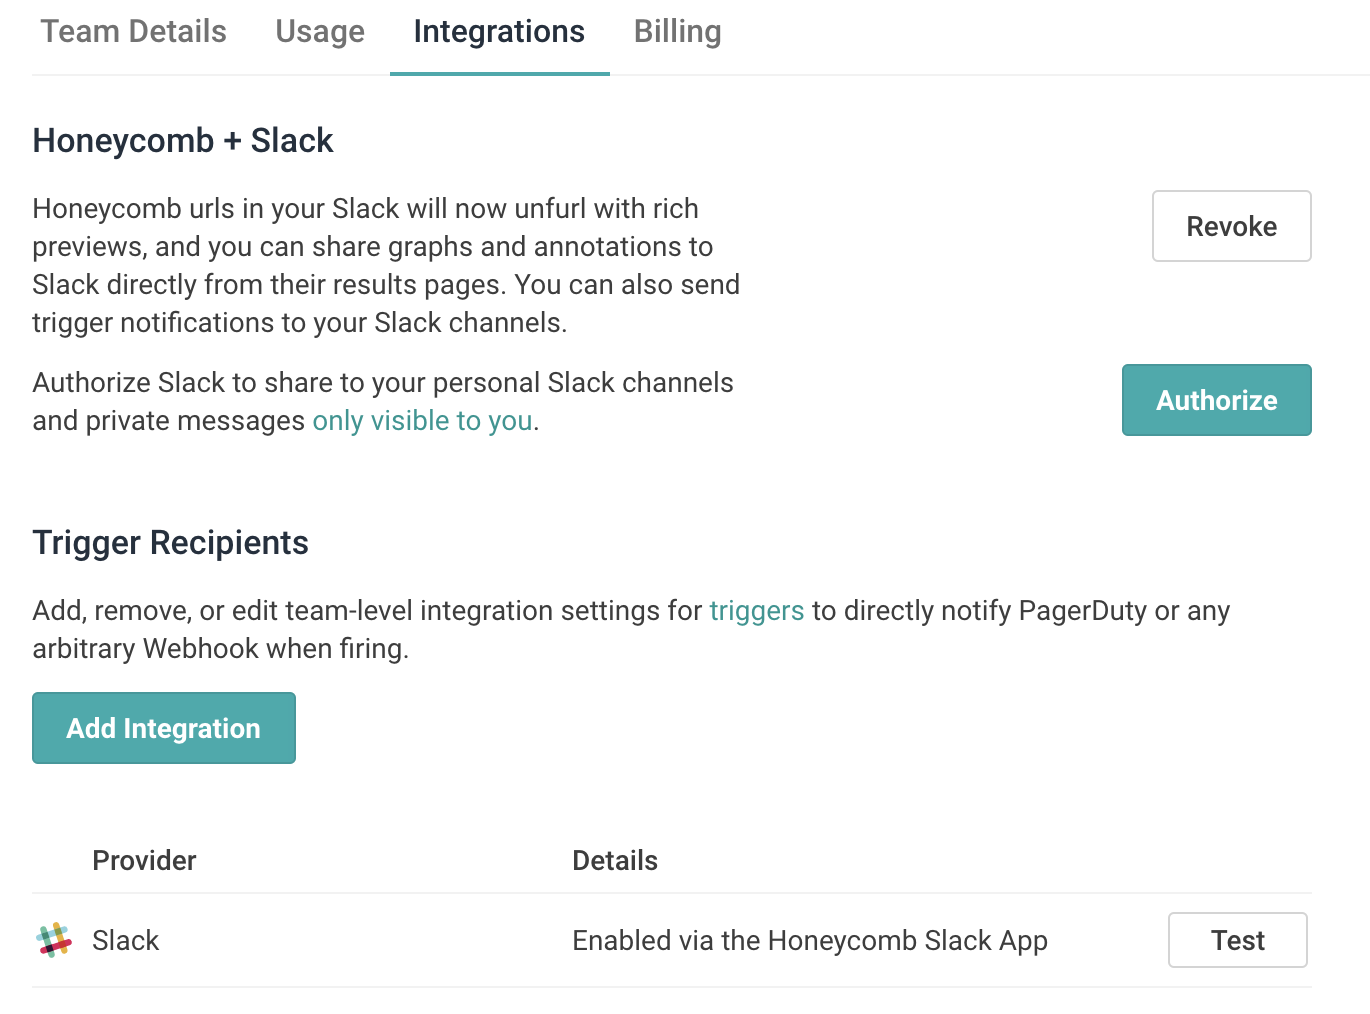
You can enable the Slack integration from your Team Settings → Integrations page.
Alerting
You don’t always have to be the one who’s pasting Honeycomb links into Slack, you can also have Honeycomb do it for you automatically when certain conditions are reached.
Triggers let you set any condition you want from a Honeycomb visualization. Beyond simply sending these to Slack, they can also go to Email, PagerDuty or any service that has a webhook:

You can do the same with SLO burn alerts. Typically you want to have a longer (24-hour) burn alert that’s non-urgent, and a shorter (4-hour) burn alert that pages people:

Markers
Markers are a great way to bring external system context into Honeycomb. I recommend starting with deployment markers so that you can quickly and easily see if your deployments had any impact on performance or availability.
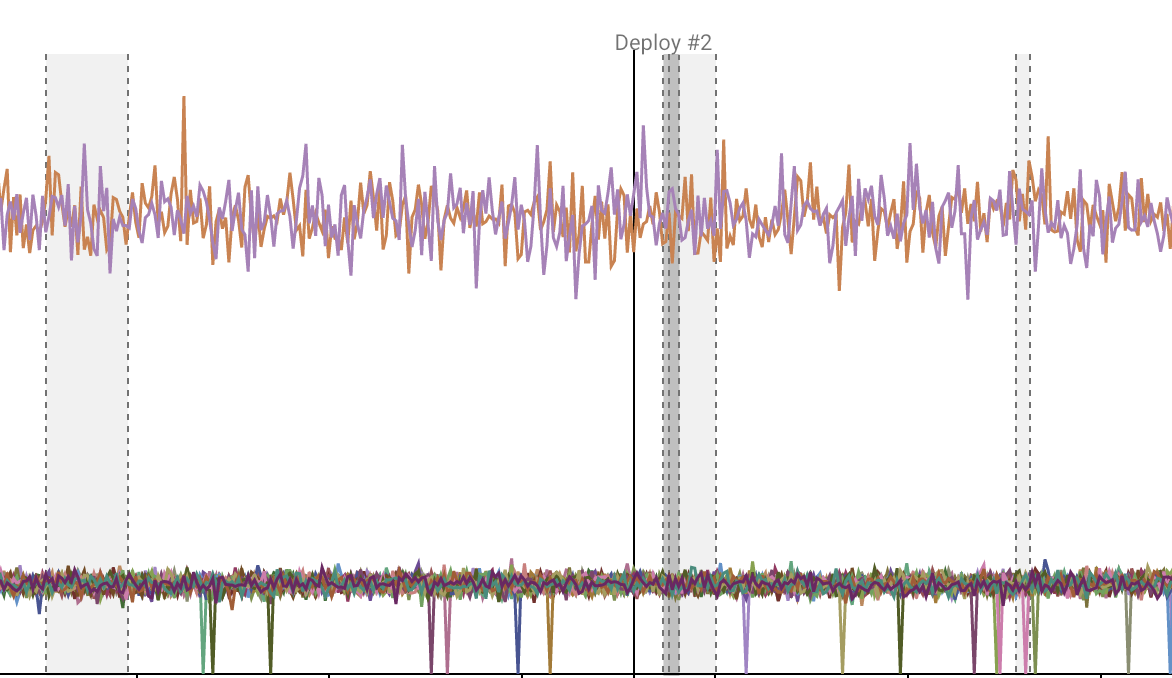
Markers can be added manually by clicking and dragging on a dashboard, sending an API call, or using our honeymarker tool.
Boards
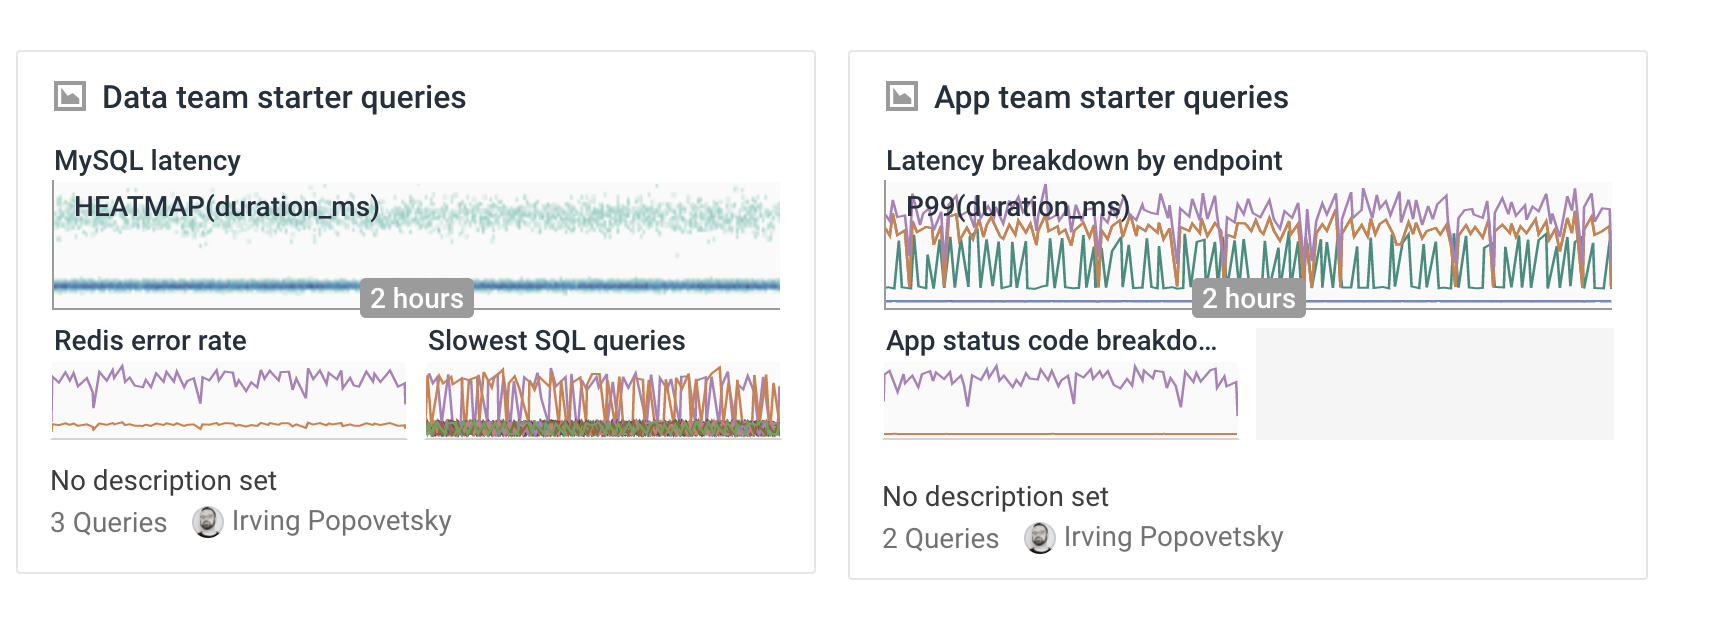
Boards are a great starting point for investigations. Save helpful queries and group them together by context. Plus, your saved queries help your teammates get to know the query builder.
Field Descriptions
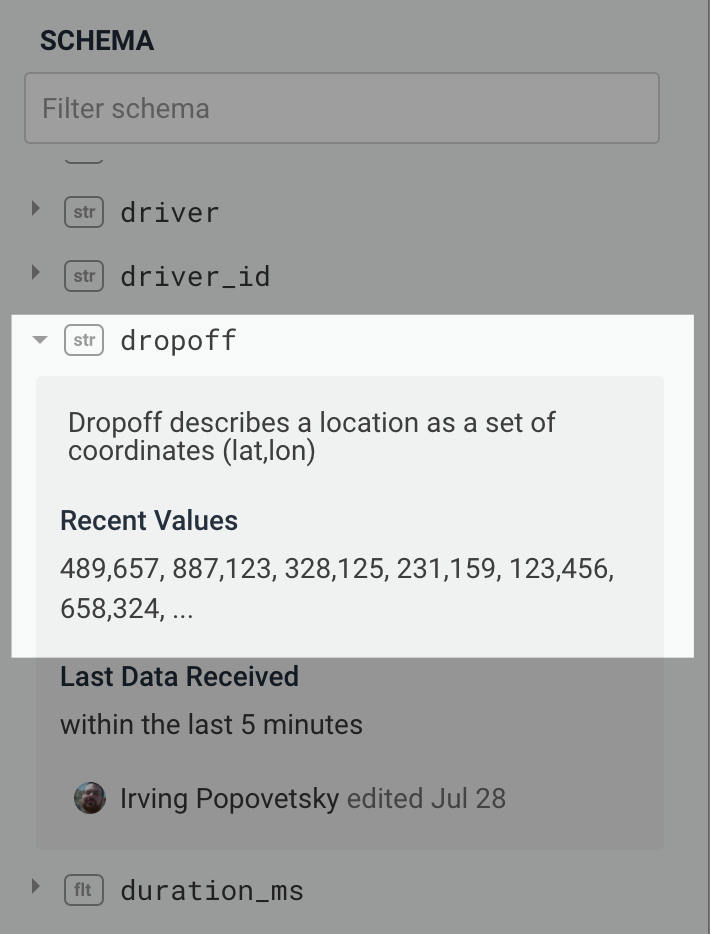
Last but not least, make life easier for your coworkers by adding descriptions to vague field names! Descriptions can be easily added or edited right from the sidebar on the query interface.
You got this!
For more info on supporting your team’s observability journey, download our e-guide: “Developing a Culture of Observability.”


