Apdex in Honeycomb
“How is my app performing?” is one of the most common, yet hardest questions to answer. There are myriad ways to measure this, like error rate, average response time, and so on. Enter the Application Performance Index (aka Apdex), a single metric that attempts to answer, “Are my application’s users happy?”

By: Max Aguirre

“How is my app performing?” is one of the most common, yet hardest questions to answer. There are myriad ways to measure this, like error rate, average response time, and so on. Enter the Application Performance Index (aka Apdex), a single metric that attempts to answer, “Are my application’s users happy?”
Apdex is an open standard that was formalized in 2005 by the Apdex Alliance. The objective was to simplifty application performance reporting by representing user satisfaction with app response time as a single number. This number, the Apdex score, is a value that ranges from 0 to 1, with 0 meaning no users are satisfied, and 1 meaning all users are satisfied. Short, sweet, and to the point!
Calculating an Apdex score
To calculate an Apdex score, the Apdex threshold T must be established. The threshold is an arbitrary value indicating a response time that is considered tolerable by the application team. This value is used to mark a request as Satisfied, Tolerating, or Frustrated.
Satisfied: The response time is less than or equal to T.
Tolerating: The response time is greater than T and less than or equal to 4T.
Frustrated: The response time is greater than 4T or the request returns a server-side error.
Example: If ApdexT = 1 second
These Satisfied, Tolerating, and Frustrated counts are then plugged into the following equation to give the Apdex score.

Let’s say we have 100 samples with 50 satisfied, 30 Tolerating, and 20 Frustrated.
50 + (0.5 * 30) + (0 * 20) / 100 = 0.65
An Apdex score of 0.65? Not so hot. Frustrated requests greatly affect the score: if just five of those were Satisfied and five were Tolerating, the score would increase to 0.725.
Calculating Apdex in Honeycomb
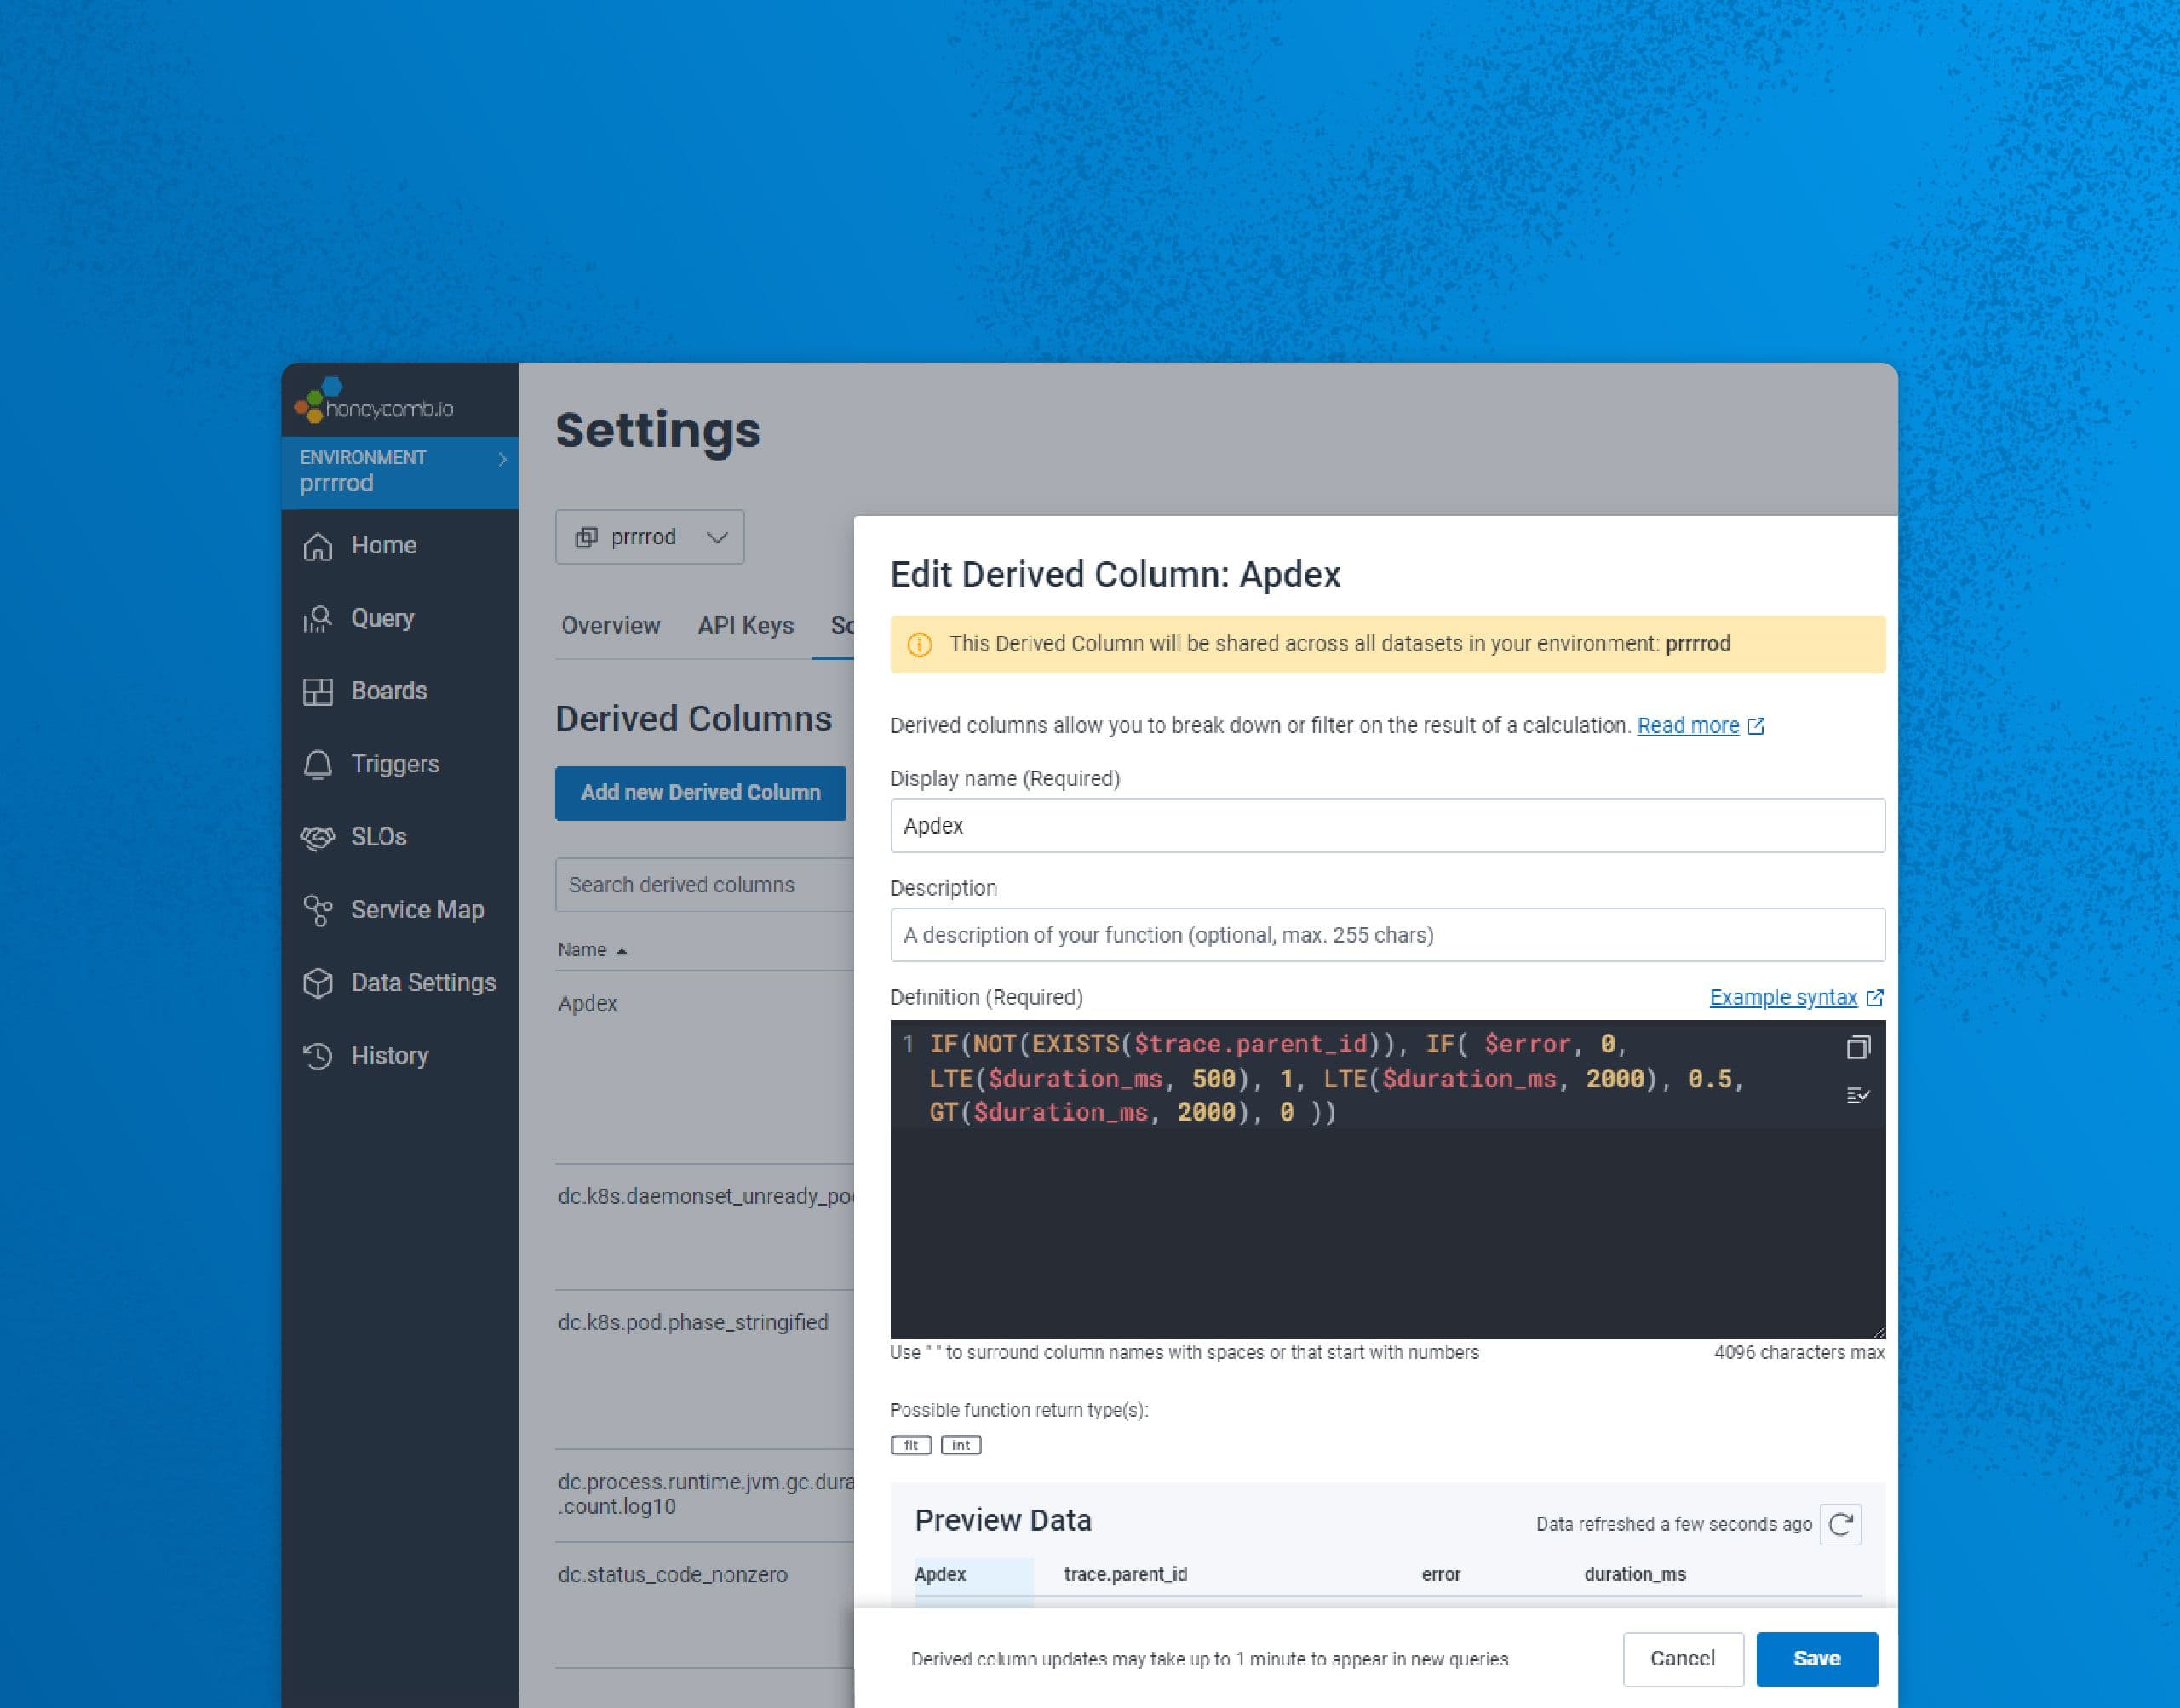
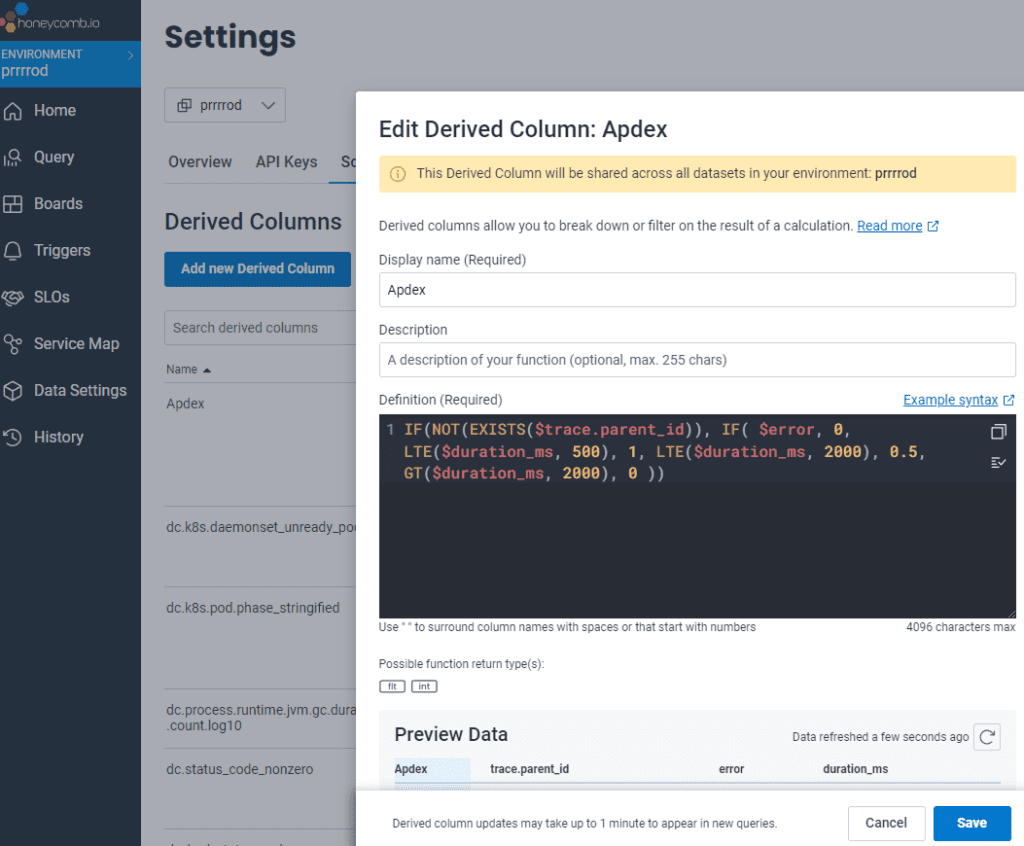
Apdex can be calculated in Honeycomb through the use of a Derived Column. Derived Columns allow you to define custom fields in a dataset or environment. In this case, the value of the custom field will be the Apdex score.
First, we need to create the Derived Column formula. The Apdex equation becomes:
IF( NOT(EXISTS($trace.parent_id)), IF( $error, 0, LTE($duration_ms, 500), 1, LTE($duration_ms, 2000), 0.5, GT($duration_ms, 2000), 0 ) )
Next, visit the environment schema page. Select the Environments label on the top left, select Manage Environments, locate the environment which the Derived Column will be added to, click the Schema tab, and finally, select Add New Derived Column.

As Apdex is meant to measure user satisfaction, it’s important to make sure that a complete request (or trace) is looked at rather than individual spans. The initial IF statement restricts us to looking at spans where there is no trace.parent_id. If a span has no parent, then it is a root span and its duration represents the complete trace. The following statements define the Satisfied, Tolerating, and Frustrated bounds:
- If it’s an error, it gets a 0 (Frustrated)
- If the duration is less than 500ms (Apdex T), it gets a 1 (Satisfied)
- If the duration is less than 4x that (2000ms), it gets a 0.5 (Tolerating)
- If the duration is greater than 4x that (2000ms), it gets a 0 (Frustrated)
Once the Derived Column is created, it can be used in a query just like any other field. Here’s an example of this Derived Column in action:


Onwards!
Throw that bad boy on a Board and you can monitor your Apdex score over time. To go even further, create multiple Derived Columns with different threshold values and add them all to a Board. This way, you can use Apdex to show the current state of things and how improvements/degradations would affect user satisfaction.
I hope this was helpful! If you enjoyed this quick read, I wrote another post a while back on sampling’s impact on SLOs. Happy reading!
New to Honeycomb? Get your free account today.
Want to know more?
Talk to our team to arrange a custom demo or for help finding the right plan.